Calcareous Tufa Deposition in Connection with Late Pleistocene Abrupt Warming Events
Based on the comparison between the U/Th dates of samples obtained by different authors and the trend of the 18O/16O ratios in the MIS 4-3-2 interval, this short note investigates the relationships between the deposition of calcareous tufa and surface temperature changes. The data analysis indicates that the deposition is decidedly favoured with rising temperatures, as happened repeatedly during the abrupt thermal rises of the Dansgaard-Oeschger events. The above observations confirm the role of climate-induced anomalies of surface/ground thermal gradients in controlling calcareous tufa deposition rates.
Introduction
Calcareous tufa or freshwater travertine is commonly deposited by spring water fed by limestone aquifers, in swamps and lakes, or at stream knickpoints and waterfalls where it builds dams up to several tens of meters high. These features, whose remains are widespread in limestone areas [1], consist of massive bodies of phytohermal travertine [2], encrusted over remnants of mosses and algae which contribute through respiration and photosynthesis to water spraying degassing of CO2 and CaCO3 precipitation [3]. Behind tufa dams, swampy-lacustrine clayey deposits with peaty levels and alternations of phytoclastic travertine layers and buried soils are locally present [4]. The growth of tufa dams occurs where the deposition rate of calcium carbonate from water is high enough to balance the streamflow erosion [5].
There is general agreement in referring to climate controls the deposition of calcareous tufa, particularly the aggradation/erosion of tufa dams during geological times. Warm/wet climates are believed to favor tufa aggradation because of higher levels of biogenic CO2 in soil layers, resulting in higher rates of limestone dissolution [6], higher air temperature at the springs favoring water outgassing [7], and absorption of CO2 by aquatic plants [2]. Conversely, cold/ dry climates are considered to be less favorable for CaCO3 deposition due to: (1) reduction of biological activity in soils; (2) lower air temperatures at the springs; and (3) lesser development of aquatic plants [8, 4].
A further model to explain the increase/decrease of tufa deposition rates refers to anomalies of thermal gradients between the ground surface and the limestone aquifer induced by climate changes [9]. Because of the low thermal conductivity of the rocks Vasseur, et al. [10] and the related slow ground penetration of thermal changes, reversed thermal gradients with differences of temperature up to several degrees may be produced between the ground surface and the underlying bedrock over timescales ranging from years to thousands of years in relation to thermal change magnitude and the aquifer thickness [11]. With climatic changes to warmer conditions, such as that which occurred at the Pleistocene-Holocene transition, water percolating through progressively colder layers in the vadose belt and the phreatic zone undergoes a progressive enrichment in dissolved CaCO3 [12, 5]. At the emergence, because of higher surface temperatures, the spring water becomes over- saturated with CaCO3 inducing deposition of tufa at waterfalls, knick-points, or on the river bed itself. Tufa aggradation may continue for a long time, even if with progressively lower deposition rates, till the thermal disturbance’s exhaustion in the ground. Opposite effects, such as deposition of dissolved carbonate in the upper bedrock fractures and emergence of “aggressive” spring waters, under-saturated with CaCO3, should be expected with climate shifting to cold conditions.
The rapid growth of tufa dams observed in both East Africa and Europe during the Holocene with changes from cold to warm temperatures and the fall of tufa deposition rates at warm to cold transition [13, 14, 15] provide some support to the above model.
Investigations carried out in different parts of the world indicates that deposition of calcareous tufa also occurred in earlier Quaternary times, especially during the Interglacials, typically characterized by warm temperatures [16, 17, 18, 19, 8]. However, a more limited deposition of calcareous tufa was also recognized during the last glacial period by different authors (see Table 1).
This short note aims to investigate in detail the relationships between climatic changes and tufa deposition during the Late Pleistocene (MIS 4-3-2), a time interval characterized by the occurrence of several very cold periods known as Heinrich (H) events [20, 21] and much warmer periods named Dansgaard-Oeschger (D-O) events [22, 23] inducing abrupt increases of surface temperature up to 15°C [24, 25, 26] and related advances of arboreal vegetation cover [27].
Climate Changes during the MIS 4-3-2
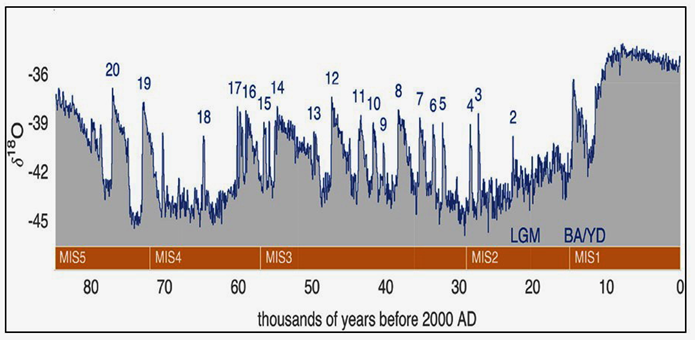
The so-called “marine isotope stages” (MIS) are periods of Earth evolution showing a specific trend of the 18O/16O ratio (_δ_18O) in atmospheric and marine water, continental ice, and organic carbonates, indicating moments with different global temperatures and climates. MIS 4, 3, and 2 are interposed between MIS 5, the last interglacial period, and MIS 1, the present interglacial, the Holocene in the geological scale. MIS 3 is a relatively warmer interval lasting approximately 30 ka, between ca. 59.5 and 29.5 ka BP; MIS 4 (ca. 71 - 57 ka BP), and MIS 2 (ca. 29.5 - 14 ka BP) correspond to cold stadial events, the latter including the Last Glacial Maximum (LGM), ca. 24 ka BP [28, 24, 29, 25].
In the MIS 4-3-2 interval, six major Heinrich (H) events have been recognized, ending at about 16.8 (H1), 24 (H2), 31 (H3), 39.5 (H4), 48.5 (H5), and 59.9 (H6) ka BP, and at least 17 Dansgaard–Oeschger (D-O) events at about 14 (D-O 1), 22.8 (D-O 2), 27.5 (D-O 3), 28.6 (D-O 4), 32 (D-O 5), 33.8 (D-O 6), 35 (D-O 7), 38.8 (D-O 8), 39.4 (D-O 9), 41.5 (D-O 10), 43.4 (D-O 11), 46.8 (D-O 12), 48.8 (D-O 13), 54.5(D-O 14), 56.8 (D-O 15), 59.5 (D-O 16), 59.9 (D-O 17), and 64.5 ka BP [30, 31]. The “Younger Dryas” cold event (12.8 – 11.5 ka BP) could be considered as the last Heinrich event [32]. Not all of these events were of identical magnitude and total duration that was, for each whole cycle, probably around 1–2 kyr long on average [32]. During the D-O events, the sea- surface temperatures increased by ca. 4-6°C, resulting in a reinforcement of the thermohaline circulation and the Gulf Stream; the surface temperatures in the northern Atlantic Ocean were perhaps slightly colder than the present ones but much warmer than during the full glacial conditions [33, 32].
Research Methods
In this research, we compare a large number of U/Th dates of calcareous tufa (excluding those related to thermal waters) obtained by different authors in the Mediterranean region over the 71 - 14 ka BP interval (MIS 4-3-2) with the _δ_18O and related surface temperatures record provided by the Greenland ice-sheet coring [31] and the abundance of foraminifera (Globigerina Bulloides and Neogloboquadrina Pachyderma) in cores drilled from the bottom of the Atlantic Ocean [34].
More specifically, we have examined all the U/Th tufa dates available in scientific publications regarding nine countries from the northern hemisphere (Ethiopia, Egypt, Hungary, Israel, Italy, Morocco, Spain, Sweden, and the United States of America), omitting those with uncertainty intervals greater than one-fifth of the central value. Thus, we have obtained a list of 102 dates to which we have added two other unpublished dates from Central Italy, provided by the Enviromental and Isotope Geochemistry Laboratory of Roma Tre University. The relative information (sampling countries and bibliographic references) is shown in Table 1.
| Ethiopia | Moeyersons, et al. [35] |
|---|---|
| Egypt | Crombie [36] and Smith [37] |
| Hungary | Sierralta, et al. [38] |
| Israel | Schwarcz [39] and Kronfeld [40] |
| Italy | Carrara [41], Carrara [42]; Soligo, et al. [43]; Carrara, et al. [44]; Dramis [45]; Fubelli [4]; Enviromental and Isotope Geochemistry Laboratory of Roma Tre University (13) |
| Morocco | Boudad [46]; Weisrock [47] |
| Spain | Peña [48]; Mart´ın-Algarra, et al. [49]; Díaz-Hernández and Juliá [50]; Valero-Garcés, et al. [51]; Pérez-Peña, et al. [52]; González-Pellejero, et al. [53]; Peña, et al. [54]; Scotti, et al. [55] |
| Sweden | Gustavsson and Hogberg [56] |
| U.S.A. | Lao and Benson [57]; Szabo, et al. [58] |
Table 1: Consulted publications and related investigation countries.
Results
By comparing the dates with the distribution of the relevant warm/cold temperatures peaks in the MIS 2-3- 4 chronological interval (Table 2), we can observe that most of tufa deposition (87 out of 104 dates) has occurred during periods of rising temperatures to relatively warm peaks (mostly corresponding with D-O events), after colder intervals, marked in six cases by the occurrence of H events (Figure 1).
| Warm Peak 14 ka BP– DO-1 | Cold Peak 24.4 ka BP – H2 | Cold Peak 38.5 ka BP | 50.2 ± 3.7 ka BP (21) |
|---|---|---|---|
| 14.0 ± 3.0 ka BP (25) * | 25.0 ± 1.8 ka BP (5) | Warm Peak 38.8 BP | Cold Peak 5*-0.2 ka BP |
| 14.1 ± 0.5 ka BP (1) | 26.2 ± 1.3 ka BP (21) | 38.9 ± 2.1 ka BP (6) | Warm Peak 50.5 ka BP |
| 14.2 ± 2.7 ka BP (7) | Warm Peak 27.5 ka BP– DO-3 | Cold Peak 39.2 ka BP – H4 | 50.7 ± 2.5 ka BP (5) |
| 15.4 ± 0.3 ka BP (15) | 27.7 ± 4.9 ka BP (15) | Warm Peak 39.4 ka BP– DO-9 | Cold Peak 51.4 ka BP |
| 15.7 ± 1.3 ka BP (10) | Cold Peak 28 ka BP | 40.5 ± 2.1 ka BP (6) | 53.0 ± 2.0 ka BP (22) |
| 15.8 ± 1.1 ka BP (1) | Warm Peak 28.6 ka BP– DO-4 | Cold Peak 40.5 ka BP | Warm Peak 54.5 ka BP– DO-14 |
| 16.0 ± 0.7 ka BP (17) | 28.7 ± 1.4 ka BP (1) | Warm Peak 40.8 ka BP | 55.0 ± 6.0 ka BP (13) |
| 16.1 ± 0.1 ka BP (26) | 29.4 ± 1.6 ka BP (6) | 41.0 ± 2.0 ka BP (23) | 55.0 ± 9.0 ka BP (20) |
| 16.3 ± 1.7 ka BP (26) | Cold Peak 29.5 ka BP | 41.8 ± 3.1 ka BP (5) | 55.9 ± 9.1 ka BP (15) |
| 16.5 ± 1.5 ka BP (7) | 29.9 ± ka BP (14) | 42.0 ± 5.5 ka BP (7) | Cold Peak 56 ka BP |
| 16.6 ± 0.7 ka BP (26) | Warm Peak 30 ka BP | 42.5 ± 6.0 ka BP (15) | Warm Peak 56.8 ka BP– DO-15 |
| 16.8 ± 0.5 ka BP (14) | 30.2 ± 5.5 ka BP (15) | Cold Peak 42.5 ka BP | 57.0 ± 5.5 ka BP (7) |
| Cold Peak 16.8 ka BP – H1 | 30.9 ± 0.5 ka BP (26) | Warm Peak 43.4 ka BP– DO-11 | 57.3 ± 3.0 ka BP (26) |
| 16.9 ± 1.2 ka BP (26) | Cold Peak 31 ka BP – H3 | 43.9 ± 1.5 ka BP (19) | 57.4 ± 5.5 ka BP (8) |
| Warm Peak 17.5 ka BP | 31.8 ± 1.1 ka BP (1) | 44.0 ± 1.0 ka BP (22) | 57.5 ± 5.3 ka BP (9) |
| 17.8 ± 0.1 ka BP (26) | Warm Peak 32 ka BP– DO-5 | Cold Peak 44.2 ka BP | Cold Peak 57.5 ka BP |
| 17.8 ± 0.5 ka BP (22) | 32.1 ± 1.3 ka BP (15) | 44.4 ± 1.0 ka BP (1) | Warm Peak 58 ka BP |
| 17.9 ± 1.0 ka BP (10) | Cold Peak 32.2 ka BP | 45.0 ± 2.0 ka BP (26) | 58.5 ± 4.0 ka BP (8) |
| 18.1 ± 0.1 ka BP (26) | 32.4 ± 0.6 ka BP (26) | Warm Peak 45.5 ka BP | Cold Peak 59 ka BP |
| 18.1 ± 0.2 ka BP (26) | 33.0 ± 5.0 ka BP (26) | 45.7 ± 1.6 ka BP (18) | Warm Peak 59.5 ka BP– DO-16 |
| 18.1 ± 0.2 ka BP (26) | Warm Peak 33.8 ka BP | 46.3 ± 3.0 ka BP (26) | Cold Peak 60 ka BP – H6 |
| 18.4 ± 0.6 ka BP (26) | 33.9 ± 1.9 ka BP (15) | 46.0 ± 4.2 ka BP (5) | Warm Peak 59.9 ka BP– DO-17 |
| 19.0 ± 3.0 ka BP (7) | 34.0 ± 3 ka BP (8) | 46.0 ± 5.0 ka BP (12) | Cold Peak 60 ka BP |
| 19.0 ± 2.0 ka BP (25) | 34.3 ± 1.3 ka BP (15) | 46.0 ± 6.0 ka BP (11) | 61.0 ± 1.3 ka BP (16) |
| 19.3 ± 1.0 ka BP (10) | 34.3 ± 2.2 ka BP (10) | Cold Peak 45.8 ka BP | Cold Peak 61.2 ka BP |
| 19.5 ± 1.0 ka BP (26) | 34.4 ± 1.3 ka BP (26) | 46.5 ± 2.9 ka BP (5) | Warm Peak 62.8 ka BP |
| 20.2 ± 0.1 ka BP (26) | Cold Peak 34.4 ka BP | Warm Peak 46.8 ka BP– DO-12 | Cold Peak 63.5 ka BP |
| 20.3 ± 1.4 ka BP (14) | Warm Peak 35 ka BP– DO-7 | 47.3 ± 3.6 ka BP (5) | Warm Peak 64.5 ka BP- DO-18 |
| 20.4 ± 0.1 ka BP (26) | 35.0 ± 3.0 ka BP (26) | 48.0 ± 3.0 ka BP (26) | 62.3 ± 3.0 ka BP 26) |
| 21.2 ± 1.7 ka BP (21) | 35.0 ± 3.2 ka BP (15) | 48.0 ± 6.5 ka BP (7) | 64.8 ± 4.5 ka BP (11) |
| Cold Peak 21.2 ka BP | 35.2 ± 1.2 ka BP (10) | 48.4 ± 0.7 ka BP (15) | 67.0 ± 5.6 ka BP (13) |
| 21.6 ± 4.3 ka BP (15) | 35.5 ± 0.4 ka BP (24) | Cold Peak 48.5 ka BP – H5 | 68.0 ± 1.0 ka BP (25) |
| 21.9 ± 0.3 ka BP (26) | 36.2 ± 1.0 ka BP (15) | Warm Peak 48.8 ka BP– DO-13 | 68.0 ± 2.0 ka BP (2) |
| 22.5 ± 0.4 ka BP (1) | Cold Peak 37 ka BP | 49.0 ± 2.0 ka BP (5) | 68.0 ± 6.0 ka BP (20) |
| 22.6 ± 1.3 ka BP (6) | 37.4 ± 2.0 ka BP (15) | 49.0 ± 2.0 ka BP (25) | 69.2 ± 4.3 ka BP (15) |
| Warm Peak 22.8 ka BP– DO-2 | Warm Peak 38 ka BP– DO-8 | 49.5 ± 5.0 ka BP (25) | 69.3 ± 2.2 ka BP (15) |
| 23.2 ± 1.3 ka BP (10) | 38.2 ± 2.7 ka BP (15) | 49.8 ± 0.1 ka BP (3) | |
| 24.4 ± 1.6 ka BP (10) | 38.4 ± 1.6 ka BP (15) | 50.0 ± 2.0 ka BP (26) |
Table 2: Tufa dates and surface temperature cold/warm peaks in the MIS 2-3-4 chronological interval. All dates have been reset to
Concluding Remarks
Despite the intrinsic approximation of the cold/warm peak ages and the uncertainty ranges of the tufa dates, sometimes too high in relation with the considered cold- warm intervals, the distribution of their central (most probable) values indicates how the deposition of calcareous tufa has occurred, above all, during the transition intervals from the cold peaks to the warm ones, even in the case of significantly low surface temperatures, commonly considered not favorable to the deposition of calcareous tufa.
Many dates are located just after the thermal minima in the rising temperature trends.
On the contrary, definitely less frequent are tufa deposition dates in the same ranges of surface temperatures but with a cooling climate trend. It is interesting that the number of tufa dates is quite high even in MIS 2, in decidedly colder climatic conditions. Without questioning the general control of temperature and aridity on the deposition of calcareous tufa [59, 8, 14], the comparison between the tufa dates and the 18O/16O ratios trend in the MIS 4-3-2 interval indicates that the deposition of calcareous tufa is more active with rising surface temperatures [60]. The above observations seem to confirm further the role of climate- induced anomalies of surface/ground thermal gradients in controlling the rates of calcareous tufa deposition [61, 62].
References
-
Ford TD, Pedley HM (1996) A review of tufa and travertine deposits of the world. Earth Science Reviews 41(3-4): 117-175.
-
Pedley HM (1990) Classification and environmental models of cool freshwater tufas. Sedimentary Geology 68: 143-154.
-
Hynes HBN (1978) The Ecology of Running Waters. University Press, Liverpool, pp: 378.
-
Pentecost A (2005) Travertine. Springer-Verlag, Berlin, pp: 445.
-
Fubelli G, Dramis F, Calderoni G, Cilla G, Materazzi M, et al. (2013) Holocene aggradation/erosion of a tufa dam at Triponzo (Central Italy). Geografia Fisica e Dinamica Quaternaria 36: 259-266.
-
Atkinson TC (1977) Carbon dioxide in the atmosphere of the unsaturated zone: an important control of hardness in limestones. Journal of Hydrology 35(2): 111-123.
-
Gullentops F, Mullenders W (1972) Age et formation de dépôts de tuf calcaire Holocène en Belgique. In: Macar P, Pissart A (Eds.), Processus périglaciaires étudiés sur le terrain, C.R. Symposium International de Géomorphologie., Liège-Caen, 67: 113-135.
-
Vaudour J (1986) Travertines holocènes et pression anthropique. Mediterranée 57(1-2): 168-173.
-
Dramis F, Materazzi M, Cilla G (1999) Influence of climatic changes on freshwater travertine deposition: a new hypothesis. Physics and Chemistry of the Earth 24(10): 893-897.
-
Vasseur G, Bernard PH, Van de Meulebrouck J, Kast Y, Jolivet J (1983) Holocene paleotemperatures deduced from borehole temperature data. Paleogeography, Paleoclimatology, Paleoecology 43(4): 237-259.
-
Williams PJ, Smith NW (1989) The Frozen Earth. Fundamentals of Geocryology. Cambridge University Press, Cambridge.
-
Thrailkill J (1968) Chemical and hydrologic factors in the excavation of limestone caves. Geological Society America Bulletin 79(1): 19-46.
-
Dramis F, Umer M, Calderoni G, Haile M (2003) Holocene climate phases from buried soils in Tigray (northern Ethiopia): comparison with lake level fluctuations in the main Ethiopian Rift. Quaternary Research 60(3): 274- 283.
-
Dramis F, Fubelli G, Calderoni G, Esu D (2014) Holocene aggradation/ degradation phases of tufa dams in northern Ethiopia and central Italy: a palaeoclimatic comparison between East Africa and Mediterranean Europe. Zeitschrift für Geomorphologie 58(4): 419-434.
-
Dramis F, Fubelli G (2015) Tufa dams in Tigray (Northern Ethiopia) as Late Pleistocene- Holocene climate proxies. In: Billi P (Ed.) Landscapes and Landforms of Ethiopia, World Geomorphological Landscapes, Springer, Netherlands, pp. 201-211.
-
Hennig GJ, Grun R, Brunnacker K (1983) Speleothems, travertines and paleoclimates. Quaternary Research 20(1): 1-29.
-
Preece RC, Thorpe PM, Robinson JE (1986) Confirmation of an interglacial age for the Condat Tufa (Dordogne, France) from biostratigraphic and isotopic data. Journal of Quaternary Science 1(1): 57-65.
-
Frank N, Braum M, Hambach U, Mangini A, Wagner G (2000) Warm period growth of travertine during last Interglaciation in Southern Germany. Quaternary Research 54(1): 38-48.
-
Horvatincˇic´ N, Calic R, Geyh MA (2000) Interglacial growth of tufa in Croatia. Quaternary Research 53(2): 185-195.
-
Heinrich H (1988) Origin and consequences of cyclic Ice rafting in the northeast Atlantic Ocean during the past 130,000 years. Quaternary Research 29(2): 142-152.
-
Hodell DA, Evans HF, Channell JET, Curtis JH (2010) Phase relationships of North Atlantic ice-rafted debris and surface-deep climate proxies during the last glacial period. Quaternary Science Reviews 29(28): 3875-3886.
-
Dansgaard W, Johnsen S, Clausen H, DahlJensen D, Gundestrup N, et al. (1993) Evidence for general instability of past climate from a 250 ka ice-core record. Nature 364: 218-220.
-
Bond GC, Showers W, Elliot M, Evans M, Lotti R, et al. (1999) The North Atlantic’s 1-2 kyr climate rhythm: relation to Heinrich events, Dansgaard/Oeschger cycles and the Little Ice Age. In: Clark PU, Webb RS, Keigwin LD (Eds.), Mechanisms of Global Change at Millennial Time Scales. Geophysical Monograph 112, American Geophysical Union, Washington D.C., pp: 59-76.
-
Martrat M, Grimalt JO, Lopes-Martinez C, Cacho I, Sierro FJ, et al. (2004) Abrupt temperature changes in the western Mediterranean during the last and penultimate glacial and interglacial periods. Science 306(5702): 1762-1765.
-
Labeyrie L, Skinner L, Cortijo E (2007) Paleoclimate reconstructions. Sub-Milankovitch (DO/Heinrich) events. In: Elias S. (Ed.), Encyclopedia of Quaternary Sciences, Elsevier, Amsterdam, pp: 1964-1974.
-
Van Meerbeeck CJ, Renssen H, Roche DM (2008) How did Marine Isotope Stage 3 and Last Glacial Maximum climates differ? Perspectives from equilibrium simulations. Clim Past 5(1): 33-51.
-
Huntley B, Alfano MJ, Allen JRM, Pollard D, Tzedakis PC, et al. (2003) European vegetation during Marine Oxygen Isotope Stage-3. Quaternary Research 59(2): 195-212.
-
Clark PU, Webb RS, Keigwin LD (1999) Mechanisms of global change at millennial time scales. Geophysical Monograph 112, American Geophysical Union, Washington D.C.
-
Lisiecki LE (2005) Ages of MIS Boundaries., R04 Benthic Stack, Boston University.
-
Ganopolski A, Rahmstorf S (2001) Rapid changes of glacial climate simulated in a coupled climate model. Nature 409(6817): 153-158.
-
Li C, Born A (2019) Coupled atmosphere-ice-ocean dynamics in Dansgaard-Oeschger events. Quaternary Science Reviews 203: 1-20.
-
Rabassa J, Ponce JF (2016) The Heinrich and Dansgaard– Oeschger climatic events during Marine Isotopic Stage 3. In: Gasparini GM, Rabassa J, Deschamps C, Tonni Ep (Eds.), Marine Isotope Stage 3 in Southern South America, 60 ka B.P.–30 ka B.P., Springer Earth System Sciences, pp: 7-21.
-
Peterson LS, Haug GH, Murray RW, Yarincik KM, King JW, et al. (2000) Late Quaternary stratigraphy and sedimentation at site 1002, Cariaco basin (Venezuela). In: Leckie RM, Sigurdsson H, Acton GD, Draper G (Eds.), Proceedings of the Ocean Drilling Program, Scientific Results, College Station, TX (Ocean Drilling Program_)_, 165: 1-15.
-
Rasmussen TL, Thomsen E, Moros M (2016) North Atlantic warming during Dansgaard-Oeschger events synchronous with Antarctic warming and out-of-phase with Greenland climate. Scientific Reports 6: 20535.
-
Moeyersons J, Nyssen J, Poesen J, Deckers J, Haile M (2006) Age and backfill/overfill stratigraphy of two tufa dams, Tigray Highlands, Ethiopia: evidence for late Pleistocene and Holocene wet conditions. Paleogeography, Paleoclimatology, Paleoecology 230(2): 165-181.
-
Crombie MK, Arvidson RE, Sturchio NC, El Alfy Z, Abu Zeid K (1997) Age and isotopic constraints on Pleistocene pluvial episodes in the Western Desert, Egypt. Palaeogeography, Palaeoclimatology, Palaeoecology 130(4): 337-355.
-
Smith JR (2004) A reconstruction of Quaternary pluvial environments and human occupations using stratigraphy and geochronology of fossil‐spring tufas, Kharga Oasis, Egypt. Geoarchaeology 19(5): 407-439.
-
Sierralta M, Kele S, Melcher F, Hambach U, Reinders J, et al. (2010) Uranium-series dating of travertine from Süttö: Implications for reconstruction of environmental change in Hungary. Quaternary International 222: 178- 193.
-
Schwarcz HP, Balckwell B, Goldberg P, Marks AE (1979) Uranium series dating of travertine from archaeological sites, Nahal Zin, Israel. Nature 277: 558-560.
-
Kronfeld J, Vogel JC, Rosenthal E, Weinstein-Evron M (1988) Age and paleoclimatic implications of Bet Shean travertines. Quaternary Research 30(3): 298-303.
-
Carrara C (1994) I travertini di Canino (Viterbo, Italia Centrale): Elementi di cronolitostratigrafia, di geochimica isotopica e loro significato ambientale e climatico geochimica e loro significato ambientale e climatico. Il Quaternario Italian Journal of Quaternary Sciences 7(1): 73-90.
-
Carrara C (1998) I travertini della valle del Pescara tra Popoli e Tor de’ Passeri (Abruzzo, Italia Centrale). Il Quaternario, Italian Journal of Quaternary Sciences 11(2): 163-178.
-
Soligo M, Tuccimei P, Barbieri R, Delitala MC, Miccadei E, et al. (2002) U/Th dating of freshwater travertine from Middle Velino Valley (Central Italy) paleoclimatic and geological implication. Paleogeography Paleoclimatology Paleoecology 184(2): 147-161.
-
Carrara C, Branca M, Pisegna-Cerone E, Verrubbi V, Voltaggio M (2006) Calcareous tufa deposits of the Aniene Valley between Vallepietra and Mandela-Vicovaro (Latium, central Italy) Il Quaternario, Italian Journal of Quaternary Sciences 19(1): 19-44.
-
Dramis F, Soligo M, Graciotti E, D’Orefice M, Graciotti R (2008) U/Th dating of a tufa deposit from the Carsoli intramontane basin (Abruzzo, Italy). Geografia Fisica e Dinamica Quaternaria 31(2): 255-258.
-
Boudad L, Kabiri L, Farkh S, Falguères C, Rousseau L, et al. (2003) Datation par la méthode U/Th d’un travertin quaternaire du Sud-Est marocain: implications paléoclimatiques pendant le Pléistocène moyen et supérieur. CR Geoscience 335(5): 469-478.
-
Weisrock A, Rousseau L, Reyss JL, Falguères C, Ghaleb B, et al. (2008) Travertins de la bordure nord du Sahara marocain: dispositifs morphologiques, datations U/Th et indications paléoclimatiques. Géomorphologie: Relief Processus Environnement 14(3): 153-167.
-
Peña JL, Sancho C, Lozano MV (2000) Climatic and tectonic significance of Late Pleistocene and Holocene tufa deposits in the Mijares River canyon, eastern Iberian Range, northeast Spain. Earth Surface Processes and Landforms 25(13): 1403-1417.
-
Mart´ın-Algarra A, Mart´ın-Mart´ın M, Andreo B, Juli a´ R., Gonza´lez-Go´mez C (2003) Sedimentary patterns in perched spring travertines near Granada (Spain) as indicators of the paleohydrological and paleoclimatological evolution of a karst massif. Sedimentary Geology 161(4): 217-228.
-
Díaz-Hernández JL, Juliá R (2006) Geochronological position of badlands and geomorphological patterns in the Guadix–Baza basin (SE Spain). Quaternary Research 65(3): 467-477.
-
Valero-Garcés B, Moreno A, Morellón M, Corella JP, González-Sampériz P, et al. (2008) Cronología de las tobas de ladera del Río de Las Parras (Cordillera Ibérica, Teruel). Trabajos de Geomorfología en España, 2006 – 2008, X Reunión Nacional de Geomorfología, Cádiz.
-
Pérez-Peña JV, Azañón JM, Azor A, Tuccimei P, Della Seta M, et al. (2009) Quaternary landscape evolution and erosion rates for an intramontane Neogene basin (Guadix–Baza basin, SE Spain). Geomorphology 106(4): 206-218.
-
González-Pellejero R, Martínez-Aguirre A, Allende F, Frochoso M (2012) Las precipitaciones carbonatadas del los cañones del Ebro: avances en su reconocimento y cronología. In: González Díez A (Eds.), Avances de la Geomorfología en España 2010-2012, Actas de la XII Reunión Nacional de Geomorfología, Santander, 17-20 septiembre, pp: 401-404.
-
Peña JL, Sancho C, Arenas C, Auqué L, Logares LA, et al. (2014) Las tobas cuaternarias en el Sector Aragonés de la Cordillera Ibérica. In: González-Martín JM, González Amuchastegui MJ (Eds.), Las Tobas en España, Sociedad Española de Geomorfología, pp: 159-172.
-
Scotti VN, Molin P, Faccenna C, Soligo M, Casas- Sainz A (2014) The influence of surface and tectonic processes on landscape evolution of the Iberian Chain (Spain): Quantitative geomorphological analysis and geochronology. Geomorphology 206: 37-57.
-
Gustavsson JE, Hogberg SAC (1972) Uranium/thorium dating of Quaternary carbonates. Boreas 1(4): 247-274.
-
Lao Y, Benson L (1988) Uranium-series age estimates and Paleoclimatic significance of Pleistocene tufas from the Lahontan Basin, California and Nevada. Quaternary Research 30(2): 165-176.
-
Szabo BJ, Bush CA, Benson LV (1996) Uranium-series dating of carbonate (tufa) deposits associated with Quaternary fluctuations of Pyramid Lake, Nevada. Quaternary Research 45(3): 271-281.
-
Baker A, Smart PL, Ford DC (1993) Northwest European palaeoclimate as indicated by growth frequency variations of secondary calcite deposits. Paleogeography Paleoclimatology Paleoecology 100(3): 291-301.
-
Braum FN, Hambach M, Mangini A, Wagner G (2000) Warm period growth of travertine during the Last Interglaciation in Southern Germany. Quaternary Research 54(1): 38-48.
-
Cacho I, Grimalt JO, Canals M (2002) Response of the Western Mediterranean Sea to rapid climatic variability during the last 50,000 years: a molecular biomarker approach. Journal of Marine Systems 33-34: 253-272.
-
Hemming SR (2004) Heinrich events: massive late Pleistocene detritus layers of the North Atlantic and their global climate imprint. Reviews of Geophysics 42(1): 2-43.
- Lessons to Learn: Trees are More than the Lungs of the World
- Community Forestry Enterprises as a Model for Sustainable Forest Development: The Case Of The "Baja Tarahumara" in Chihuahua, Mexico
- Ecological and Socio-Economic Impacts of Chromolaena odorata and Mesosphaerum suaveolens, Two Invasive Alien Species in Central and Southern Benin, West Africa
- Epigenetic Sustainability: Modeling the Human Factor as a Natural Resource through Science 4.0 and the NR3C1 Biological Pilot
- Growth-at-Risk: A Framework for Assessing Economic Vulnerability
- The Rural Territory as a Socioecological System for the Management of Public Policy for Sustainable Rural Development