Shifts in Hydro Climatology of U.S. Croplands
Changes in precipitation, temperature and water availability can significantly affect crop yields and hence food security at local and national scales. Despite the significant foreseen changes in hydroclimatology of croplands across the United States over the last decades, there are still lacking consistent information on how future hydroclimatic conditions of U.S. major croplands may change in response to climate change. This study investigates and quantifies shifts in hydroclimatology of five major crops including cotton, corn, soybean, sorghum, and wheat across the conterminous United States (CONUS). The results indicate that the direction and magnitude of hydroclimatic changes are highly variable across the climate projections. However, on average, hydroclimatic changes have a higher impact on sorghum and cotton, respectively. Understanding how croplands can be affected by climate change in the future can help decision-makers and water planners for the implementation and expansion of adaptive paths such as irrigation and conservation plans.
Introduction
Agriculture is by far one of the largest water use sectors in the United States that can be significantly influenced by future hydro climatic change [1, 2, 3]. Climate change already made a reduction in average yields of most major U.S crops [4]. An increase in temperature and changes in precipitation patterns during the growing season may lead to a decrease in crop productivity [5]. Enhanced understanding of shifts in the hydroclimatology of croplands has gained much attention as a key factor in investigating the climate-water-food nexus [6] which is not sufficiently and quantitatively reported in the previous studies [7].
The main goal of this study is thus to obtain a meaningful and quantitative understanding of how each US major cropping region can be affected in response to climate change. To this end, we evaluated shifts in regional hydroclimatic conditions of U.S. croplands by movements on the Budyko space from current (1986-2015) to future (2070-2099) conditions. The Budyko framework was applied as an effective way to evaluate the integrated effects of hydroclimatic variables [8, 9]. We calculated shifts in the Budyko space for five major crops including cotton, corn, soybean, sorghum, and wheat within the United States.
The analysis is based on the projected Multivariate Adaptive Constructed Analogs (MACA) climate dataset [10] ranging from the driest to wettest projections at the 8-digit hydrologic unit code (HUC8) basin scale [11]. We considered three climate projections including wettest (WET), driest (DRY), and a model located near the middle of these ranges (MID) to account for uncertainties on the spatial pattern and magnitude of changes in precipitation and temperature [11, 12]. We characterized which agricultural sectors are more vulnerable to hydroclimatic change.
Materials and Methods
We obtained the current climate variables from a combination of Daymet [13] and the Parameter-elevation Regressions on Independent Slopes Model (PRISM) datasets [14]. Future climate variables were also obtained from the downscaled Multivariate Adaptive Constructed Analogs (MACA) datasets [10].
The current and future climatic variables were then inputted to the Variable Infiltration Capacity (VIC) hydrological model to project changes in water availability of HUC8 river basins inside the US croplands. Readers are referred to Heidari [11] for the details about the VIC model calibration and evaluation.
Then, we determined changes in hydroclimatology of each cropland as a function of shifts in the Budyko space [8] (Figure 1). The Budyko space describes a relationship between evaporative and aridity indices [15]. The evaporative index is the ratio of actual evapotranspiration to precipitation [16] while the aridity index is the ratio of potential evapotranspiration to precipitation [17, 18].
![Figure 1: Characterization of magnitude and direction of movements in the Budyko space [11].](/fulltextimages/8522/fig_1.png)
A river basin can move over time on the Budyko space due to a combination of shifts in aridity and evaporative indices. Change in the aridity index can represent climatic shifts while changes in the evaporative index can show shifts in water availability of river basins.
The combination of shifts in the Budyko space can be identified by the direction and magnitude of movements [16, 19, 20]. The direction of movement can be defined by $$ D i r e c t i o n (D) = \arctan \left(\frac {\Delta y}{\Delta x}\right) \tag {1} $$ where y ∆ is change in the evaporative index and x ∆ is change in the aridity index (Figure 1). Subsequently, the magnitude of change in the Budyko space can be obtained as follows:
( ) $$ \operatorname {M a g n i t u d e} (M) = \sqrt {x ^ {2} + y ^ {2}} \tag {2} $$ Overall, moving to the right means warmer and drier climatic conditions, and moving to the left means less arid conditions. Besides, moving to down indicates a higher rate of river discharge or wetter conditions while moving to up indicates less water yield or streamflow for a given HUC8 river basin.
We quantified changes in hydroclimatic conditions of each cropland by average movements of river basins on the Budyko space. The direction represents regional differentiation and the magnitude of change identifies the most sensitive regions [21].
Results
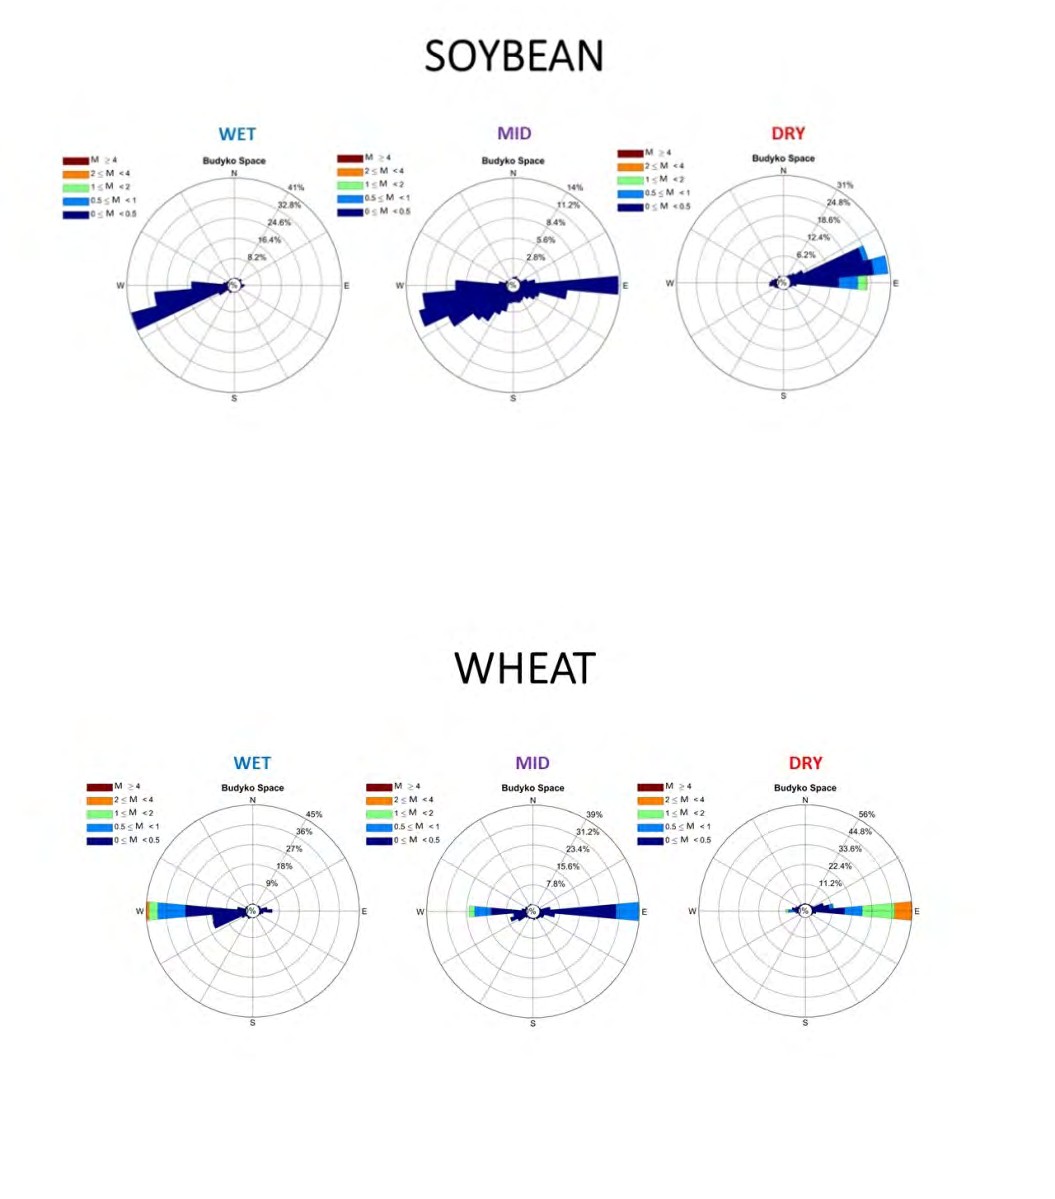
The direction and magnitude of hydroclimatic changes are highly variable across the WET, MID, and DRY climate projections. Table 1 shows the average change in magnitude and direction of each U.S. croplands under the WET, MID, and DRY climate models. Additionally, the wind rose diagrams of changes in hydroclimatology of U.S. croplands are shown in Figure 2. Each wind rose visualizes the summary of movements in the Budyko space including direction, magnitude, and frequency for all HUC8 river basins inside of croplands. This type of diagram has been commonly applied in global hydroclimatic change assessments [22]. Under the WET and MID climate models, Soybean is likely to experience the wettest conditions among all five crops while wheat has the highest magnitude of change indicating that the hydroclimatology of wheat cropping land will be more affected by climate change (Table 1).
Under the DRY climate model, all five crops move to the upper-right quadrant of the Budyko space indicating warmer and drier hydroclimatic conditions. Cotton has the worst direction and sorghum has the highest magnitude. Under all climate models, it can be concluded that the hydroclimatology of sorghum, cotton, and wheat is more likely to be affected under future climate change.
| Crop | Average | WET | MID | DRY | Average |
|---|---|---|---|---|---|
| corn | direction | 189.2 | 213.0 | 59.4 | 153.9 |
| magnitude | 0.18 | 0.13 | 0.45 | 0.25 | |
| cotton | direction | 166.8 | 131.3 | 46.3 | 114.8 |
| magnitude | 0.18 | 0.25 | 0.97 | 0.46 | |
| sorghum | direction | 161.7 | 131.7 | 32.3 | 108.6 |
| magnitude | 0.19 | 0.27 | 1.41 | 0.62 | |
| soybean | direction | 191.3 | 223.7 | 58.5 | 157.8 |
| magnitude | 0.16 | 0.09 | 0.29 | 0.18 | |
| wheat | direction | 179.5 | 172.9 | 83.8 | 145.4 |
| magnitude | 0.31 | 0.28 | 0.77 | 0.45 |
Table 1: Average changes in magnitude and direction of U.S. croplands.
Corn
![Figure 2: Each wind rose visualizes the summary of movements in the Budyko space including direction, magnitude, and frequency for all HUC8 river basins inside of croplands. This type of diagram has been commonly applied in global hydroclimatic change assessments [22]. Under the WET and MID climate models, Soybean is likely to experience the wettest conditions among all five crops while wheat has the highest magnitude of change indicating that the hydroclimatology of wheat cropping land will be more affected by climate change (Table 1).](/fulltextimages/8522/fig_2.jpeg)
Cotton
Sorghum
Soybean
Wheat
Discussion
Water availability is a vital need for a wide range of agricultural activities [23]. Long-term hydroclimatic changes may have significant impacts on regional water resources [24]. The findings of this study can help decision-makers to be prepared and react appropriately to changes in regional hydroclimatic conditions of croplands and their potential consequences on water and food resources, particularly under ongoing severe situations like the COVID pandemic [25], water shortages [24, 26] and wildfires [27]. Long-term hydroclimatic changes may force farmers to change their crops based on the new regional hydroclimate conditions. Future projections of hydroclimatic changes in U.S. croplands can help managers, planners, and decision-makers to maximize crop production and prioritize water resources allocation by improving water resource management [7]. However, there are some important questions that should be addressed in this case as a prospect of this study.
The first question that can be raised here is how shifts in hydroclimatology of cropping regions may affect future crop productions. Although climate change may have positive impacts on agricultural productivity in some regions, it can reduce crop yields in regions that currently have optimal climate conditions [6, 28, 29]. For instance, Cho and McCarl [30] reported that cotton and sorghum are more appropriate under the warming temperature. Besides, sorghum, and spring wheat are more likely to be selected under drier conditions, while corn, cotton, and soybeans are better choices for wetter conditions [30]. Additionally, it is worth mentioning that while an increase in precipitation may be beneficial for most growing regions, it can have negative impacts on some cropping regions because of water-logging and pest disasters [6].
Another important question that should be addressed here is how much irrigation requirement would change in response to hydroclimatic change for maintaining current crop yields. Irrigation has been commonly used as an adaptation tool to increase crop yields and decrease the impacts of climate changes [31, 32, 33]. Considerable research has investigated the effects of climate variability on crop yield [34]. However, few studies have focused on the impacts of climate changes on irrigation water requirements [23]. Crop production can be stabilized by increasing irrigation [6, 35, 36, 37, 38]. An increase in irrigation helps crop production meets the current food demand, which may decrease in response to climate change [6]. While irrigation plays a key role in agricultural productivity, the impact of hydroclimatic changes on irrigation water use has not been well studied [31]. The impacts of climate change on irrigation water use have been rarely studied due to limited data availability [31].
Additionally, there is a few research on how irrigated and rainfed crop yields respond differently to climate change over five major US cropping regions [6]. Assessing the response of both rainfed and irrigated crop yields to climate change can lead to the improved understanding of the role of irrigation on agricultural productions [6]. Although precipitation plays an important role in dryland production systems, there is still a lack of studies evaluating the impacts of climate change on irrigated crops.
A national, spatially assessing the impacts of hydroclimatic shifts on U.S agricultural regions is needed to be done to provide insight into changes in crop productivity and dependence on irrigation [39].
Acknowledgments
The author thanks Dr. Travis Warziniack and Dr. Mazdak Arabi for their helpful ideas during the preparation of this study.
References
-
Doll P (2002) Impact of climate change and variability on irrigation requirements: A global perspective. Clim Change 54: 269-293.
-
Dieter CA, Maupin MA, Caldwell RR, Harris MA, Ivahnenko TI, et al. (2015) Estimated Use of Water in the United States in 2015: U.S. Geological Survey Circular.
-
Brown TC, Foti R, Ramirez JA (2013) Projected freshwater withdrawals in the United States under a changing climate. Water Resour Res 49(3): 1259-1276.
-
Lu W, Adamowicz W, Jeffrey SR, Goss GG, Faramarzi M (2018) Crop Yield Response to Climate Variables on Dryland versus Irrigated Lands. Can J Agric Econ 66: 283-303.
-
Liu D, Mishra AK, Yu Z (2019) Evaluation of hydroclimatic variables for maize yield estimation using crop model and remotely sensed data assimilation. Stoch Environ Res Risk Assess 33: 1283-1295.
-
Li X, Troy TJ (2018) Changes in rainfed and irrigated crop yield response to climate in the western US. Environ Res Lett 13(6): 064031.
-
Kukal MS, Irmak S (2018) Climate-Driven Crop Yield and Yield Variability and Climate Change Impacts on the U.S. Great Plains Agricultural Production Sci Rep 8(1): 3450.
-
Heidari H, Arabi M, Warziniack T, Kao SC (2021) Shifts in hydroclimatology of U.S. megaregions in response to climate change. Environ Res Commun 3(6): 065002.
-
Heidari H, Warziniack T, Brown TC, Arabi M (2021) Impacts of Climate Change on Hydroclimatic Conditions of U.S. National Forests and Grasslands. Forests 12(2): 139.
-
Abatzoglou JT, Brown TJ (2012) A comparison of statistical downscaling methods suited for wildfire applications. Int J Climatol 32(5): 772-780.
-
Heidari H, Arabi M, Warziniack T, Kao SC (2020) Assessing Shifts in Regional Hydroclimatic Conditions of U.S. River Basins in Response to Climate Change over the 21st Century. Earth’s Futur 8(10): 1-14.
-
Joyce LA, Coulson D (2020) Climate scenarios and projections.
-
Thornton PE, Running SW, White MA (1997) Generating surfaces of daily meteorological variables over large regions of complex terrain. J Hydrol 190(4): 214-251.
-
Daly C, Halbleib M, Smith JI, Gibson WP, Doggett MK, et al. (2008) Physiographically sensitive mapping of climatological temperature and precipitation across the conterminous United States. Int J Climatol 28(15): 2031- 2064.
-
Budyko MI (1974) Climate and life, International geophysical series. New York Acad. Press: 18.
-
Jaramillo F, Cory N, Arheimer B, Laudon H, Van Der Velde Y, et al. (2018) Dominant effect of increasing forest biomass on evapotranspiration: Interpretations of movement in Budyko space. Hydrol Earth Syst Sci 22(1): 567-580.
-
Yang D, Sun F, Liu Z, Cong Z, Lei Z (2006) Interpreting the complementary relationship in non-humid environments based on the Budyko and Penman hypotheses. Geophys Res Lett 33(18): 1-5.
-
Zhang Q, Liu J, Singh VP, Shi P, Sun P (2017) Hydrological responses to climatic changes in the Yellow River basin, China: Climatic elasticity and streamflow prediction. J Hydrol 554: 635-645.
-
Zaninelli PG, Menéndez CG, Falco M, López-Franca N, Carril AF (2019) Future hydroclimatological changes in South America based on an ensemble of regional climate models. Clim Dyn 52: 819-830.
-
Piemontese L, Fetzer I, Rockström J, Jaramillo F (2019) Future Hydroclimatic Impacts on Africa: Beyond the Paris Agreement. Earth’s Futur 7(7): 748-761.
-
Van der Velde Y, Vercauteren N, Jaramillo F. Dekker SC, Destouni G, et al. (2014) Exploring hydroclimatic change disparity via the Budyko framework. Hydrol Process 28(13): 4110-4118.
-
Destouni G, Jaramillo F, Prieto C (2013) Hydro climatic shifts driven by human water use for food and energy production. Nat Clim Chang 3: 213-217.
-
Fischer G, Tubiello FN, van Velthuizen H, Wiberg DA (2007) Climate change impacts on irrigation water requirements: Effects of mitigation, 1990-2080. Technol Forecast Soc Change 74: 1083-1107.
-
Heidari H, Arabi M, Warziniack T (2021) Vulnerability to Water Shortage under Current and Future Water Supply- Demand Conditions Across U.S. River Basins. Earth’s Futur pp: 9.
-
Heidari H, Grigg NS (2021) Effects of the COVID-19 Pandemic on the Urban Water Cycle. Adv Environ Eng Res 2(3): 1-1.
-
Heidari H, Arabi M, Warziniack T, Sharvelle S (2021) Effects of Urban Development Patterns on Municipal Water Shortage. Front Water 3: 694817.
-
Heidari H, Arabi M, Warziniack T (2021) Effects of Climate Change on Natural-Caused Fire Activity in Western U.S. National Forests. Atmosphere (Basel) 12: 981.
-
Ortiz R, Sayre KD, Govaerts B, Gupta R, Subbarao GV, et al. (2008) Climate change: Can wheat beat the heat? Agric Ecosyst Environ 126(2): 46-58.
-
Luo Q, Williams MAJ, Bellotti W, Bryan B (2003) Quantitative and visual assessments of climate change impacts on South Australian wheat production. Agric Syst 77(3): 173-186.
-
Cho SJ, McCarl BA (2017) Climate change influences on crop mix shifts in the United States. Sci Rep 7: 1-6.
-
Zhu X, Troy TJ, Devineni N (2019) stochastically modeling the projected impacts of climate change on rainfed and irrigated US crop yields. Environ Res Lett pp: 14.
-
Grassini P, Yang H, Cassman KG (2009) Limits to maize productivity in Western Corn-Belt: A simulation analysis for fully irrigated and rainfed conditions. Agric For Meteorol 149(8): 1254-1265.
-
Leng G, Huang M (2017) Crop yield response to climate change varies with crop spatial distribution pattern. Sci Rep 7: 1463.
-
Schimmelpfennig DE (2004) Yield Variability As Influenced By Climate. A Statistical Investigation Clim Change 66: 239-261.
-
Rosegrant MW, Cline SA (2003) Global Food Security: Challenges and Policies. Science 302(5652): 1917-1919.
-
Hanjra MA, Ferede T, Gutta DG (2009) Reducing poverty in sub-Saharan Africa through investments in water and other priorities. Agric Water Manag 96(7): 1062-1070.
-
Hanjra MA, Ferede T, Gutta DG (2009) Pathways to breaking the poverty trap in Ethiopia: Investments in agricultural water, education, and markets. Agric. Water Manag 96(11): 1596-1604.
-
Tack J, Barkley A, Hendricks N (2017) Irrigation offsets wheat yield reductions from warming temperatures. Environ Res Lett 12: 114027.
-
Marston L, Ao Y, Konar M, Mekonnen MM, Hoekstra AY (2018) High-Resolution Water Footprints of Production of the United States. Water Resour Res 54(3): 2288- 2316.
- Lessons to Learn: Trees are More than the Lungs of the World
- Community Forestry Enterprises as a Model for Sustainable Forest Development: The Case Of The "Baja Tarahumara" in Chihuahua, Mexico
- Ecological and Socio-Economic Impacts of Chromolaena odorata and Mesosphaerum suaveolens, Two Invasive Alien Species in Central and Southern Benin, West Africa
- Epigenetic Sustainability: Modeling the Human Factor as a Natural Resource through Science 4.0 and the NR3C1 Biological Pilot
- Growth-at-Risk: A Framework for Assessing Economic Vulnerability
- The Rural Territory as a Socioecological System for the Management of Public Policy for Sustainable Rural Development