Suitability Zoning and Layout Optimization of Forages in Uxin Banner Surrounded by the Mu Us Sandy Land in China
The Mu Us Sandy land is one of the four largest sandy lands in China and the main sources of sand dust in the Beijing-Tianjin area. Uxin Banner, located at the southernmost end of Inner Mongolia Autonomous Region, is surrounded by this sandy land. Nearly one third of the Mu Us sandy land is located in Uxin Banner. Irrational expansion of agricultural land, unordered layout and overgrazing have resulted in the degradation of grassland, which leads to serious ecological problems and makes this area one of the five typical ecological fragile zones in China. Previous studies mostly focused on regional resource carrying capacity and man-land relationship, but few studies were conducted on how to select excellent varieties which are suitable for local resource and environmental background conditions to promote the healthy development of herbage industry. The research methods and conclusions of this paper can make up for this deficiency. Based on GIS and SPSSAU data scientific analysis platform, this paper uses multi-source remote sensing, statistics, surveys and other data to study the suitability zoning of silage planting, comprehensive evaluation of forage varieties, pastoral area industrial planning, etc. The research conclusions and suggestions can promote a high-quality development of agriculture and animal husbandry in Uxin Banner, help farmers and herdsmen to increase income, and provide scientific support for rural revitalization in the new period.
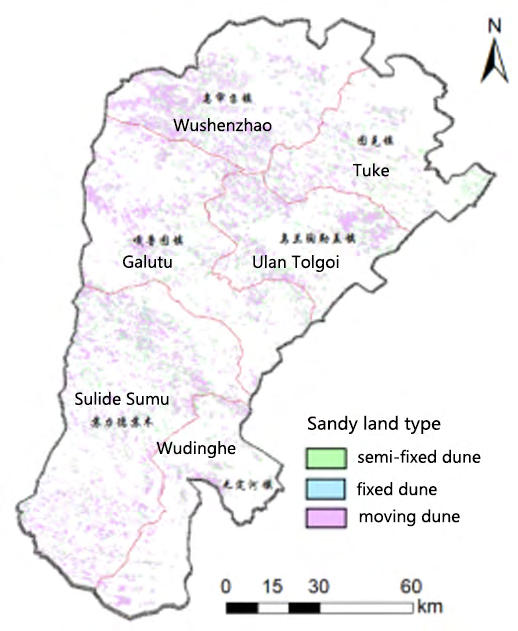
Introduction
China is facing a severe shortage of feed according to the statistics of China Customs, in the first four months of 2022, China imported 2.493 billion US dollars of feed, up 13.16% year on year. Imports amounted to 4.06 million tons, up 11.13% year on year [1]. As a large animal husbandry region in northern China, Inner Mongolia has set the goal as ‘comprehensively promoting rural revitalization and speeding up the modernization of agriculture, animal husbandry and rural grazing areas’ in the 14th Five-Year Plan [2]. More than 70% of the land in the study area belongs to typical steppe and desert steppe, and it has always maintained a steppe sandy landscape with mobile, semi-mobile, semi- fixed dunes and large and small grasslands co-existing [3]. This study has significance influence on the comprehensive evaluation of agricultural resources in Uxin Banner, formulating strategies for sustainable use of agriculture and animal husbandry, rational utilization and protection of local agricultural resources, planning and utilization of grassland animal husbandry and the maintenance of ecological balance. Previous studies concentrated on the water resources and integrated desert management in the Yellow River basin [4, 5, 6], resource carrying capacity and man-land relationship [7, 8]. As the research methods of land use zoning diversifying, there is a trend of diversification and cross-study in land use planning [9, 10, 11].
Researchers started to use the GIS platform, adopt different methods [12, 13] for zoning according to the measurement data and weighted criteria, and use IDRISI GIS software to apply the multi-factor model, to study the applicability of commercial agriculture, small-scale agriculture, urban development and nature reserves [14, 15, 16].
Based on the natural resources and the current situation of agriculture and animal husbandry in the local area, the study firstly focuses on the determining the suitable distribution zoning of forage grass, oats, corn and alfalfa and optimizing the layout. Secondly, through the study of forage variety evaluation and regional matching, this paper recommends suitable varieties of artificial forage for Mu Us area. The third purpose is studying industrial structure planning and layout optimization of pastoral areas. The results provided the basis for determining the most suitable land use and rational layout of planting structure.
Study Area
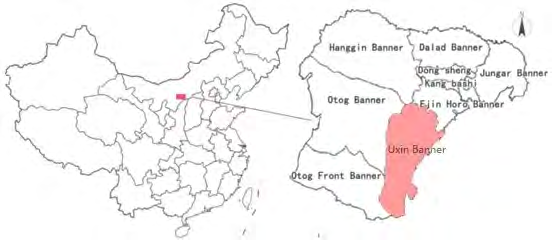
Uxin Banner is located at the junction of Inner Mongolia Autonomous Region and Shaanxi Province, southeast of Ordos, in the belly of Mu Us Sandy Land, between 108 ° 17 ′ 36 ″~109 ° 40 ′ 22 ″ E and 37 ° 38 ′ 54 ″~39 ° 23 ′ 50 ″ N. Its whole area is 11645 km2, and it is 104 km wide from east to west and 194 km long from south to north.
Uxin Banner is a typical grassland region while the wind-sand land-forms and semi-fixed dunes are widely distributed. Its vegetation is mainly arid grassland (65.32%) and meadow grassland (34.5%), and the land degradation is serious.
Methods
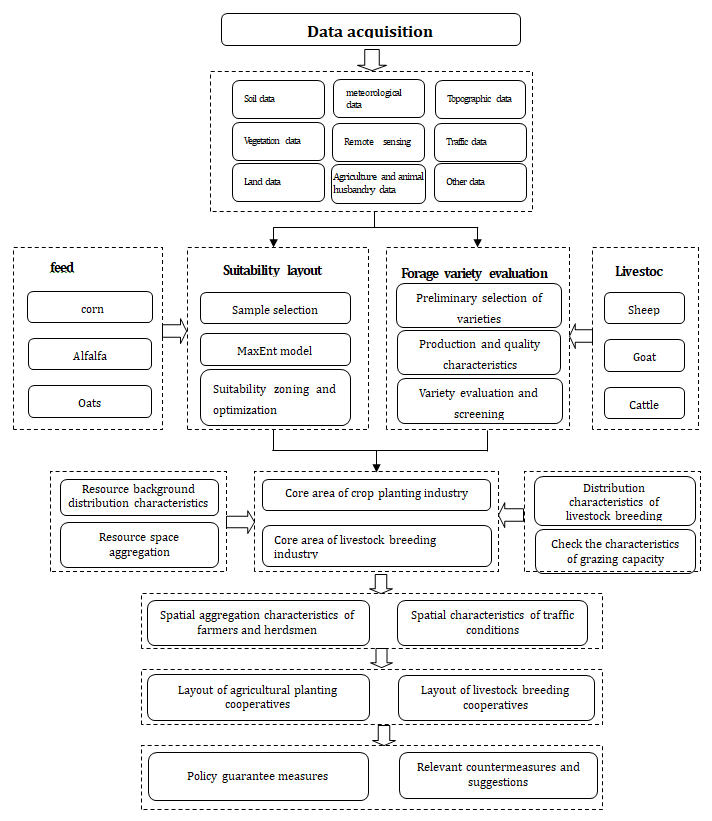
Flowchart of this study is shown in Figure 2.
As illustrated in Figure 2, the maximum value method was used to determine the importance of ecological service functions and the variable weight hierarchy analysis- comprehensive index method was used to study the agricultural land and the construction land suitability. Special types of land utilization within the dotted frame have been reserved. The annual climate index which can reflect regional climate characteristics and the key period climate index that affects the growth and yield formation of forage stock were selected (Table 1).
| Number | potential indicator | Explanation |
|---|---|---|
| 1 | Annual average precipitation | The total precipitation in the year reflects the overall water supply conditions in the year. |
| 2 | Annual average temperature | The average value of monthly average temperature in the year, reflecting the overall heat conditions in the year. |
| 3 | Annual average maximum temperature | The average value of monthly maximum temperature in the year, reflecting the overall heat conditions in the year. |
| 4 | Annual average minimum temperature | The average value of monthly average minimum temperature in the year, reflecting the overall heat conditions in the year. |
| 5 | Annual average daytime temperature | The average value of monthly average daytime temperature in the year, reflecting the overall heat conditions in the year. |
| 6 | Annual average night temperature | The average value of monthly average night temperature in the year, reflecting the overall heat conditions in the year. |
| 7 | Precipitation from June to August | The total June-August precipitation reflects the water supply in the peak growth period. |
| 8 | June-August average temperature | The average value of the June-August average temperature, reflecting the heat supply during the peak growth period. |
| 9 | Average maximum temperature from June to August | The average value of the June-August average maximum temperature, reflectingthe heat supply during the peak growth period. |
| 10 | Drought index | Regional dryness and humidity index within the year. |
| 11 | Climate potential productivity index | Temperature and rainfall conditions, reflecting comprehensive factors such as solar radiation, temperature and moisture. |
| 12 | Temperature and Vegetation Drought Index in Growing Period | The average value of monthly temperature and vegetation drought index during the growth period reflects the regional dryness and humidity index during the growth period of forage grass. |
| 13 | Altitude | The elevation of the surface, refecting the landform conditions. |
| 14 | Slope | The slope of the surface reflects the landform conditions. |
| 15 | Topographic relief | A macro index describing the topographic characteristics of a region. |
Table 1: Potential indicators for suitability zoning of forage.
The data involved in the project are based on multi- source meteorological, topographic, soil and vegetation data sets. Land surface temperature, reference evaporation respectively by the national aeronautics and space administration (NASA) released MOD11A2 and MOD16A2’s 8 days synthetic products (https://ladsweb.modaps.eosdis. nasa.gov), with a resolution of 1000m. The precipitation is estimated by grid based on the combination of radar and radiometer, including monthly TRMM and GPM global satellite precipitation products, with a resolution of 0.25 º × 0.25º. Wind data were derived from the Copernicus Climate Change Service (C3S) operating energy data set provided by the European Centre for Medium Range Weather Forecasts (ECWMF). The wind speed is a two-dimensional horizontal air speed with a height of 10 meters, and the resolution is 0.25°×0.25° in m/s. Topographic data includes elevation and slope. ASTER GDEM data was used for elevation with a resolution of 30m. ASTER data was obtained from the United States geological survey earth explorer website (https:// earthexplorer.usgs.gov/). Slope data was extracted directly by using elevation data in the Surface module of ArcGIS. Soil data was the National cryosphere desert data center’s (http: //www.ncdc.ac.cn/) 1∶1 million soil database containing soil mechanical composition, organic carbon content, calcium carbonate content, soil maximum root depth, plant available water fraction, etc. Soil moisture data is produced by NDVI and LST data and TVDI data model. GlobeLand30 data in 2000, 2010 and 2020 are used for land use and cover data, which are derived from the national geographic information catalog service(https://www.webmap.cn/main. do?method=index), while the spatial resolution is 30m × 30m. Land use and cover types data is survey data of Uxin Banner.
All spatial data are converted into Gauss Kruger projection through projection, and the coordinate system is unified to CGCS2000, which is divided into 3°zones. For precipitation, wind speed and other data, Kriging interpolation method is adopted, and the sampling resolution is 1000m [17, 18].
Drought Index
Agricultural production in Uxin Banner has been restricted by drought and water shortage for a long time. Real time and effective monitoring of drought occurrence and development can estimate the occurrence and intensity of regional drought and serve for regional agricultural production layout [19]. Drought index (DI) is an indicator reflecting the degree of climate drought, which is usually defined as the ratio of annual evaporation capacity and annual precipitation. The formula is as follows [19, 20] DI = E0 / P Where, DI is drought index; E0 is the annual evaporation, unit: mm; P is the annual precipitation, in mm. When DI<1.0, it averages that the evaporation capacity of the region is less than the precipitation, and the region has a humid climate. When DI>1.0, that is, the evaporation capacity exceeds the precipitation, indicating that the region is dry. The greater the DI is, the more evaporation capacity exceeds the precipitation, the more serious the dryness is.
Thornthwaite Memorial Model
Climate is the key to determine the yield of silage. Climate potential productivity index is an ecological climate index reflecting energy and material base. It refers to the potential productivity of crops when other environmental factors (carbon dioxide, nutrients, etc.) and crop population are in the most appropriate state under specific conditions of light, temperature and water resources, which can indicate the characteristics of changes in climate production potential of pasture [20]. Thornthwaite Memorial model considers the impact of actual evapotranspiration of plants on plant yield, and its calculated climate production potential of cultivated land is more consistent with the actual production situation than that of Miami model. In addition, the model requires few parameters and is highly operable. A large number of studies show that the calculation results of the model are relatively accurate, and it is applicable to the study of climate production potential in a wide range [21, 22, 23]. The formula is as follows: E0=300+25_t_+0.05_t_3 ET_=1.05P/ _TSP(t)= 3000[1 – e _-_0.0009695(ET-20)] Where, TSP (t) is the annual climate production potential, unit: kg/hm2 · a; T is the annual average temperature, unit: ℃; P is the annual precipitation, unit: mm.
Temperature Vegetation Drought Index
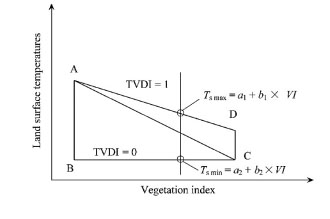
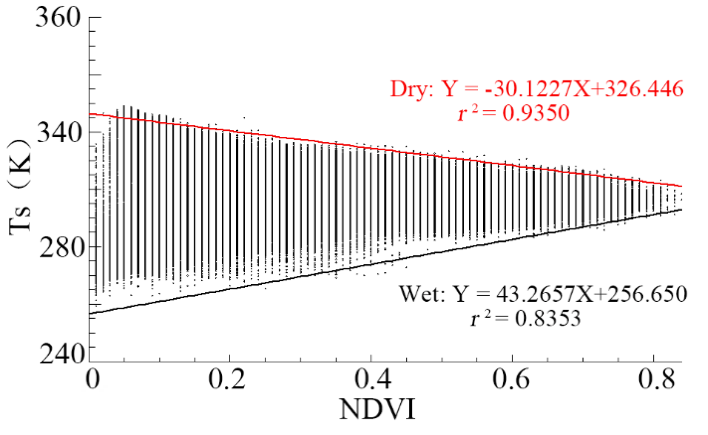
The soil humidity (SH) is a physical quantity of soil humidity and an important indicator of agricultural drought, which determines the moisture supply of crops. Temperature Vegetation Dryness Index (TVDI) is a method used to invert surface soil moisture in vegetated areas based on optical and thermal infrared remote sensing channel data. The formula is as follows:
TVDI = (LST–LSTmin) / (LST–LSTmin) LSTmin = a+b × NDVI LSTmax = c+d × NDVI Where, a, b, c and d are the coefficients of the dry and wet edge linear fitting equation respectively. The more TVDI value tends to 1, the more serious soil drought condition is. On the contrary, the more TVDI value tends to 0, the higher soil moisture will be.
Topographic Relief
Topographic relief refers to the difference between the
highest and the lowest elevation in a specific area. It is a
macroscopic index to describe the topographic characteristics
of an area. It can be seen from the definition of topographic
relief that calculate the difference value between the
maximum and minimum values of altitude within a certain
range can get the value of topographic relief. Topographic
relief is derived from the cutting depth of terrain proposed
by the Institute of Geography of the former Soviet Academy of
Sciences. Topographic relief is an important index to classify
landform types. Surface fluctuation has direct influence
on agriculture while China is a huge agricultural country.
Hence, studying the influence of surface fluctuation on agro-
ecological environment is of great significance for promoting
sustainable development of agricultural economy.
$$ \begin{array}{l} \mathrm {LX} = \left(\mathrm {DB} _ {j} ^ {- 1}\right) / \left(\mathrm {DB} _ {\max } ^ {- 1}\right) \times 100 \% \\ X \text {is the standard value of surface} \\ \end{array} $$
Where, LX is the standard value of surface fluctuation
(unit: %); DBj is the ratio of the interior surface area to the
projected area of the JTH region, and the ratio of the surface
area to the projected area is 1 under ideal condition. DBmax
is the maximum ratio of the interior surface area to the
projected area.
Maximum information entropy niche model
In recent years, domestic scholars and related institutions have used GIS technology and MaxEnt model [15] to analyze the suitability zoning of many plants, animals and insects, mainly focusing on plant species such as corn, oats, alfalfa, rice, Chinese fir, and biological species such as Chinese red panda, elk, and quagga. Those tests showed that MaxEnt model in real environment, dominant factor screening and environmental factors impact on the species and habitat of quantitative description of ways show superior performance, and its predicted results are better than the similar forecast model, especially in species distribution under the condition of incomplete data. Using MaxEnt model to carry out suitability regionalization of forage stock needs two sets of data [14, 16, 17, 22]. One is the geographical distribution data of target species that is the geographical distribution data of agrometeorological observation stations in the growing area of forage grass. The other is the environment variable data.
Annual Climate Potential Indicator Production
According to Table 1, potential annual climate indicators mainly include annual average precipitation, annual average temperature, annual average maximum temperature and annual average minimum temperature.
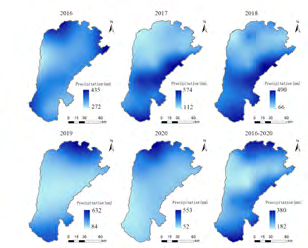
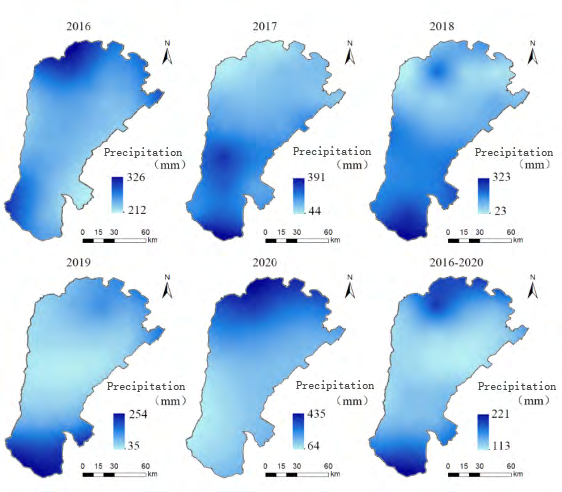
Annual average precipitation
According to the precipitation data monitored by remote sensing, the annual average precipitation in China during 2016-2020 is 255.5mm, and the overall standard deviation σ is 50.45, which is lower than Uxin Banner’s, which is 351.4mm (108°50’e, 38°36 ‘, altitude 1300m) [20, 22]. Since 2016, China’s annual precipitation has been 178.1mm, 277.7mm, 264.1mm, 271.9mm and 335.5mm, which shows a significant increasing trend (r2=0.75), and the growth rate was 24.72mm/year. It is basically consistent with the trend of fluctuation of annual precipitation in Uxin Banner in recent 60 years. Precipitation has a spatial difference that is high in the north and southeast and low in the center and west.
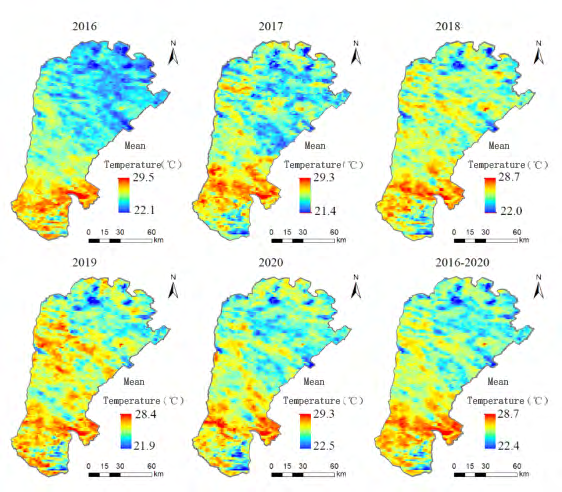
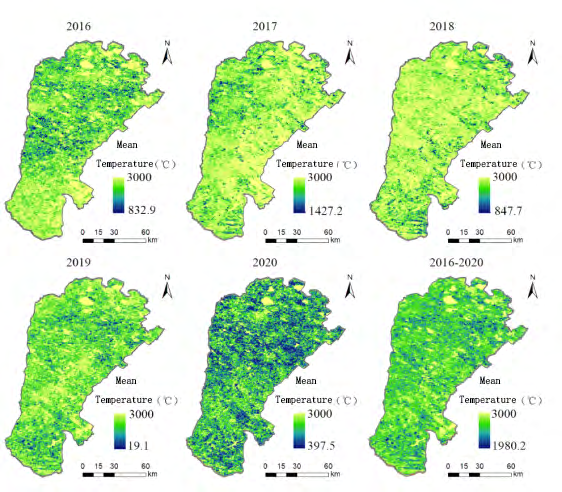
Annual average temperature
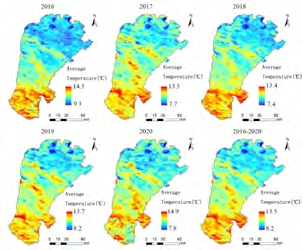
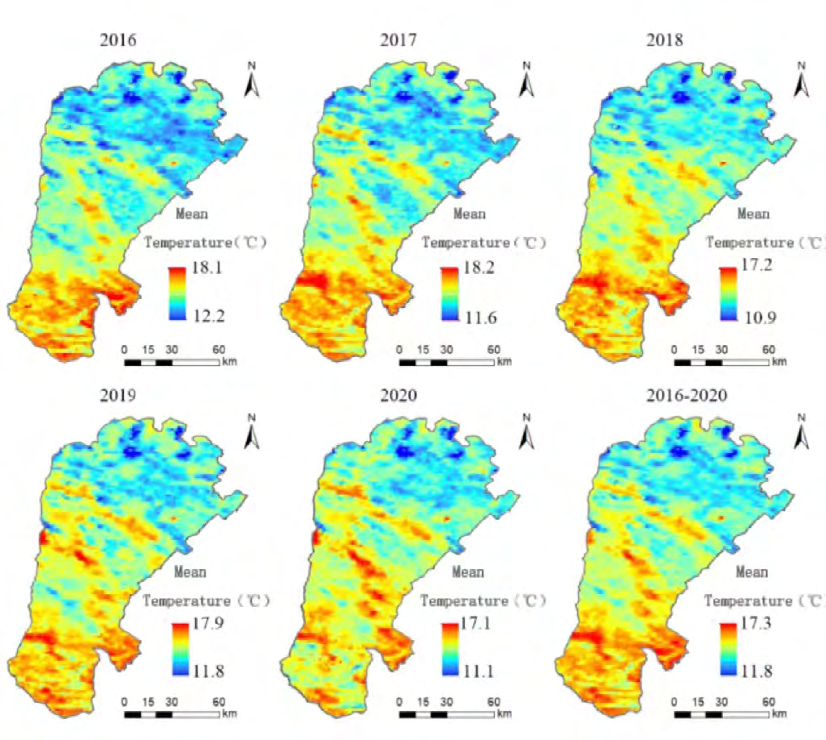
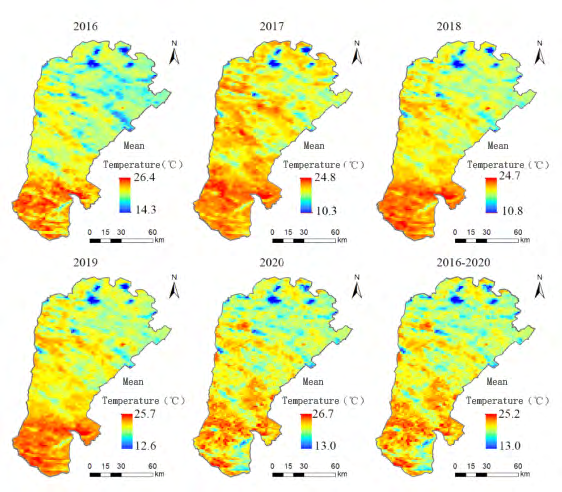
According to the remote sensing monitoring data, the annual average temperature of Uxin Banner from 2016 to
2020 was 11.31℃ [20]. The overall standard deviation σ was 0.27. According to the relevant data, the average annual temperature in Mu Us Sandy Land has shown a significant warming trend at the rate of 0.543℃/10a in the past 30 years [20, 21, 22, 23, 24]. However, since 2016, the annual average temperature was 11.69℃, 11.26℃, 10.86℃, 11.42℃ and 11.31℃ respectively, fluctuating around 11.3℃. During 2016- 2020, the annual average temperature showed a decreasing trend from south to north.
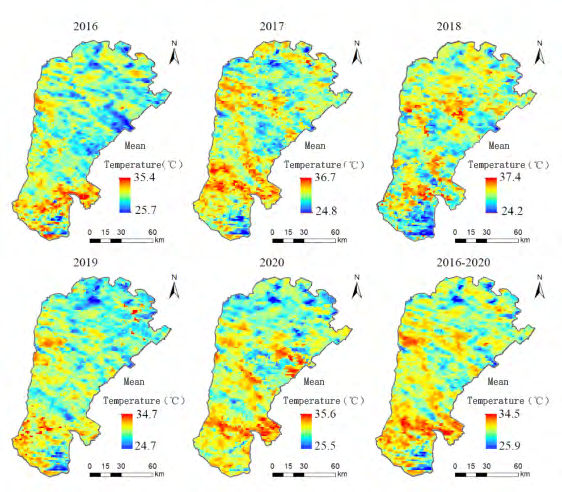
Average maximum temperature
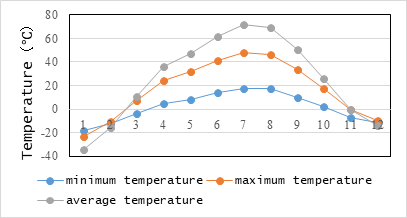
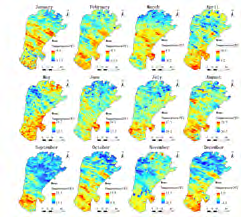
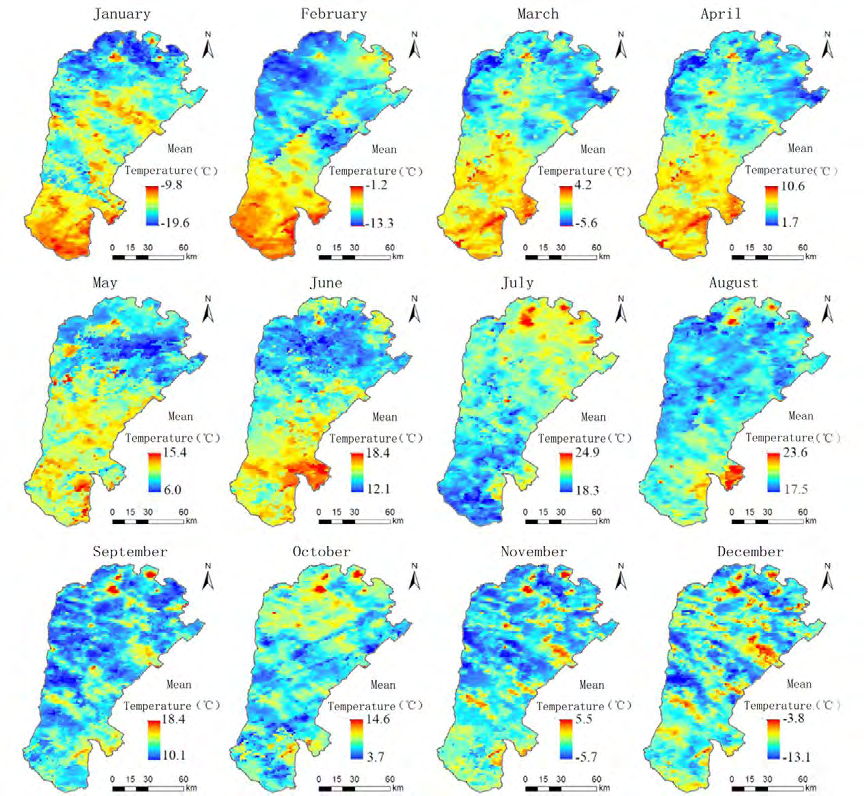
The annual mean maximum temperature is calculated by adding up the maximum temperature for each month of the year and dividing by 12. According to the calculation results of the past five years, it can be concluded that January was the month with the lowest highest temperature, and July was the month with the highest temperature (take 2016 as an example). The monthly maximum temperature tends to be the consistent throughout the year, and the overall pattern was high in the south and low in the north, showing local heterogeneity.
The mean value of the annual maximum temperature in Uxin Banner during 2016-2020 was 15.14℃, and the overall standard deviation σ was 0.28. Since 2016, the annual average maximum temperature was 15.23℃, 15.42℃, 14.86℃, 15.44℃ and 14.76℃ respectively, showing an inter- annual fluctuation state [22, 25]. In terms of spatial pattern, the temperature in the north was lower and the temperature in the south was higher, and there was spatial heterogeneity in local regions.
Annual average minimum temperature
The annual average minimum temperature is calculated by adding up the minimum temperature for each month of the year and dividing by 12. According to the calculation results of the past five years, January has the lowest temperature of the year, and July has the highest temperature [26, 27, 28]. From January to June, the monthly minimum temperature tended to be consistent, showing a pattern of high in the south and low in the north. The minimum temperature in July-December was more uniform than that in the first half of the year, and the minimum temperature in some areas was higher. The average minimum temperature in Uxin Banner this year is 8.06℃, and the overall standard deviation σ is 0.38. Since 2016, the average minimum temperature was 8.15℃, 8.0℃, 7.51℃, 8.32℃ and 7.76℃ respectively.
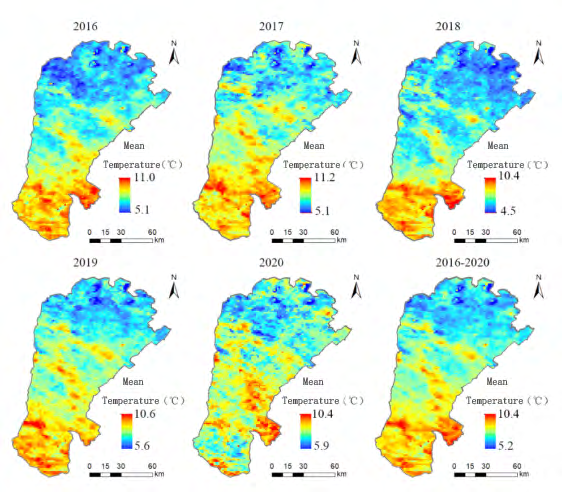
Annual average daytime temperature
During 2016-2020, the average daytime temperature in Uxin Banner was 21.89℃, and the overall standard deviation σ is 0.44. Since 2016, the annual average daytime temperature was 21.95℃, 21.60℃, 21.23℃, 22.24℃ and 22.45℃, respectively. The spatial pattern showed a gradually decreasing trend from south to north [29]. The highest temperature was in the south of Sulide Sumu, up to 24-26℃, and the lowest annual average daytime temperature was the water area, in the northern Wu shenzhao town and Ketu town.
Annual average night temperature
During 2016-2020, Uxin Banner’s average night temperature was 0.73℃, and the overall standard deviation σ was 0.42. Since 2016, the annual average night temperature was 1.43℃, 0.92℃, 0.53℃, 0.59℃ and 0.18℃, respectively.
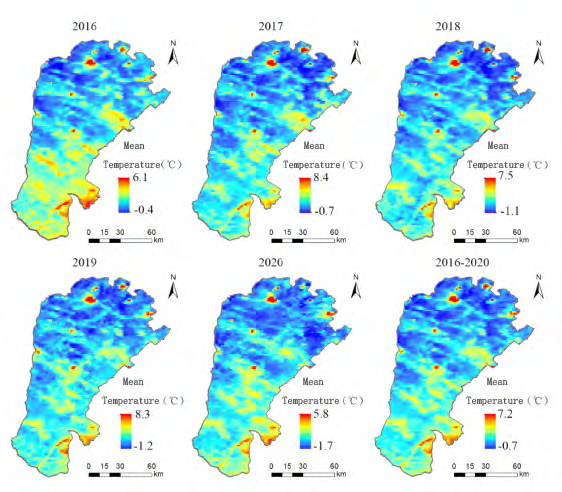
Figure12: Annual average temperature at night in Uxin Banner during 2016-2020.
The overall temperature showed a decreasing trend from southeast to north. The highest annual average night temperature was mainly distributed in the eastern part of Wu dinghe town, while Galutu town, Wu shenzhao town and Ketu town had lower average night temperature.
Production of Potential Climatic Indicators during Growth Period
After analyzing Uxin Banner’s average temperature, precipitation and sunshine duration data of each month in the recent 30 years, using linear trend analysis method to study the seasonal distribution characteristics of various meteorological elements, and referring to the relevant research results [26, 27, 28, 29, 30]. This paper draws a conclusion that Uxin Banner’s season is divided into: spring from March to May, summer from June to August, autumn from September to November, winter from December to next February. According to Table -1, the main climate potential indicators during the growth period include June-August precipitation, June-August average temperature, and June-August average maximum temperature.
Precipitation from June to August
In the past 30 years, the average precipitation in each season was 59.5mm, 211.8mm, 76.9mm and 7.0mm. It can be seen that precipitation is mainly concentrated in summer, from June to August, and was accounted for 59.6% of the total annual precipitation. During 2016-2020, the average annual June-August precipitation in Uxin Banner was 141.3mm, the overall standard deviation σ was 53.34, and the total precipitation was lower than the average in recent 30 years.
The average annual June-August precipitation since 2016 were 248.3mm, 156.4mm, 126.2mm, 91.6mm, 184.7mm.
In terms of spatial pattern, and there were big differences between the years. However, from the perspective of multi- year mean, the precipitation in June to August in Uxin Banner presented the distribution characteristics of high precipitation in the north and south, and low precipitation in the middle.
June-August average temperature
From 2016 to 2020, the June-August average temperature was 25.75℃, and the overall standard deviation σ is 0.35. Since 2016, the June-August average temperature was 25.32℃, 25.73℃, 25.92℃, 25.08℃ and 25.98℃. It was significantly different from the north to the south, showing an obvious high in the south and low in the north. From June to August, the average temperature in Sulid sumu and Wu dinghe towns which are located in the south of Uxin Banner was higher, while the value in Tuke town and Uxintai town which are located in the north of Uxin Banner was lower.
Average maximum temperature from June to August
According to the statistical results of remote sensing monitoring data, the average monthly maximum surface temperature from June to August in Uxin Banner was 30.63℃ during 2016-2020. In the past five years, the average monthly maximum surface temperature was 30.04℃, 31.71℃, 30.06℃, 29.46℃ and 31.90℃ respectively, which basically fluctuated around 30℃, and the overall standard deviation σ was 0.97. In terms of spatial pattern, the monthly mean maximum temperature was higher in the central and southern part of Sulidsumu, the eastern part of Wudinghe town and Garutu town during 2016 to 2020. The highest temperature was lower in the south of Wudinghe town, the east of Ulan Tolgoi town and the central part of Wuzhenzhao town.
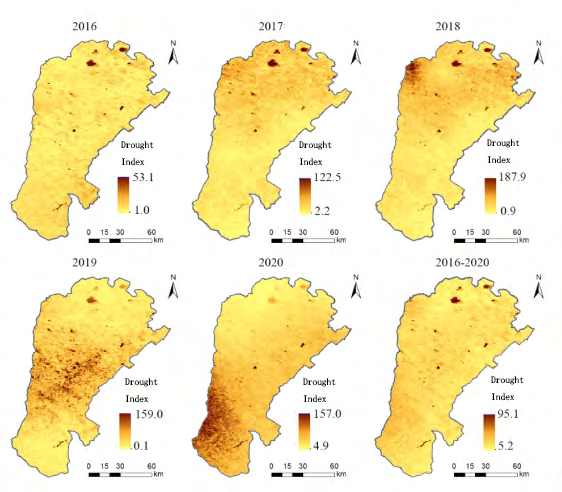
Inversion of Drought Index
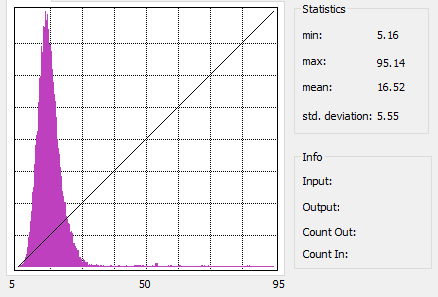
Drought index is the standard of drought degree and the numerical expression of drought. The mean value of drought index during 2016-2020 was 16.5, and the average drought index during 2016 to 2020 was 8.4, 16.5, 17.7, 11.6 and 30.5, respectively, with the overall standard deviation σ equal to 7.57. The drought index in 2020 was higher in the recent year, mainly because the annual precipitation was only 333.9mm (observed data from meteorological stations in Henan) and 345.6mm (observed data from meteorological stations in Uxinzhao), both of which were lower than usual. In terms of spatial pattern, the average drought index tends to be consistent with the overall standard deviation σ equal to 5.55 except for the lake distribution area.
Inversion of Climate Production Potential Index
As an important index to evaluate crop production capacity, the climate potential of cultivated land refers to the maximum crop capacity that cultivated land can reach when other conditions except climate condition reach the best state, which reflects the production capacity of cultivated land to a certain.
Between 2016 and 2020, the average annual climate production potential index of Uxin Banner was 2740.9 kg/ hm2, and the overall standard deviation σ was 208.2. From 2016 to 2020, the annual climate production potential index was 2934.2kg /hm2, 2680.1kg /hm2, 2881.9kg /hm2, 2847.7kg /hm2 and 2360.8kg /hm2. The climate production potential index in 2020 was relatively low, mostly because the precipitation and temperature were slightly lower in that year. In terms of spatial pattern, the climate productivity potential index was evenly distributed, with a spatial heterogeneity in local regions.
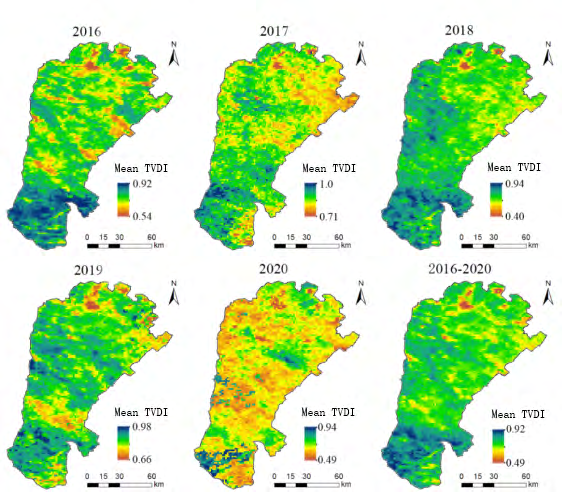
Inversion of temperature and vegetation drought index during growth period
During 2016-2020, the average mean surface TVDI of Uxin Banner from June to August was 0.82, and the overall standard deviation σ was 0.06. In the past five years, the average monthly maximum surface temperature was 0.78, 0.93, 0.75, 0.86 and 0.78 respectively, which basically fluctuated around 0.8, and the overall standard deviation σ was 0.07. In 2020, precipitation, temperature and TVDI were relatively low in the previous years. The spatial pattern showed a decreasing trend from southwest to northeast.
Topographic and geomorphic feature indicators
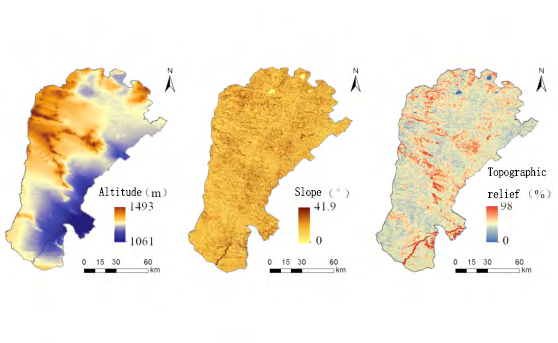
The average altitude of Uxin Banner is 1307 m, and the overall standard deviation σ is 55.6. Garutu town has the highest average altitude as 1342m; the second one is Wuzhenzhao town, which is 1334m while Wudinghe town has the lowest average elevation of 1223m. The average slope of Uxin Banner is 3.48°. According to the classification of slope land standard given by Geomorphic Survey and Geomorphic Cartography Commission of International Geographical Union that 2-5 degrees are gentle slopes, it conclude that the whole Uxin Banner is mainly gentle slopes.
Terrain is the main factor that affects the landscape pattern of cultivated land. Terrain undulation seriously restricts human’s practice on cultivated land. The tablelands in arid and semi-arid areas are open and the terrain is gentle, which is suitable for the development of agricultural grass planting. With a search radius of 250m, the average surface undulation in Uxin Banner is 17.40%. The surface undulation in the east of Wudinghe Town, the north of Sulide Sumu, the west of Galutu Town, the northwest of Uxinzhao Town and the middle of Ulan Tolgoi Town are higher than 20%, while the other areas are flat.
Selection of Key Natural Factors for Suitability Zoning
Initial index effect evaluation
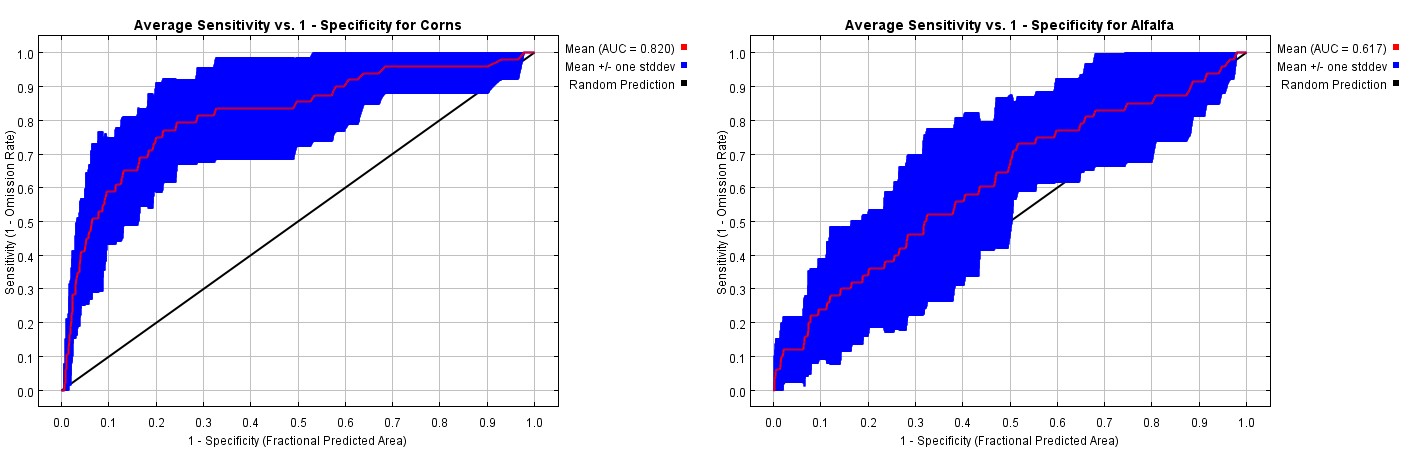
It can be seen from Figure 3-23 that the AUC value of the maximum entropy model for the growth environment of the fermented corn based on all potential ecological environment indicators is 0.820, and the standard deviation is 0.085, which shows that the accuracy of the model is excellent and can be used to select suitable areas for the fermented corn. However, the accuracy of the model in predicting alfalfa and oats is relatively low. The AUC is only 0.617 with a standard deviation equal to 0.135. Which can only be used for prediction?
Screening of key natural factors
The initial model was constructed on the basis of a combination of 15 initially selected environmental factors during the growth environment of fermented corn, alfalfa and oats and the relevant literature. During the initial model construction process, Jackknife test in MaxEnt software was selected to test the contribution level of environmental variables to the model prediction, so as to eliminate the environmental variables that contributed too little to the MaxEnt model prediction results. Next, Spearman correlation analysis was performed on the key limiting factors with large contributions to improve the accuracy of the model simulation partition. On this basis, the maximum entropy model of fermented corn, alfalfa and oats were reconstructed, and the accuracy of the model results was evaluated.
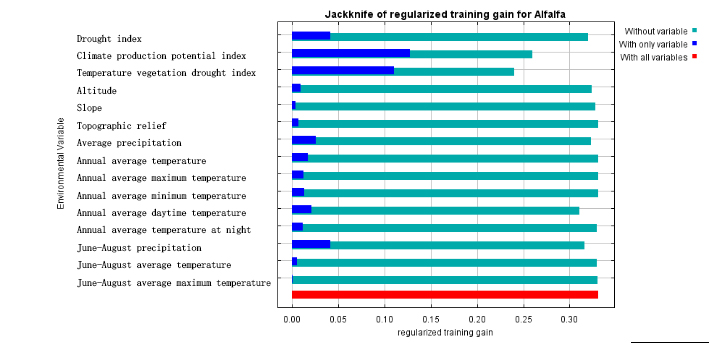
According to the calculation results of MaxEnt model, the ecological factors with contribution rates from the largest to the smallest are June-August average maximum temperature, climate production potential index, average precipitation, temperature vegetation drought index, annual average temperature at night, June-August average temperature, topographic relief, drought index, June-August precipitation, altitude, annual average maximum temperature. Its cumulative contribution rate is 98.5%, which was shown in Table 2. The ecological factors controlling the growth of alfalfa and oats were, in descending order, climate production potential index, temperature vegetation drought index, June- August precipitation, annual average temperature at night, drought index, average precipitation and topographic relief, with a cumulative contribution rate of 96.5%. For details, see Table 3.
| Number | Environmental variables | Contribution rate(%) | Importance |
|---|---|---|---|
| 1 | June-August average maximum temperature | 34.1 | 3.3 |
| 2 | climate production potential index | 17.8 | 6.3 |
| 3 | average precipitation | 17 | 1.9 |
| 4 | temperature vegetation drought index | 4.5 | 8.4 |
| 5 | annual average temperature at night | 4.1 | 0 |
| 6 | June-August average temperature | 4.1 | 45.7 |
| 7 | topographic relief | 4.1 | 1.3 |
| 8 | drought index | 3.8 | 6.4 |
| 9 | June-August precipitation | 3.8 | 3.3 |
| 10 | altitude | 3.2 | 0.4 |
| 11 | annual average maximum temperature | 2 | 21.4 |
| 12 | annual average daytime temperature | 0.5 | 0.4 |
| 13 | slope | 0.5 | 0.2 |
| 14 | annual average minimum temperature | 0.4 | 0 |
| 15 | annual average temperature | 0.1 | 1 |
| 1 | climate production potential index | 40.3 | 29.4 |
| 2 | temperature vegetation drought index | 28.8 | 33.6 |
| 3 | June-August precipitation | 8.9 | 7 |
| 4 | annual average temperature at night | 6.3 | 11.4 |
| 5 | drought index | 5 | 2.2 |
| 6 | average precipitation | 5 | 5.4 |
| 7 | topographic relief | 2.2 | 4.8 |
| 8 | slope | 1.2 | 1.7 |
| 9 | annual average daytime temperature | 1 | 2.3 |
| 10 | June-August average maximum temperature | 0.8 | 1.8 |
| 11 | June-August average temperature | 0.4 | 0.5 |
| 12 | annual average maximum temperature | 0.1 | 0 |
| 13 | annual average temperature | 0 | 0 |
| 14 | altitude | 0 | 0 |
| 15 | annual average minimum temperature | 0 | 0 |
Table 2: Contribution rate and importance of environmental variables of fermented corn.
Specification training of environmental factor
Figure 23 shows the results of Jackknife tests with different importance of environmental factors during the growth period of corn. The environmental variable with the highest gain when used in isolation is the June-August maximum temperature, so the June-August maximum temperature provides the most useful information during corn growth. In addition, the environmental variable that reduces the gain the most is the June-August mean temperature, so the June-August mean temperature has the most information than any other variable. The values shown in the figure are the mean of 10 replication runs [28, 29, 30, 31].
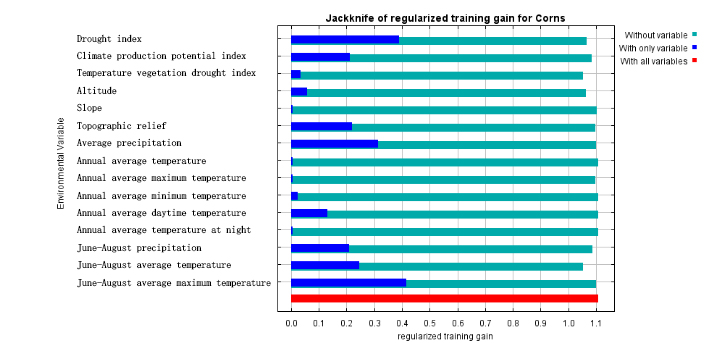
Figure 24 shows the results of Jackknife test of different importance of alfalfa and oats growth environment factors. The environmental variable with the highest gain when isolation is used is the climate production potential index, so it seems to have the most useful information. The environmental variable that minimizes the gain is the temperature vegetation drought index, and it seems to have the most information. The values shown in the figure are the mean value of 10 replication runs [31, 32, 33, 34].
Evaluation of appropriate area
Evaluation unit is the most basic area of suitability evaluation, namely the smallest unit. The purpose of dividing evaluation units is to objectively reflect the ecological suitability of crops and their differences in a certain space, so as to provide a basis for the classification of suitability levels. Different evaluation units should have their own unique attributes, which are both different and comparable. As this area has fragile ecology and strong limitations for natural factors, it has less difference and map spots. If different layer stacking methods are used to generate evaluation units, the evaluation accuracy will reduce. In order to improve the evaluation accuracy, according to the resolution of various remote sensing images, the research area is divided into 30m×30m grid as the minimum evaluation unit [35, 36, 37, 38, 39].
This paper combining ENVI software, Maximum Likelihood method and the third national space planning ’s high score images to identify planting areas of fermented corn, alfalfa and oats in Uxin Banner. Considering that the growing environment of alfalfa and oats tend to be same, and the mixture or rotation of alfalfa and oats can avoid the large area smut caused by oats, and the rhizobia of alfalfa fixes nitrogen and provides nitrogen utilization for oats, improving the yield, quality and livestock utilization rate of the mixed sowing grassland [29, 40, 41, 42]. Alfalfa and oats will no longer be classified in detail for this identification. As can be seen from Figure 25, the grain of cultivated land with fermented corn and alfalfa is totally different. In the figure, the dark green is fermented corn and the green is alfalfa. Specific working steps are as follows:
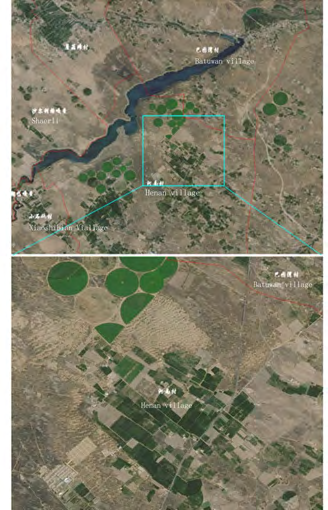
- Remote sensing images within the range of cultivated land were extracted by using the vector map spot of cultivated land in 2021 Uxin Banner basic remote sensing feature classification as mask.
- According to the texture differences of fermented corn and alfalfa in remote sensing images from July to August, interpretation samples were selected respectively, and maximum likelihood method was used for supervised classification interpretation.
- According to the interpreted planting plots of fermented corn and alfalfa, the sample points needed for suitability zoning evaluation were randomly selected.
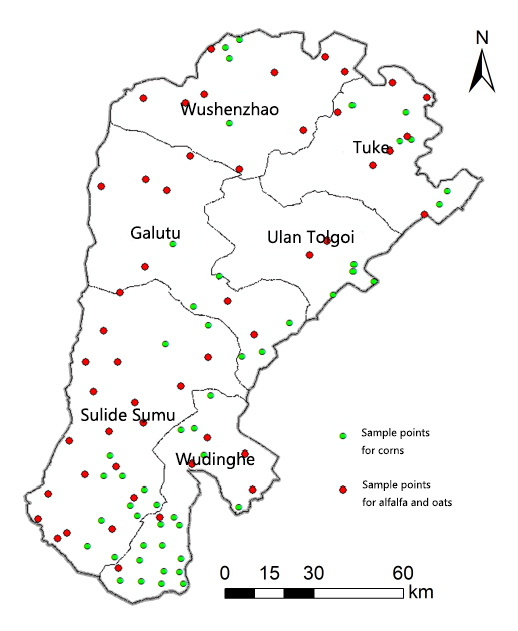
Selection of planting sample sites for fermented feed
Create Random Points tool in ArcGIS was used to randomly select 50 planting samples of fermented corn and 50 planting samples of alfalfa and oats within the range of fermented corn, alfalfa and highland barley Tutu spots inside the Uxin Banner. The locations of the planting samples were shown in Figure 26.
Fermented feed partition based on MaxEnt model
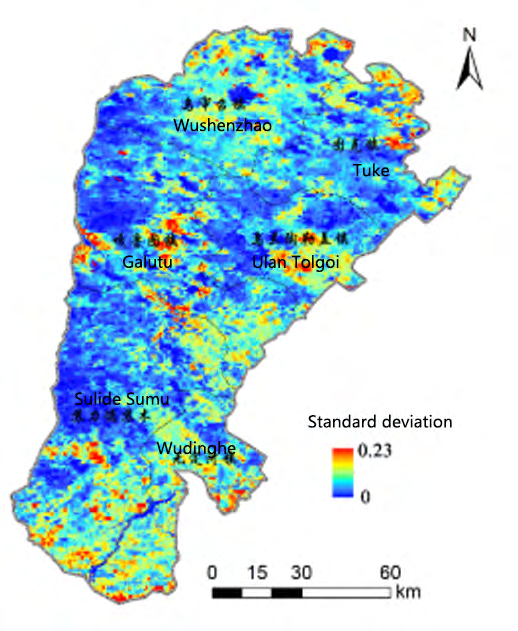
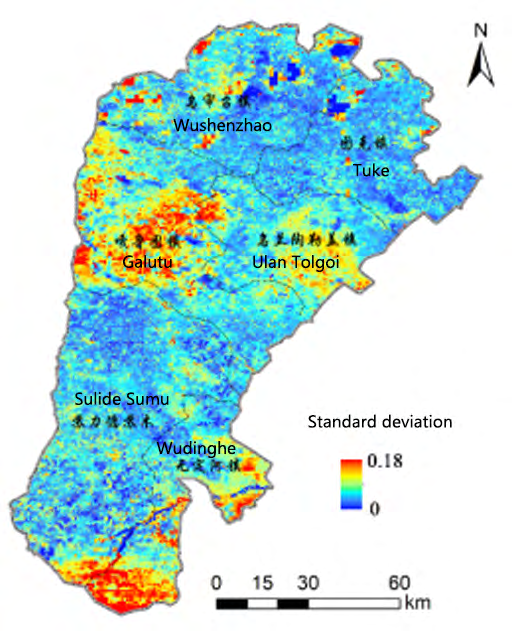
The ASCII file of alfalfa’s existence probability was calculated based on MaxEnt model, and was converted into raster map in ArcGIS. According to the model principle, when the existence probability of a species in a certain area was < 0.05, it was statistically called a small probability event.
Therefore, the area with probability value 0≤S < 0.05 was defined as unsuitable area. With the increase of probability value, the probability of alfalfa’s existence increases. Referring to the study results of Ma Yahong [21] on appropriate classification, the low suitable zone was defined as 0.05≤S < 0.30, the moderately suitable area as 0.30≤S < 0.50, and the highly suitable area as 0.50≤S < 1.00. The specific suitable area and standard deviation of fermented corn, alfalfa and highland barley are shown as follows:
Verifying Partition Results
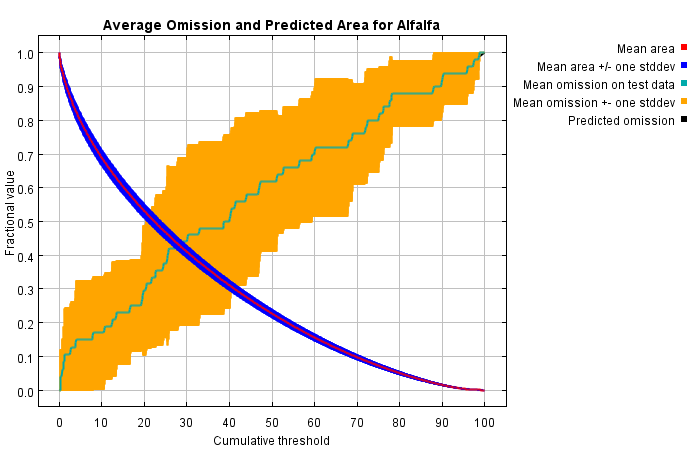
The figure below shows the rate of test omissions and the predicted area of the cumulative threshold function
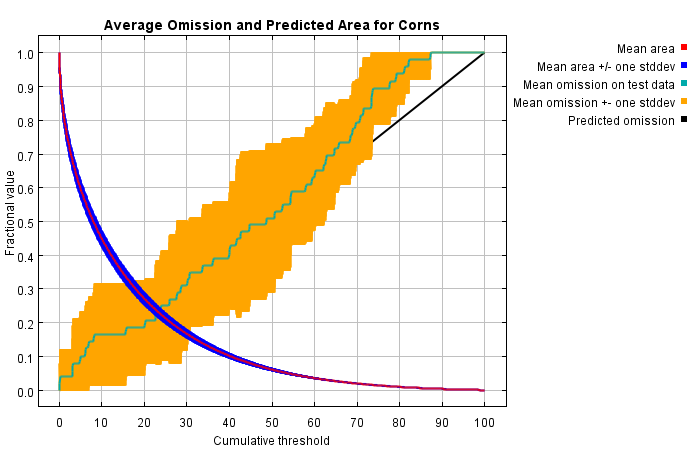
obtained by averaging over repeated runs. According to Figure 29, it can be seen that the cumulative threshold and omission rate are close to the predicted values, indicating that the prediction results are credible and reliable.
Optimization of Suitable Layout
Layout optimization ideas and factor selection
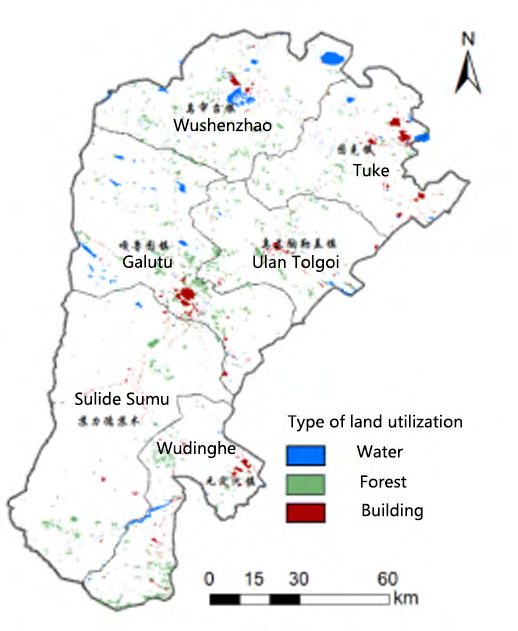
The development of herbage planting industry should not only meet the requirements of natural environment, but also abide by the current national or local laws and regulations. The transition of mechanism and geomorphic features from fixed, semi-fixed and mobile dunes to loess hills are found in Uxin Banner. According to the general plan and the ‘Regulations on Returning Farmland to Forest’, the cultivated land required by the development of planting industry should be ‘strictly limited to sloping farmland above 25 degrees, seriously desertified farmland and 15-25 degrees sloping farmland in important water sources’, and ‘cultivated land seriously desertified, salinized and rocky desertification should be included in the plan of returning farmland to forest’, the situations mentioned above are not suitable for planting industry. In addition, the areas where the land use status is water, forest, living and mining residential land are not appropriate for using as cultivated land. Therefore, the land that meets the above conditions should be excluded in the layout optimization as well.
Layout Optimization Method
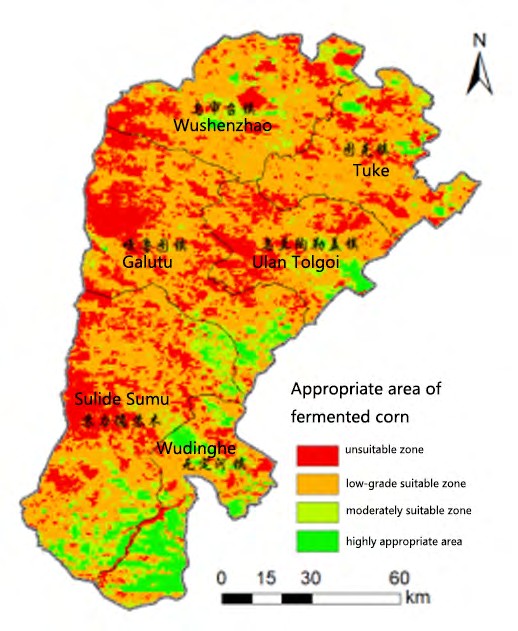
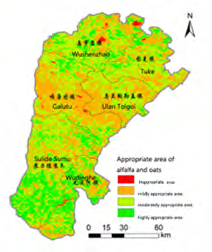
Suitability zoning optimization method of fermented corn The results of suitability zoning for fermented corn were taken as the base map in figure 27, adding water, forest living and mining area among sandy land types in Uxin Banner. The results were shown in figure 32.
Suitability differentiation and optimization of alfalfa and oat
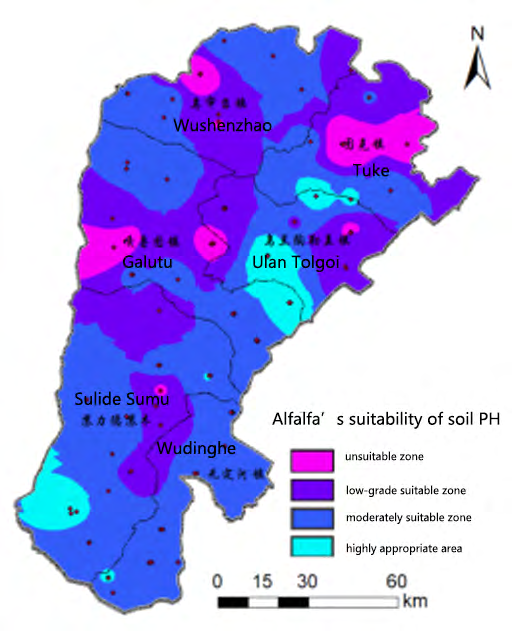
Alfalfa has wide adaptability and can be planted in PH 5 ~ 9 neutral to slightly alkaline soil. When PH<5, lime must be applied for normal growth. The optimal PH is 7 to 8. Combined with the present situation of soil PH value in Uxin Banner and the requirement of soil PH value for alfalfa growth, the area with PH > 9.5 is classified as unsuitable zone, the area with
PH < 9.5 is classified as low-grade suitable zone, 8≤PH < 9 is moderate suitable zone, and 7≤PH < 8 is highly suitable zone.
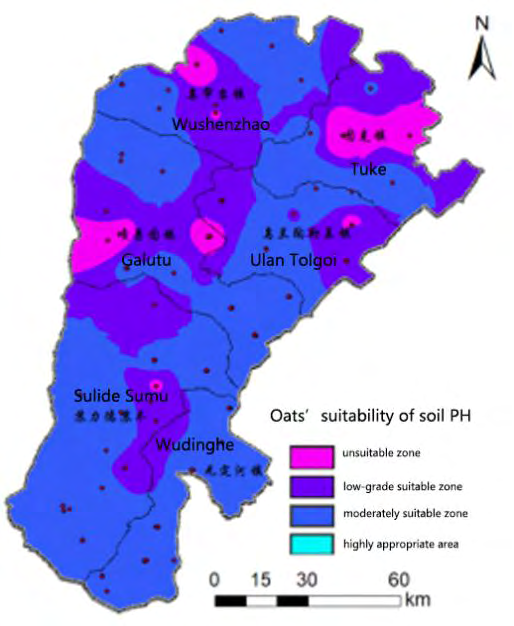
Oats’ growth is not sensitive to soil and PH value. It can grow well in the soil with high sulfate content and PH value of 5 ~ 8.5. According to the soil PH value of Uxin Banner, the PH > 9.5 is classified as unsuitable zone, 9≤PH < 9.5 is low-grade suitable zone, 8.5≤PH < 9 moderately suitable zone, and PH < 8.5 is highly suitable zone. According to the requirements of soil pH of the two crops, the suitable planting zones of alfalfa and oat could be obtained by further optimizing the suitability zoning. The data of topsoil organic matter content in the second national soil survey were divided into 6 grades according to the standard of greater than 40g/kg, 30g/ kg~40g/kg, 20g/kg~30g/kg, 10g/kg~20g/kg, 6g/kg~10/ kg and less than (or equal to) 6g/kg.
Area of suitability zoning
The layout of fermented corn was optimized by selecting slope and land use status. According to the adaptability of alfalfa and oat to soil PH, the planting zones of alfalfa and oat were distinguished, and the suitability layout was optimized. The results of statistical area were shown in Table 4. The height suitable area of alfalfa in Uxin Banner was higher than that of fermented corn and oat, with an area of 189,000 hectares, accounting for 16.2% of the total area of the banner, while the height suitable area of fermented corn only accounted for
5.34% of the total area of the banner. The moderately suitable area for alfalfa planting was 418,000 hectares, accounting for 35.83% of the total area, while the moderately suitable area for fermented corn and oats accounted for 8.10% and 33.81% of the total area, respectively. The low-grade suitable area of fermented corn was the most widely distributed, accounting for 5.28 billion hectares, 45.24% of the total area, while the low-grade suitable area of alfalfa and oat accounted for 25.28% and 28.32% of the total area, respectively.
| unit:ha、% | ||||||||
|---|---|---|---|---|---|---|---|---|
| Type | highly appropriate | moderately appropriate | mildly appropriate | Inappropriate | ||||
| area | proportion | area | proportion | area | proportion | area | proportion | |
| fermented corn | 62325.5 | 5.34 | 94579.7 | 8.1 | 528278.9 | 45.24 | 482425.9 | 41.32 |
| alfalfa | 189136.6 | 16.2 | 418324.9 | 35.83 | 295190.6 | 25.28 | 264958 | 22.69 |
| oats | 176606.2 | 15.13 | 394710.6 | 33.81 | 330617.5 | 28.32 | 265675.6 | 22.75 |
Table 3: Statistical table of suitable zoning for different forage grass.
Conclusion
In this paper, MaxEnt model, multi-source remote sensing, survey and monitoring data such as meteorological, soil and landform were used to identify suitable planting areas for alfalfa, oats and fermented corn in Uxin on the basis of comprehensive consideration of land use status. The main conclusions are as follows:
Firstly, through the analysis of multi-source remote sensing data of main climate indicators, it can be concluded that the annual precipitation of Uxin Banner presents a spatial pattern of higher in the north and southeast while lower in the central and western regions, and the increasing trend of annual precipitation is obvious. The annual average temperature fluctuates at 11.3℃, and decreases from south to north in the spatial pattern. The annual average maximum temperature was 15.14℃, showing inter-annual fluctuation. In terms of spatial pattern, the temperature in the north was lower and the temperature in the south was higher, and there was spatial heterogeneity in local regions. The annual average minimum temperature was 8.06℃, and the monthly minimum temperature pattern from January to June tended to be the same, showing a pattern of high in the south and low in the north. The minimum temperature in July-December was more uniform than that in the first half of the year, and the minimum temperature in some areas was higher. The average daytime temperature is 21.89℃, showing a decreasing trend from south to north. The average temperature at night was 0.73℃, showing a decreasing trend from southeast to north.
Secondly, the annual average precipitation in the key growth period (June-August) of crops in Uxin Banner is 141.3mm, showing the distribution characteristics of high precipitation at the north and south ends and low precipitation in the middle. The average temperature from June to August is 25.75℃, with a spatial pattern of high temperature in the south and low temperature in the north. The average drought index was 16.5, and the annual average drought index tended to be uniform except for the lake distribution area. The climate productivity potential index was 2740.9 kg/hm2, showing consistent distribution in the whole space and spatial heterogeneity in local areas. The average temperature vegetation drought index was 0.82, showing a decreasing trend from southwest to northeast.
Thirdly, the Jackknife of MaxEnt model was used to test 15 environmental variables, and Spearman correlation analysis was conducted for the key limiting factors with large contributions. It was found that the average maximum temperature, climate potential index and average precipitation played the key limiting role in the growth of fermented corn from June to August, accounting for 68.9% of the contribution rate of 15 factors. Climate productivity potential index, temperature vegetation drought index and precipitation from June to August play an important role in limiting the growth of alfalfa and barley, accounting for 78.0% of the contribution rate of 15 factors.
Finally, in the basis of MaxEnt model suitability zoning, further select slope (< 25°), land use status (construction land, desertification land, etc.) and soil pH, etc., to optimize the layout of fermented corn, alfalfa and oats. It is concluded that the height suitable area of alfalfa in Uxin Banner is 189,000 hectares, accounting for 16.2% of the whole banner area. The height suitable area of fermented corn covers 62,000 hectares, accounting for only 5.34% of the total area of the whole banner, while the height suitable area of oats covers 176,000 hectares, accounting for 15.13% of the total area of the whole banner.
Data availability
The relevant datasets in this study are available from the corresponding author on reasonable request, and from statistical data released by the government.
Acknowledgements
The Project was supported by the National Natural Science Fundation of China (No: 32161143029).
Contributions
Ning Yan, Lu Lai and Shuang Zhang wrote the main manuscript text and collected data, Ning Yan and Xinyi Bian prepared Figures 1–31 and tables; Shifeng Li proposed amendments to this article.
References
-
(2022) China customs statistics.
-
(2021) The 14th five-year plan for Forest and grass in Inner Mongolia.
-
(2018)Census data of land and resources in Inner Mongolia.
-
Wang Yong, Zhao Wei, Wang S (2019) The Yellow River is rebalanced by human regulation. Nature 9: 9707.
-
Ran L, Lu X, Xin Z, Yang X (2013) Cumulative sediment capture in large basin: A case study of the Yellow River Basin. The global planet. Changes 100: 308-319.
-
Qiao MX (2016) Construction and practice of integrated water resources management and management system in the Yellow River. Yellow River 38: 83-87.
-
Tricht KV (2016) Clouds enhance meltwater runoff from the Greenland ice sheet. National Communications 7: 10266.
-
Woodhouse CA, Pederson GT, Morino K, Mcafee SA, Mccabe GJ (2016) Temperatures are having an increasing impact on streams in the upper Colorado River. Geophysics. Rhett 43: 2174-2181.
-
Gosling SN (2017) Comparison of river runoff changes among multiple global and catchment hydrological models under global warming scenarios of 1°C, 2°C and 3°C. Changes 141: 577-595.
-
Bin L, Xu K, Xu X, Lian J, Ma C (2018) To develop landscape indicators to assess the impact of landscape pattern on surface runoff in Haihe River Basin. J Water power 566: 546-557.
-
Saaty HLA (1977) Scaling Method for Priorities in Hierarchical Structures. Journal of Mathematical Psychology 15(3): 234-281.
-
Van der Merwe JH (1997) GIS-aided Land Evaluation and Decision-Making for Regulating Urban Expansion: A South African Case Study. Geo Journal 43(2): 135-151.
-
Phillips SJ, Anderson RP, Schapire RE (2006) Maximum entropy modeling of species geographic distributions. Ecological Modelling 190(4): 231-259.
-
Tong Lu, Qian Guo, Yongxia Ding, Li Liu, Shouzhang Peng (2021) Prediction of potential suitable areas of rice in China under future climate change scenario based on MaxEnt model. Chinese Journal of Agrometeorology 43(4): 262-275.
-
Li Xing, Huang Youyou, Ruan Tao, Wei Wei (2021) Habitat suitability evaluation of Qionglai Mountain red Panda based on MaxEnt model. Journal of Guizhou Normal University 40(2): 34-39.
-
Chen Yuguang, Le Xingui, Chen Yuhan, Cheng Wuxue, Du Jingui, et al. (2022) Potential geographical distribution of Cunninghamia lanceolata in China under climate change based on MaxEnt model. Chinese Journal of Applied Ecology 33(5): 1207-1214.
-
Yang Chao, Fan Weiying, CAI Xiaobin, Wang Xuelei, Zhang Yuming, et al. (2022) Evaluation of summer habitat suitability of free-range Milu deer in Shishou National Nature Reserve, Hubei Province based on MaxEnt model. Resources and Environment in the Yangtze Basin 31(2): 336-344.
-
Liu Hongcai, Zhao Naxun, Zhuang Yuqi, Yang Meiling, Zhao Huiru, et al. (2022) Habitat suitability evaluation of Mountain gazelle based on MaxEnt model in Qinling Mountains. Acta Ecologica Sinica (10): 1-8.
-
Jin Yi, Meng Jijun, Huang Jiao (2011) Ecological vulnerability assessment of grassland in Mu Us Sandy Land in recent 50 years: A case study of Uxin Banner, Inner Mongolia. Journal of Peking University (Natural Science) 47(5): 909-915.
-
Ma Yahong (2013) Prediction of the geographical distribution of mosses based on MaxEnt model and ArcGIS: A case study of Huaping Nature Reserve in Guangxi. Shanghai: College of Life and Environmental Sciences, Shanghai Normal University 112-113.
-
The SPSSAU project (2022) SPSSAU.
-
Yan Hong, Xu Yongyong (2017) Medical Statistics. 3rd Ed. People’s Medical Publishing House.
-
Sun ZQ (2006) Medical Comprehensive evaluation method and its Application. Chemical Industry Press.
-
Chen Wei, Xia Jianhua (2007) A weighting method based on Optimal Combination of subjective and objective weight Information. Mathematics in Practice and Understanding 37(1): 17-22.
-
Ye WJ (2021) Selection and feeding value evaluation of oats varieties in Ordos area. Master Thesis, Inner Mongolia Agricultural University.
-
Wang X, Zhao H, Li QF, Ge GT (2021) Comparative analysis of quality characters of five forage Oat varieties in different areas of Ulanqab. Forage, Feed and Additives (1): 118-123.
-
Yang Zhimin, Li Feng, Liu Jiancheng, Tong Wenhai, Huang Jinshan, et al. (2002) Comparison of performance and feeding value of 24 Oat varieties in the agro-pastoral interlacing area of Northwest Hebei Province. Journal of Hebei Agricultural Sciences 26(1): 54-60.
-
Tong Yongshang, Liu Yaofeng, Xu Changlin, Zhang Xuanming, Yu Xiaojun (2001) Effects of sowing date on yield and quality of 7 Oat varieties in semi-arid region. Pratacultural Science 38 (11): 2221-2236.
-
Chen Caijin, Shang Jihong, Shi Shangli, Wu Juan, Zeng Yanxia, et al. (2021) Correlation study on agronomic traits, yield and quality of seven forage Oat varieties in Liupan Mountain Area of Ningxia. Grassland and Turf 41(2): 129-135.
-
Ye Wenxing, Shi Fengling, Zhao Mengli, Gao Cuiping, Kong Lingqi, et al. (2019) Selection of suitable forage oats varieties in central and western Inner Mongolia. Chinese Journal of Grassland Science 44(3): 66-71.
-
Zhang Dongfang, Zhang Qin, Guo Jie, Sun Chengzhong, Wu Jie, et al. (2017) Study on ecological suitable area and ecological characteristics of Angelica sinensis based on MaxEnt model. Acta Ecologica Sinica 37(15) : 5111- 5120.
-
Li Xingshu, Cheng Shuangfei, Xue Zhi, Xiong Xiufang, Han Wenting, et al. (2019) Retrieval of water deficit index of summer corn silage based on UAV remote sensing. Transactions of the Chinese Society for Agricultural Machinery 50(9): 177-185.
-
Jin Yi, Meng Jijun, Huang Jiao (2011) Ecological vulnerability assessment of grassland in Mu Us Sandy Land in recent 50 years. Journal of Peking University 47(5): 909-915.
-
Zhao Jinlong, Wang Jinxin, Ma Liwen (2021) Climate suitability analysis of Oat husk cultivation in Ningxia based on GIS. Journal of Agricultural Sciences 11(9): 79- 84.
-
Lv Xiaodong, Wang Jianguang, Sun Qizhong, Yao Guiping, Gao Fengqin (2014) Study on yield estimation model of alfalfa artificial grassland by hyperspectral remote sensing. Acta Prataculturae Sinica 23(1): 84-91.
-
Tao Ya, Sun Qizhong, Xu Lijun, Li Feng (2002) Development situation and challenge of alfalfa industry in China. Grassland and Prataculture 34 (1): 1-10.
-
Zhang Yu, Yang Guang, Han Xueying, Liu Feng, Bai Cuixia (2002) Spatio-temporal dynamic evolution of land use in Uxin Banner. Journal of Northwest Forestry College 37(5): 171-178.
-
Zheng Keping, Liu Ruifang (2019) Variation characteristics of precipitation in Ushen Banner from 1961 to 2018. Journal of Agricultural Disaster Research 9(5): 2.
-
Luo Yuchang (2019) Analysis of climate change characteristics and its impact on animal husbandry in Mu Us Sandy Land. Agricultural Staff (19): 138.
-
Wang Peng, Ma Yujie, Gan Huilin, Gu Xinmin (2021) Performance and feeding value evaluation of 14 forage oats at the northern foot of Qilian Mountains. Journal of Animal Husbandry and Veterinary Medicine 41(6): 95- 98.
-
Gong Xiaoxu, Li Zhigang, Liu Peng (2020) Analysis and evaluation on yield and nutritional quality of Oat Cultivars introduced in West Liaohe Plain. Agriculture in jiangxi province 6(8): 104-105.
- Lessons to Learn: Trees are More than the Lungs of the World
- Community Forestry Enterprises as a Model for Sustainable Forest Development: The Case Of The "Baja Tarahumara" in Chihuahua, Mexico
- Ecological and Socio-Economic Impacts of Chromolaena odorata and Mesosphaerum suaveolens, Two Invasive Alien Species in Central and Southern Benin, West Africa
- Epigenetic Sustainability: Modeling the Human Factor as a Natural Resource through Science 4.0 and the NR3C1 Biological Pilot
- Growth-at-Risk: A Framework for Assessing Economic Vulnerability
- The Rural Territory as a Socioecological System for the Management of Public Policy for Sustainable Rural Development