Designing and Simulating a Natural Gas Dehydration Unit for Supplying a 350 MW Thermal Electric Power Plant
The aim of this paper is to determine the required volume of dehydrated natural gas to supply a thermal electric power station with a capacity of 350 MW. Thanks to Aspen HYSYS process simulation software which enables the creation and implementation of dependable process for natural gas dehydration. Based on calculations, it is determined that a natural gas volume of 62.47 MMSCF per day is necessary to supply a power plant with a capacity of 350 MW. Considering economic and efficiency factors, the process of gas dehydration by absorption with tri-ethylene glycol (TEG) as a washing solvent for natural gas with a water content of 0.486% is discussed. The design and simulation process at the outlet of the dehydration unit results in gas with a water content of 0%, meeting the specifications (0-15 lb/MMSCFD). The overall investment cost is 1,225,275,290.8 USD, generating an income of 1,322,489,900 USD and a profit of 97,214,609.2 USD.
Abbreviations
BTU/KWH: British Thermal Unit /Kilowatt hours; EC: Heat Exchanger; KW: Kilo watt; KLB/H: Kilo pound Per Hour; KPa: kilo pascal; LCV: Level Control Valve; MMGAL/H: Millions of Gallons per hour; MMSCF: Million Standard Cubic Feet; MMSCFD: Million Standard Cubic Feet per Day; MW: Megawatts; PSIA: Pounds Per Square Inch Absolute;
Rpm: Revolutions Per Minute; SEP: Separator; TEG: Tri- Ethylene Glycol; TEMA: Tubular Exchanger Manufacturers Association; USD: United States Dollar.
Introduction
In recent decades, natural gas has emerged as a sustainable energy source across all industries globally [1-
3]. The national hydrocarbon company of country X (for confidential reasons) ensures that all constitutional, lawful, and legitimate specifications are met after production and before marketing natural gas for confidentiality and authentication. The purification of natural gas involves a series of sequential processes, including dehydration [4, 5, 6]. Dehydration is the process of removing moisture from humid gas, which prevents the formation of hydrates and corrosion of materials [7, 8, 9]. This paper presents the construction of a 350 MW thermal power plant in country X to address the issue of load shedding and support the country’s industrial development. The project was initiated after the national hydrocarbon company delivered a thermal power plant for the production of electricity from natural gas. In 2022, natural gas production in country X involve the elimination of impurities such as CO2, H2S, and H2O that can harm production equipment, humans, and the environment. This paper also explores the dehydration of natural gas, which removes water from the gas and prevents equipment corrosion and gas pipeline blockages caused by hydrate formation [10, 11, 12].
For over 21 centuries, natural gas has been a crucial energy resource worldwide [13, 14, 15]. It is utilized in thermal electric power plants to generate electricity. However, natural gas can contain harmful compounds such as water and carbon dioxide at low temperatures, which can damage production equipment as a result of hydrates formation [16, 17, 18]. Water in natural gas causes pressure losses, pipe blockage, and reduces its calorific value, which is crucial for energy production through gas combustion [19]. Additionally, water acts as a catalyst for equipment corrosion, leading to motor malfunction in electricity production [20]. This paper focuses on finding a way to dehydrate natural gas to meet specifications and ensure proper equipment operation. To meet the contractual specifications for supplying a 350 MW gas-fired electric thermal power plant, the following question must be asked: What volume of natural gas is required to operate the power plant for 20 years with a gas engine? The objective of this paper is to design and simulate a natural gas dehydration unit to supply a thermal electric power plant with a capacity of 350 MW operating using a gas engine. This explore further the volume of natural gas required for a thermal electric power plant operating with a gas engine, determine the suitable process and solvent for natural gas dehydration, find a method for recycling the solvent needed for dehydration, and conduct an economic evaluation. The paper is organized into three sections: Section 1 presents the introduction, Section 2 outlines the methods used, Section 3 presents the data and results, and the conclusion is presented in Section 4.
Methods
This paper aims to design and simulate a natural gas dehydration unit to supply a 350 MW thermal electric power plant. Several techniques of natural gas dehydration have been employed for over a century. These techniques include TEG-based absorption, solid desiccant-based absorption, condensation by cooling, adsorption, and membranes. The choice of technique depends on downstream requirements. It is important to note that all techniques have their advantages and disadvantages, and the selection of the most appropriate technique is based on thorough evaluation of the specific situation. This paper employs the absorption technique using TEG as a solvent. The dehydration process consists of two sections: gas dehydration and solvent regeneration. Gas dehydration involves removing condensate and all liquid phases from the wet gas stream using the solvent in the absorber. In the presented process, liquid phases are collected at the bottom of sep 1, while the gaseous phase rises to the top and diffuses through the absorption column. The absorption column is scrubbed by TEG solvent, while solvent regeneration consists of TEG recycling. The recycling process occurs when the solvent is saturated with water and exits below the absorption column, as shown in Figure 1. The paper utilizes Aspen HYSYS as its simulation software, which is widely used in industrial chemical processing. The Aspen HYSYS software utilizes the Glycol package as the thermodynamic fluid package for natural gas dehydration processes. This software allows for the creation and implementation of reliable processes.
Results and Discussion
The daily flow rate of natural gas in MMSCFD used in a thermal electric power plant with a gas engine is calculated using [21]:
Q=P(KW)*24(hr)*n*C(BTU⁄KWH)/(PCI (BTU⁄MMSCF) ),(1) where P: power of the plant in KW; n is the load factor; C: the heat rate in (BTU⁄KWH) and PCI: lower calorific value (BTU⁄KWH). Table 1 shows the characteristics of a gas engine.
| Settings | Values |
|---|---|
| Nominal power | 18.3 MW |
| Heating rate | 8500.0 BTU/KWH |
| Load factor | 0.8 |
| Speed of motor | 750.0 rpm |
| Piston stroke | 430.0 millimeters |
| Cylinder bore | 310.0 millimeters |
| Composition | Percentage |
| CO 2 | 0.26% |
| Nitrogen | 0.33% |
| Methane | 89.449% |
| Ethane | 3.88% |
| Propane | 2.66% |
| Iso-butane | 0.44% |
| n-butane | 0.85% |
| Iso-pentane | 0.26% |
| n-pentane | 0.11% |
| Benzene | 0.01% |
| C * 6 | 1.21% |
| Toluene | 0.00% |
| n-heptane | 0.02% |
| E-benzene | 0.00% |
| n-octane | 0.00% |
| m-Mstyrene | 0.00% |
| n-decane | 0.00% |
| H O 2 | 0.486% |
Table 1: Characteristics of a gas engine.
Table 2 shows that the water content in natural gas is higher than other impurities. Thanks to Aspen HYSYS software for designing and simulating the dehydration process of natural gas with high water content.
III.1. Estimation of natural gas requirements for a 350 MW thermal electric power plant Using the data presented in Table 1 and equation (1), we can obtain the daily natural gas flow rate: Q=62.47 MMSCFD =
70216.28 m3/day. From this, we can deduce that Q=456,031 MMSCF for 20 years or Q= 456,031 BCF in 20 years as shown in Table 3. To generate 350 MW, nineteen 16V46DF motors are required.
| Unit | Q /day | Q/20 years |
|---|---|---|
| MMSCFD | 62.47 | 456 031 |
| BSC | 62.4710-3 | 456.031 |
| m3 | 70216.28 | 512 578 844 |
Table 2: To generate 350 MW, nineteen 16V46DF motors are required.
Design and sizing of the dehydration unit and the quantity of gas needed for the operation of the 350 MW thermal power plant.
The natural gas dehydration is based on the absorption of natural gas with TEG as the solvent. The solvent is recyclable. The necessary equipment for the dehydration process includes:
- A separator, to remove liquids;
- An absorption column for washing the gas itself;
- A separator to recover gases that end up in the liquid phase after the absorption column;
- Heat exchanger to heat the hydrated TEG;
- Distillation tower to dehydrate the TEG;
- A pump;
- A refrigerator;
- A regulator to recycle the TEG.
Figure 1 presents a block diagram of the natural gas dehydration unit using the absorption process with TEG as solvent.
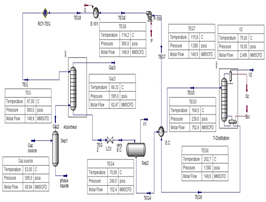
Figure 1 shows the natural gas source entering separator 1 at a pressure of 595 Psia, a temperature of 53°C, and a flow rate of 69.94 MMSCFD to remove condensate and all liquid phases. The liquid phase is collected at the bottom of separator 1, while the gaseous phase (Gas 2) rises to the top of separator 1 and diffuses through the absorption column to be scrubbed by the TEG. It is then injected at the top of the column at a pressure of 900 Psia, a temperature of 67°C, and a flow rate of 149.9 MMSCFD to be scrubbed in counter current. The dehydrated gas at the top of the column (Gas 3) is sent to the power plant at a steady flow rate of 62.47 MMSCF. The second phase of this process begins with recycling the TEG. The TEG2 becomes saturated with water and exits below the absorption column. It then passes through the separator (Sep 2) to recover the remaining gaseous phase in TEG2 at outlet V1. The hydrated TEG (TEG4) then goes through a heat exchanger to be heated before arriving at the distillation column where the TEG and water are separated by distillation. The reboiler heats TEG5 to 204°C to remove water, as impurities with a high boiling point. The condensed water is recovered at outlet V2, leaving dry TEG (TEG 6) to exit the reboiler at a flow rate of 149.97 MMSCFD and a temperature of 202.7°C. TEG 6 then heats TEG 4 in the heat exchanger (EC) before being pressurized to 900 Psia by the P-100 pump at a low pressure of 1.580 Psia. An E-101 chiller cools the TEG 8 to reach the TEG inlet temperature of 67°C. The RCY-TEG controller balances the unit pressure and temperature. After describing the overall operation process of the dehydration unit, the operation of each piece of equipment is presented below.
Separator (sep1)
This separator (sep1) comprises of a liquid that must be removed before dehydration begins. A two-phase separator is used for this purpose. The wet gas is injected with a flow rate of 69.94 MMSCFD, a temperature of 53°C, and a pressure of 595 Psia. At this temperature and pressure, the liquids are recovered at the bottom of the separator, while the gas (Gas 2) is directed towards the absorption column where dehydration occurs.
Absorption column
Figure 2 presents the 8-stage absorption column. The absorber’s efficiency is highest at 8 stages or more, making results below this level suboptimal. At 8 stages, the result is the same, but the number of stages is higher, making the absorption column more expensive. This justifies the choice of an 8-stage absorber.

Figure 2 illustrates the entry of Gas 2 from Sep 1 into the bottom stage, while TEG enters the first stage at the top of the column. The temperature of TEG is 67°C, the pressure is 900 Psia, and the flow rate is 149.9 MMSCFD. Counter current washing occurs with the dry gas (Gas 3) exiting at the top of the column and the hydrated TEG exiting at the bottom (TEG 2). Figure 3 depicts the evolution of temperature, pressure, liquid phase flow rate, and vapor phase flow rate.
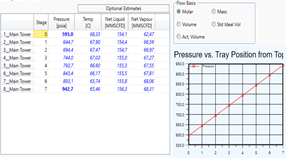
Figure 3 illustrates that the pressure decreases progressively from 942.7 Psia at stage 8 to 595 Psia at stage 1, with the greatest pressure at the bottom of the column. Conversely, the temperature increases from 65.46°C at the bottom of the column to 68.33°C at the top. The vapor phase volume decreases from bottom to top of the column, while the liquid phase volume increases from top to bottom. This justifies the TEG’s ability to recover water from the gas in a counter-current manner and move to the bottom of the column for recovery.
Separator (sep2) and Heat Exchanger (EC)
This is a gravity-based two-phase separator that separates the liquid phase (TEG2) from the vapor phase (V1) before the separator. A valve is installed to control the effluent flow and prevent problems such as clogging due to high liquid levels. The heat exchanger is presented in Fig. 4.
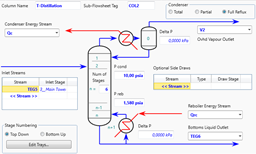
Figure 4 displays the tubular heat exchanger operating with a bundle of tubes enveloped by the calendar. The system has two inputs, TEG 4 and TEG 6, and two outputs, TEG 5 and TEG 7. TEG 4 enters at 70°C and acts as a cooling liquid for TEG 6 before exiting at 164.5°C as TEG 5. TEG 6 exits the reboiler at 202.7°C and reheats through heat exchange before emerging as TEG 7 at 114.2°C.
Distillation =-ower
The distillation tower is depicted in Figure 5.
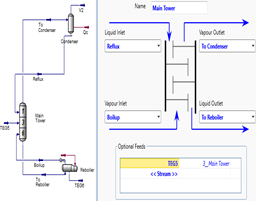
Figure 5 comprises 6 stages: A reboiler, and a condenser. Figure 6 illustrates the operation of the distillation tower.
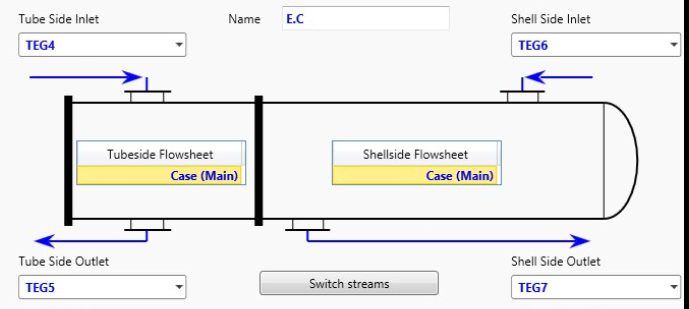
Figure 6 shows that TEG5 at 164.5°C and a flow rate of 152.4 MMSCFD enters the tower at stage 3 and flows to the reboiler. Here, it is heated to 204°C at 1.580 Psi. At the outlet, the liquid phase of TEG6 first reaches 202.7°C with a flow rate of 149.9 MMSCFD. Then, the vapor phase rises to the condenser at 10 Psi and 80°C, forming two phases: The vapor phase V2 at 75°C with a flow rate of 2.496 MMSCFD and a liquid phase with a flow rate of 0.7488 MMSCFD, which returns to the column. Then, the vapor phase rises to the condenser at 10 Psi and 80°C, forming two phases: the vapor phase V2 at 75°C with a flow rate of 2.496 MMSCFD and a liquid phase with a flow rate of 0.7488 MMSCFD, which returns to the column. The column’s residence time is 60 seconds, as shown in Fig. 7, which illustrates the evolution of these parameters.
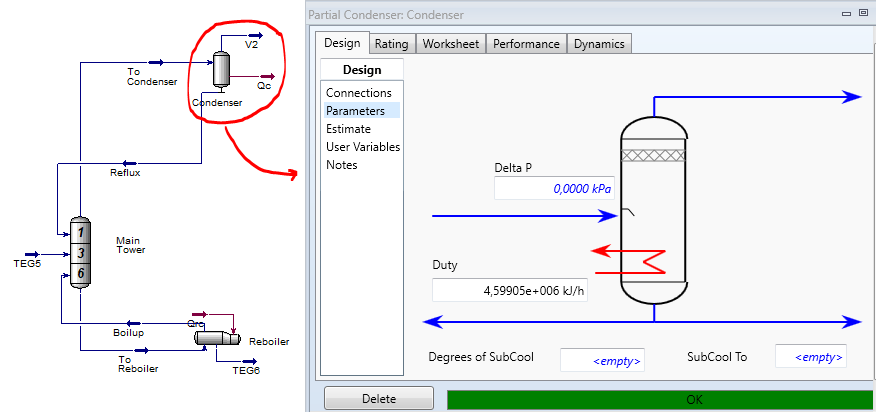
Figure 8 illustrates the functioning of the reboiler.
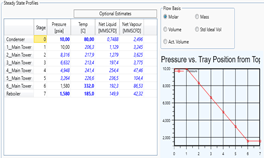
Figure 8 shows a kettle-type reboiler or vaporizer, which is a submerged beam reboiler that vaporizes water and directly separates the two phases. The design includes a weir that is constantly submerged and has a height approximately equal to the diameter of the beam. The calandria diameter is much larger than that of the beam to provide a steam disengagement zone above the liquid and prevent liquid entrainment. The mixture is heated to 204°C, causing the liquid water to vaporize and enter the column in vapor form. The water is then recovered in the condenser, while the TEG6 without water is returned to the circuit as recycled TEG. Figure 9 illustrates the operation of the condenser.
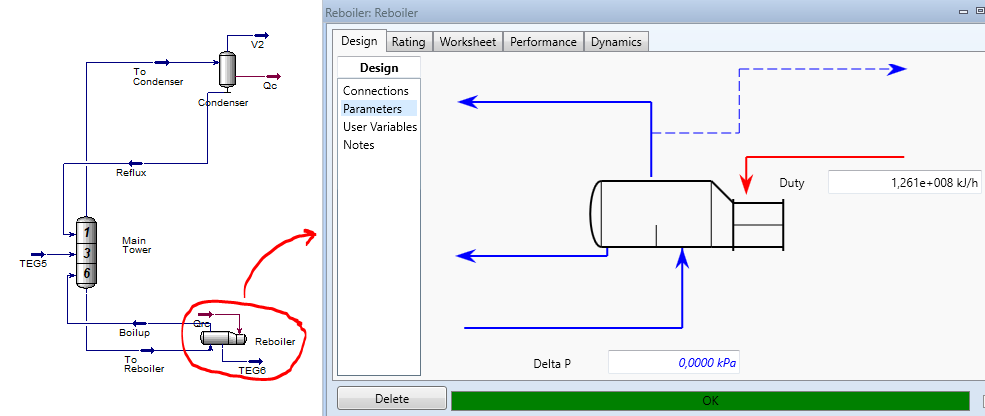
Figure 9 shows a tubular heat exchanger, known as the condenser, which is designed to recover water vapor from the column and return it in liquid form. The condenser is composed of one-centimeter-diameter tubes, and air is used as the cooling fluid.
P-100 pump
The P-100 pump increases the TEG7 pressure from 1.580 to the required process inlet pressure of 900 Psia. It has a power rating of 2460 KW. Table 4 displays the characteristics of the P-100 pump.
| Settings | Values |
|---|---|
| Delta P | 6194 KPa |
| Power | 2460 KW |
| Inlet pressure | 1,580 Psia |
| Discharge pressure | 900 Psia |
| Speed | 149,9 MMSCFD |
Table 3: P-100 pump specifications.
Figure 10 displays the dimensions of the P-100 pump.
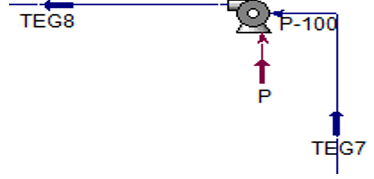
Figure 10 shows that the P-100 pump increases the pressure of TEG 7 by 1.580 Psia at discharge, while TEG 8 is pressurized to 900 Psia to achieve the injection pressure.
Cooler and controller
The chiller lowers the temperature of TEG8 from 114.2°C to 67°C, which is the temperature at which the dewatering process begins, using electrical power. The controller considers any changes in the process parameters such as pressure, temperature, and flow.
Dehydration Unit Simulation: Post- treatment gas composition and estimated TEG loss.
Table 5 presents the results of the simulation of the natural gas dehydration unit depicted in Fig. 1.
| Composition | Before the dehydration unit simulation | After the simulation of the dehydration unit |
|---|---|---|
| CO 2 | 0.26% | 0.23% |
| Nitrogen | 0.33% | 0.32% |
| Methane | 89.449% | 91.57% |
| Ethane | 3.88% | 3.84% |
| Propane | 2.66% | 2.50% |
| Iso-butane | 0.44% | 0.40% |
| n-butane | 0.85% | 0.75% |
| Iso-pentane | 0.26% | 0.21% |
| n-pentane | 0.11% | 0.08% |
| Benzene | 0.01% | 0.00% |
| C * 6 | 1.21% | 0.09% |
| Toluene | 0.00% | 0.00% |
| n-heptane | 0.02% | 0.00% |
| E-benzene | 0.00% | 0.00% |
| n-octane | 0.00% | 0.00% |
| m-Mstyrene | 0.00% | 0.00% |
| n-decane | 0.00% | 0.00% |
| H O 2 | 0.486% | 0.00% |
Table 4: Gas Composition before and after Treatment.
Table 5 displays the composition of Gas 3 and the output from the absorption column. It is evident that, after the absorption operation, the water percentage is 0% per MMSCFD, meeting the specifications for a gas-fired power plant, which require a value between 0 to 15% per MMSCFD. Therefore, the dehydration process is satisfactory. Table 6 presents the TEG loss, which allows for an assessment of the TEG lifetime.
| Gaz source | TEG | Gaz2 | phase liquid | Gaz3 | TEG 2 | vers E.C | V1 | TEG4 | TEG5 | TEG7 | V2 | TEG6 | TEG8 | TEG9 | TEG-RCY | |
|---|---|---|---|---|---|---|---|---|---|---|---|---|---|---|---|---|
| Comp Mole Frac (Nitrogen) | 0,0026 | 0,0000 | 0,0033 | 0,0009 | 0,0026 | 0,0004 | 0,0004 | 0,0073 | 0,0003 | 0,0003 | 0,0000 | 0,0328 | 0,0000 | 0,0000 | 0,0000 | 0,0000 |
| Comp Mole Frac (Methane) | 0,0033 | 0,0000 | 0,9071 | 0,0002 | 0,9254 | 0,0296 | 0,0296 | 0,8595 | 0,0086 | 0,0086 | 0,0000 | 0,0156 | 0,0000 | 0,0000 | 0,0000 | 0,0000 |
| Comp Mole Frac (Ethane) | 0,8949 | 0,0000 | 0,0390 | 0,1331 | 0,0348 | 0,0033 | 0,0033 | 0,0606 | 0,0018 | 0,0018 | 0,0000 | 0,5226 | 0,0000 | 0,0000 | 0,0000 | 0,0000 |
| Comp Mole Frac (Propane) | 0,0388 | 0,0000 | 0,0264 | 0,0222 | 0,0201 | 0,0036 | 0,0036 | 0,0453 | 0,0025 | 0,0025 | 0,0000 | 0,1107 | 0,0000 | 0,0000 | 0,0000 | 0,0000 |
| Comp Mole Frac (i-Butane) | 0,0266 | 0,0000 | 0,0043 | 0,0408 | 0,0039 | 0,0003 | 0,0003 | 0,0054 | 0,0002 | 0,0002 | 0,0000 | 0,1545 | 0,0000 | 0,0000 | 0,0000 | 0,0000 |
| Comp Mole Frac (n-Butane) | 0,0044 | 0,0000 | 0,0081 | 0,0135 | 0,0073 | 0,0007 | 0,0007 | 0,0105 | 0,0004 | 0,0004 | 0,0000 | 0,0112 | 0,0000 | 0,0000 | 0,0000 | 0,0000 |
| Comp Mole Frac (n-Butane) Comp Mole Frac (i-Pentane) | 0,0085 | 0,0000 0,0000 | 0,0081 0,0023 | 0,0339 | 0,0073 0,0021 | 0,0007 0,0002 | 0,0007 0,0002 | 0,0105 0,0026 | 0,0004 0,0001 | 0,0004 0,0001 | 0,0000 0,0000 | 0,0247 | 0,0000 0,0000 | 0,0000 0,0000 | 0,0000 0,0000 | 0,0000 0,0000 |
| Comp Mole Frac (i-Pentane) | 0,0026 | 0,0000 | 0,0023 | 0,0199 | 0,0021 | 0,0002 | 0,0002 | 0,0026 | 0,0001 | 0,0001 | 0,0000 | 0,0062 | 0,0000 | 0,0000 | 0,0000 | 0,0000 |
| Comp Mole Frac (n-Pentane) | 0,0011 | 0,0000 | 0,0010 | 0,0102 | 0,0009 | 0,0001 | 0,0001 | 0,0011 | 0,0000 | 0,0000 | 0,0000 | 0,0028 | 0,0000 | 0,0000 | 0,0000 | 0,0000 |
| Comp Mole Frac (n-Pentane) Mole Frac | 0,0001 | 0,0000 | 0,0010 | 0,0021 | 0,0009 | 0,0001 | 0,0001 | 0,0011 | 0,0000 | 0,0000 | 0,0000 | 0,0018 | 0,0000 0,0000 | 0,0000 | 0,0000 | 0,0000 |
| Comp Mole Frac (Toluene) | 0,0002 | 0,0000 | 0,0001 | 0,0072 | 0,0000 | 0,0000 | 0,0000 | 0,0000 | 0.0000 | 0,0000 | 0,0000 | 0,0024 | 0,0000 | 0,0000 | 0,0000 | 0,0000 |
| Comp Mole Frac (n-Heptane) | 0,0000 | 0,0000 | 0,0000 | 0,0000 | 0,0000 | 0,0000 | 0,0000 | 0,0000 | 0,0000 | 0,0000 | 0,0000 | 0,0000 | 0,0000 | 0,0000 | 0,0000 | 0,0000 |
| Comp Mole Frac (n-Heptane) Comp Mole Frac (C6+_3*) | 0,0121 | 0,0000 0,0000 | 0,0000 0,0018 | 0,6540 | 0,0000 0,0017 | 0,0000 0,0001 | 0,0000 0,0001 | 0,0000 0,0013 | 0,0000 0,0001 | 0,0000 0,0001 | 0,0000 0,0000 | 0,0046 | 0,0000 0,0000 | 0,0000 0,0000 | 0,0000 0,0000 | 0,0000 0,0000 |
| Comp Mole Frac (C6+_3*) | 0,0000 | 0,0000 | 0,0018 | 0,0000 | 0,0017 | 0,0001 | 0,0001 | 0,0013 | 0,0001 | 0,0001 | 0,0000 | 0,0000 | 0,0000 | 0,0000 | 0,0000 | 0,0000 |
| Comp Mole Frac (E-Benzene) | 0,0000 | 0,0000 | 0,0000 | 0.0000 | 0,0000 | 0,0000 | 0,0000 | 0,0000 | 0,0000 | 0,0000 | 0,0000 | 0,0000 | 0,0000 | 0,0000 | 0,0000 | 0,0000 |
| Comp Mole Frac (n-Octane) | 0,0000 | 0,0000 | 0,0000 | 0,0000 | 0,0000 | 0,0000 | 0,0000 | 0,0000 | 0,0000 | 0,0000 | 0,0000 | 0,0000 | 0,0000 | 0,0000 | 0,0000 | 0,0000 |
| Comp Mole Frac (n-Nonane) | 0,0000 | 0,0000 | 0,0000 | 0,0000 | 0,0000 | 0,0000 | 0,0000 | 0,0000 | 0,0000 | 0,0000 | 0,0000 | 0,0000 | 0,0000 | 0,0000 | 0,0000 | 0,0000 |
| Comp Mole Frac (n-Decane) | 0,0000 | 0,0000 | 0,0000 | 0,0000 | 0,0000 | 0,0000 | 0,0000 | 0,0000 | 0,0000 | 0,0000 | 0,0000 | 0,0000 | 0,0000 | 0,0000 | 0,0000 | 0,0000 |
| Comp Mole Frac (H2O) | 0,0049 | 0,0000 | 0,0040 | 0,0620 | 0,0000 | 0,0018 | 0,0018 | 0,0000 | 0,0018 | 0,0018 | 0,0000 | 0,1098 | 0,0000 | 0,0000 | 0,0000 | 0,0000 |
| Comp Mole Frac (TEGlycol) | 0,0000 | 1,0000 | 0,0000 | 0,0000 | 0,0000 | 0,9593 | 0,9593 | 0,0000 | 0,9836 | 0,9836 | 1,0000 | 0,0003 | 1,0000 | 1,0000 | 1,0000 | 1,0000 |
Table 5: Loss of TEG.
Table 6 indicates that there is no TEG loss at valve V1, while there is a loss of 0.03%, resulting in a recycling rate of 99.97%. It is important to note that TEG efficiency is optimal when the concentration is above 95%. If the concentration falls below this threshold, the TEG must be replaced or the concentration increased. Therefore, in the procedure depicted in Figure 1, the concentration increases by 5% after 167 days of use, corresponding to a volume of 7.495 MMSCF. In the next 20 years, this value will need to be added 44 times, resulting in an estimated TEG requirement of approximately 477.523 MMSCF.
Economic Evaluation
Table 7 displays the prices of the different equipment items for the dewatering unit depicted in Figure 1, which includes transport and installation costs. The prices are obtained using Aspen HYSYS software.
| Zone name | Equipment Name | Equipment type | Cost in USD |
|---|---|---|---|
| Miscellaneous Flowchart Area | Sep 02 DVT CYLINDER | 447400 | |
| Miscellaneous Flowchart Area | RCY-TEG | TEG12VDC-24 | 1000 |
| Miscellaneous Flowchart Area | E-101 | DHE TEMA EXCH | 461000 |
| Miscellaneous Flowchart Area | LCV | V501 | 700 |
| Miscellaneous Flowchart Area | Sep 01 DVT CYLINDER | 118100 | |
| Miscellaneous Flowchart Area | P-100 | DCP CENTRIF | 947300 |
| Miscellaneous Flowchart Area | EC | DHE TEMA EXCH | 1.47E+06 |
| Absorber | Main Tower_@ Absorber | DTW TOWER | 462100 |
| T-Distillation | Main Tower_@T-Distillation | DTW TOWER | 4.71E+06 |
| T-Distillation | Condenser_@T-Distillation- cond DHE | TEMA EXCH | 73200 |
| T-Distillation | Condenser_@T-Distillation- cond acc | DHT HORIZ DRUM | 112300 |
| T-Distillation | Condenser_@T-Distillation- reflux pump | DCP CENTRIF | 34400 |
| T-Distillation | Reboiler_@T-Distillation-reb | DRB U TUBE | 952400 |
| Total net equipment and installation | 9 789 900 USD | ||
| Border taxes | 30% | ||
| Overall cost of installation all taxes included | 11 090 520 USD |
Table 6: Cost of dehydration unit equipment.
Table 7 displays a total of $9,789,900 for equipment and installation. It is essential to include customs duties, estimated at around 30% of the equipment’s value, as all equipment is imported. This amounts to $1,300,220, resulting in a total of $11,090,520, including all taxes. Table 8 shows the operating cost of the dehydration unit.
| Description | Fluid | Speed | Unit | Bit unit | Cost in USD |
|---|---|---|---|---|---|
| electricity | 3079.812 | KW | KW | 238.68543 USD/H | |
| Cooling water | water | 0.751856 | MMGAL | MMGAL/H | MMGAL/H 90.22272 USD/H |
| Heating | Heating | 153.1503 | KLB | KLB/H | 179.390013 USD/H |
| Maintenance cost | 100 USD/J | ||||
| Operating cost (per year) | 4 306 204,46 USD | ||||
| Operating cost over 20 years | 86 124 089,2 USD |
Table 7: Operating costs for the dewatering unit.
Conclusions
The paper deals with the design and simulation of a natural gas dehydrator to supply a 350 MW power station. The first step was to determine the daily gas flow required for the power plant. Next, the most suitable dehydration process and solvent for dehydrating the gas were identified, followed by an economic evaluation of the project. The results indicate that absorption dehydration of natural gas using tri-ethylene glycol as the solvent was the most suitable process. The required gas flow was 62.47 MMSCFD. The percentage of water in the natural gas has been reduced from 0.486% to 0%, meeting specifications. The recycling rate was 99.97%. The total investment was USD 1225275290.8, with a return on investment of USD 1322489.000 and a profit of USD 97214609.2 over 20 years.
Authors’ contributions
Remy Davy Mendogo and Rolande Tsapla Fotsa proposed designing and simulating a natural gas dehydration unit to supply a 350 MW thermal electric power plant. Bernard Dabole and Albert Chambali Mena used Aspen HYSYS simulation software to create and implement the natural gas dehydration process to support this study. Finalise Komofor Ngopuh and Sifeu Takougang Kingni participated in the interpretation of the results at different stages. All authors contributed to the interpretation of the results and the writing of the manuscript.
References
-
Alexandre R, Bernard D, Claude J, Sophie J, Michel V (1994) Le gaz naturel production traitement transport. Editions Technip 113: 256-262.
-
Pierre Wauquier, Le raffinage du pétrole (1998) Procédés de séparation 2ème volume, Editions Technip publications de l’institut français du pétrole 1-3: 7-9.
-
T Liu, Na Zhou, Q Wu, D Wang, X Hu (2021) Toward a sustainable energy system in China: Status and influencing factors. Energy Exploration & Exploitation 40(2): 580-598.
-
S Rubaiee (2023) High sour natural gas dehydration treatment through low temperature technique: Process simulation, modeling and optimization. Chemosphere 320: 138076. and Literature Review of the Properties for the Carbon $$ D i o x i d e - W a t e r S y s t e m, I n d u i t r i a l \& E n g i n e e r i e n g $$ Chemistry Research 43(7): 1794-1802.
-
Anderson GK (2002) Solubility of Carbon Dioxide in Water under Incipient Clathrate Formation Condition. J Chem Eng Data 47(2): 219-222.
-
Farag HAA, Ezzat MM, Amer H, Nashed AW (2011) Natural gas dehydration by desiccant materials. Alexandria Engineering Journal 50(4): 431-439.
-
Gandhidasan P, Al-Farayedhi AA, Al-Mubarak AA (2001) Dehydration of natural gas using solid desiccants. Energy 26(9): 855-868.
-
Rojey (1994) Le Gas Naturel, Production, Traitement et Transport, Editions Technip, Paris, Franc, pp: 70-74
-
Maria G, Rossi F (2021) Hydrate formation as a method for natural gas separation into single compounds: a brief analysis of the process potential. Arab J Geosci 14: 846.
-
Chen WC, Gang YX, Liu P, Chang SB, Wen CG, et al. (2021) Enhanced Regeneration of Triethylene Glycol Solution by Rotating Packed Bed for Offshore Natural Gas Dehydration Process: Experimental and Modeling Study. Chemical Engineering and Processing - Process Intensification 168: 108562.
-
Anyadiegwu, Kerunwa A, Oviawele P (2014) Natural gas dehydration using triethylene glycol TEG. Petroleum Coal 56(4): 407-417.
-
González-De León M, Di Scipio-Cimetta S (2022) The role of natural gas in today’s energy transition. DYNA 89(221): 92-100.
-
Massarweh O, Al-khuzaei M, Al-Shafi M, Bicer Y, Abushaikha AS (2023) Blue hydrogen production from natural gas reservoirs: A review of application and feasibility. Journal of CO2 Utilization 70: 102438.
-
Barasa Kabey MJ, Akanni O (2022) Sustainable Energy Transition for Renewable and Low Carbon Grid Electricity Generation and Supply. Front Energy Res 9: 2-45.
-
Gajanayake SM, Gamage RP, Xiao-Sen L, Huppert H (2023) Natural gas hydrates – Insights into a paradigm- shifting energy resource. Energy Reviews 2(1): 100013.
-
Merey S, Nik SL (2018) The role of natural gas hydrate during natural gas transportation, OHU J Eng Sci 7(2): 937-953.
-
Koh CA, Sloan ED, Sum AK, Wu DT (2011) Fundamentals and Applications of Gas Hydrates. Annual Review of Chemical and Biomolecular Engineering 2: 237-257.
-
Ali A, Zaki Naji SH, Saad Hashim A (2020) Effects of non-hydrocarbons impurities on the typical natural gas mixture flows through a pipeline. Journal of Natural Gas Science and Engineering 76: 103218.
-
Hadzihafizovic (2023) Corrosion in oil and gas industry, Oil & Gas Process Engineering at Tunis, Maersk Oil.
-
Borgmästars (2016) Fuel flexible power plants from Wärtsilä. Wärtsilä Technical Journal 2: 4-9.
- Lessons to Learn: Trees are More than the Lungs of the World
- Community Forestry Enterprises as a Model for Sustainable Forest Development: The Case Of The "Baja Tarahumara" in Chihuahua, Mexico
- Ecological and Socio-Economic Impacts of Chromolaena odorata and Mesosphaerum suaveolens, Two Invasive Alien Species in Central and Southern Benin, West Africa
- Epigenetic Sustainability: Modeling the Human Factor as a Natural Resource through Science 4.0 and the NR3C1 Biological Pilot
- Growth-at-Risk: A Framework for Assessing Economic Vulnerability
- The Rural Territory as a Socioecological System for the Management of Public Policy for Sustainable Rural Development