Evaluation the Soil Quality Related to Different Land Use Type in Kharas Village, Northwest Hebron, Palestine
The impact of different land use types on soil quality was evaluated by measuring several soil properties that are sensitive to stress or disturbance. The soil quality indicators was selected including physical (texture, bulk density and soil moisture), chemical (pH, electrical conductivity, total and available K, Na, P, NO3, NH4 contents) and biological (active carbon and organic matter) parameters. These parameters were assayed on soil samples collected in Kharas village, northwest Hebron, Palestine. Surface soil samples from 0-8 cm depth were collected from six randomly selected points in each two different land use types which are the cultivated land and uncultivated land by using a hand auger in September 2016. In this research the soil texture is not considered as indicator of soil quality between cultivated land and uncultivated land because it is the same. The studied soil was silty clay loam for both lands with the expectation of soils from Hebron area. Based on the results of soil quality parameters we found a clear difference between them. Ammonia, Nitrate, EC and Sodium were higher in the cultivated land due to the overexposure to minerals form fertilizers, pesticides and herbicides. Meanwhile, Potassium and Phosphate concentrations were found higher in the uncultivated land because in the cultivated land there is consumption by the cultivated plants. But the results in some parameters such as carbon dioxide, pH and bulk density were comparable for each of the two lands. The reason for that, because the land that the soil sample were taken was not cultivated from three years ago, this period may be not sufficient to change the properties of soil. We recommended the researchers to take the period of time into consideration to get more accurate results.
Introduction
Soil is an important component of terrestrial ecosystems because it preserves nutrient reserves, supports many biological processes (such as activities linked to nutrient cycles) and filters, keeps and transforms pollutants reducing their toxic effect. The capacity of soil to function can be reflected by measured soil physical, chemical and biological properties, also known as soil quality indicators [1]. Soil properties that can be changed in a short time by land use dynamic are considered as soil quality indicators [2]. For evaluation of soil quality, it is desirable to select indicators that are directly related to soil quality. If a set of attributes is selected to represent the soil functions and if appropriate measurements are made, the data may be used to elaborate the soil quality [3]. Globally, declining in soil quality (SQ) has posed a tremendous challenge to increasing agricultural productivity, economic growth, and healthy environment [4, 5]. The underlying causes for SQ degradation are largely related to inappropriate land use and soil management, erratic and erosive rainfall, steep terrain, deforestation, and overgrazing [6]. Some authors [7] have suggested that soil quality is simply related to the quantity of crops produced. However, others have emphasized the importance of demonstrating how soil quality affects feed and food quality, or how soil quality affects the habitat provided for a wide array of biota. Numerous other aspects associated with the living and dynamic nature of soil will be encountered if the concept of soil quality is considered in relation to different land uses: cultivated and uncultivated lands, etc. Current research suggests that soil management to improve infiltration, aeration, and biological activity can lead to significant gains in crop yields [8, 9]. Yield gains from improved soil quality can be large on croplands that have suffered historic degradation from erosion. Soil management to improve soil quality is an opportunity to simultaneously improve profitability and environmental performance. Managing for soil health (improved soil function) is mostly a matter of maintaining suitable habitat for the myriad of creatures that comprise the soil food web. This can be accomplished by disturbing the soil as little as possible, growing as many different species of plants as practical, keeping living plants in the soil as often as possible, and keeping the soil covered all the time (USDA) [10]. In the former works there were taken different types of land, such as [1] four different land uses, no-till corn without manure (NT), no-till corn with manure (NTM), no-till corn–soybean rotation (NTR), conventional tillage corn (CT), and meadow (M). Another study took three different adjacent land uses including natural forest, cultivated land and reforested land, the results shows that the natural forest has the best soil quality [11]. In our research there is two different land uses (cultivated and uncultivated land) the cultivated land used to be planted since ancient times with wheat and snake cucumber each year separately. The uncultivated land was left without any cultivation process three years ago. The assessment of soil quality was conducted to identify if there is any changes that affect soil quality in the uncultivated land. Also, to identify the effect of yield productivity on the soil quality. The objective of the present study was to identify soil quality properties, and compare the changes in the soil quality indicators in response to different land uses in Kharas village, northwest Hebron, Palestine.
Materials and Methods
The study area is located 31.6 Latitude, 35.0 longitudes. 11 km northwest Hebron (graph 1). Kharas village located on the mountain range, at an altitude of 523 above sea level. The average annual rainfall in the town 481 mm and occurs mainly from October to April, and an annual average temperature is 17ºC, the average relative humidity is 60%. Kharas village located on an area of 800.6 dunums, of which about 500.5 dunums are considered arable land (of which 242.4 dunums planted). The soils of the study area are classified as a silty clay loam with different land uses [12]. The study included two adjacent land parcels under different uses in Kharas village including: (1) cultivated land, (2) uncultivated land. Soil sampling and pretreatments surface soil samples from 0-8 cm depth were collected in September 2016 from six randomly selected points in the two adjacent land uses, using a hand auger, were air-dried and passed through a 2 mm sieve to remove stones, roots, and large organic residues before conducting analyses for chemical, biological and physical characteristics at the Soil and Hydrology Research (SHR), Al-Quds University, Palestine.
Physical Properties
The soil samples collected by a cylindrical metal sampler (core diameter 60 mm), were oven dried at 105ºC for 24 hour and weighed to calculate the bulk density. Particle size distribution was determined by the wet sieving method and was used with a set of sieves of 2.0 to 0.63 mm diameter. Soil moisture was determined by dried in oven at 105°C.
Chemical Properties
Soil pH was measured in saturated soil using pH meter and electrical conductivity (EC) was measured in the saturated paste using conductivity meter. Potassium (K) and sodium (Na) measured by using the flam photometer. Nitrate (NO3¯) measured by using the spectrophotometer at (220 and 275nn) wavelength. Ammonia (NH4) and available phosphate (PO4¯³) concentrations were measured by using the Hack device. In general, active carbon, ammonia, sodium and nitrate were determined by using standard methods.
Biological Properties
The trapped carbon dioxide (CO2) was calculated as a function of soil respiration rate by titration of the contents of the test tube with HCl. Soil organic matter (SOM) was determined using a wet combustion method (dried the sample at 105°C to remove all water and then ashed for two hours at 500°C). Active carbon was determined by using the Spectrophotometer at wavelength 550nm.
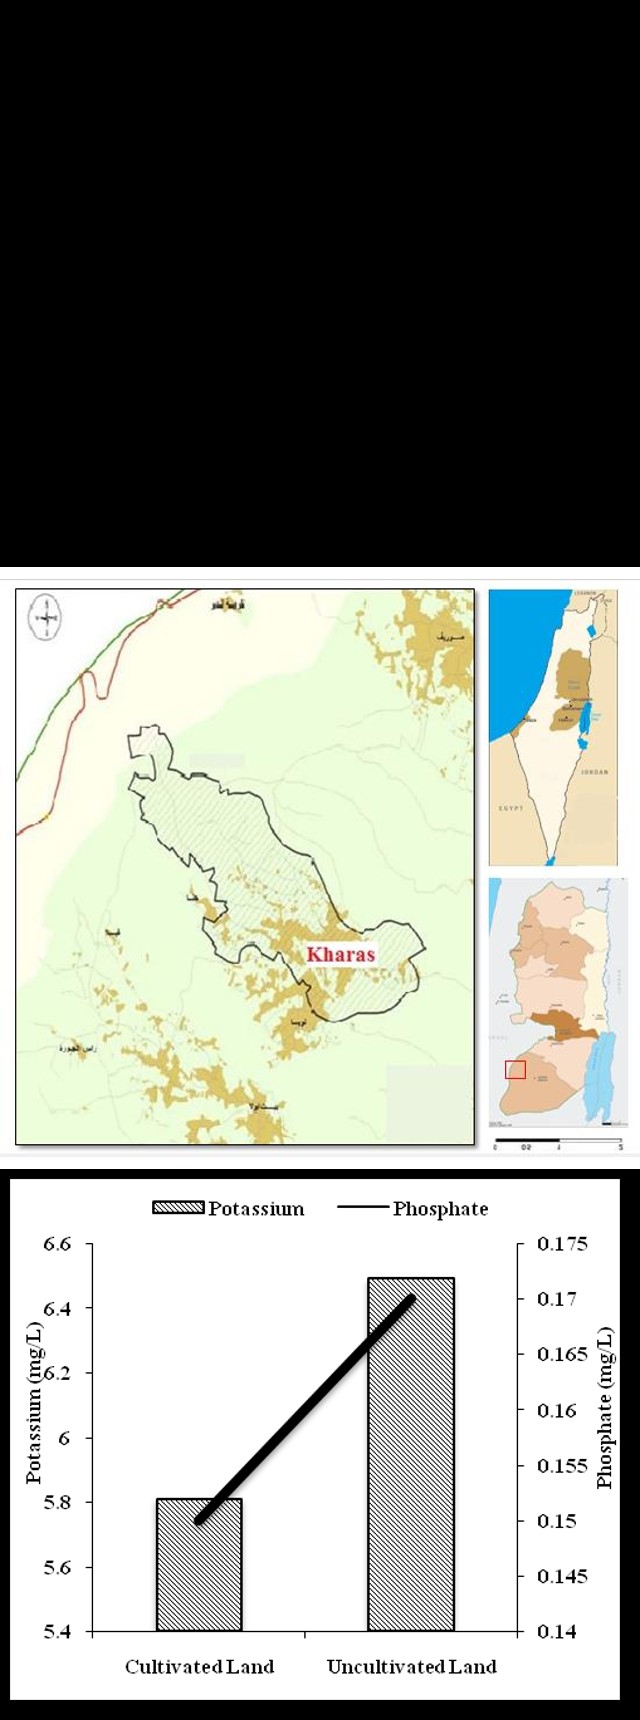
Graph 1: Kharas Village, Northwest Hebron, Palestine (Study Area).
Results and Discussion
For our research the soil texture is not considered as indicator of soil quality between cultivated land and uncultivated land because it is the same. The studied soil were generally silty clay loam, with the expectation of soils from Hebron area.The physical, chemical and biological soil quality parameter for the cultivated land and uncultivated land are illustrated in table 1. All studied soils have a good organic matter content related to the ideal soil quality [13]. Organic matter in the uncultivated land was higher than the cultivated land, since the soil in the first case was not tilled or exposed to erosion. The continuous use of heavy farm machineries can further aggravate the loss of soil organic matter (SOM) through erosion. Organic matter loss because of the presence of organisms that work to break down the organics and the loss of SOM combined with greater sand content and poorer aggregation resulted in higher bulk density. Active carbon in the cultivated land was higher than the uncultivated land and that associated with organic matter [14]. Activated carbon's adsorptive properties are used to remove organics. Generally, adsorption takes place because all molecules exert forces to adhere to each other. Activated carbon adsorbs organic material because the attractive forces between the carbon surface (non- polar) and the contaminant (non-polar) are stronger than the forces keeping the contaminant dissolved in water (polar) [15]. The pH values were neutral, but in the cultivated land were higher than the uncultivated land. Most organics are less soluble and more readily adsorbed at a lower pH, as the pH increases the removal decreases. A rule of thumb is to increase the size of the carbon bed by twenty percent for every pH unit above neutral (7.0) [15]. Electrical Conductivity (EC) sources in soil comes from nutrients (ammonium-nitrogen, nitrate-nitrogen and phosphate and sodium from fertilizers) and pesticides (insecticides and herbicides mostly) so that the EC value and Sodium concentration in cultivated land are higher than uncultivated land. Particularly high Potassium and Phosphate concentrations were found in the uncultivated land because in the cultivated land there is consumption by the cultivated plants. The relationship between Potassium and Phosphate concentrations representing in graph 2 clearly shows that the concentrations of the both are higher in the uncultivated land.
Graph 2: Potassium and Phosphate Concentrations in the Cultivated Land and Uncultivated Land.
Soil moisture in the uncultivated land is higher than the cultivated land because the plants in the cultivated land uptake water from the soil. The percentage of soil moisture has positive relation with the percent of silt and clay as presented in graph 3 because silt and clay holds water. Meanwhile, the percentage of sand is higher were the soil moister are lower in the cultivated land. Carbon dioxide (CO2) is much more abundant in cultivated land that is because plant roots respire and produce CO2. But, our results of the cultivated land and uncultivated land are the same (1.3 mg/L), because the time of sampling from the cultivated land was in autumn and there is no plant cultivated. The agricultural is sources of Ammonia, which are estimated to be higher in cultivated land, include livestock production and fertilizer use on crops. Animal agriculture is estimated to contribute approximately 40% of total ammonia emissions (mainly from manure), and crop agriculture is estimated to contribute an additional 20% from synthetic fertilizer application and crop emissions. The same as Nitrate concentration was found higher in the cultivated land than uncultivated land due to the overexposure to mineral fertilizers.
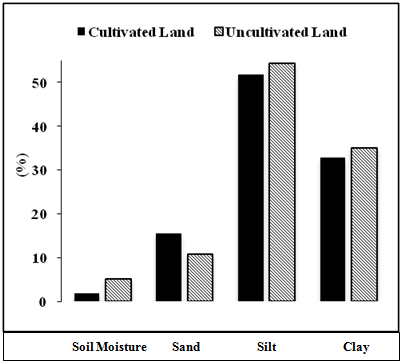
Graph 3: Soil Moisture, Sand, Silt and Clay Percentage in the Cultivated Land and Uncultivated Land_._
| Cultivated | Uncultivated | |||||||
|---|---|---|---|---|---|---|---|---|
| Test | ||||||||
| Land | Land | |||||||
| Soil Chemistry | ||||||||
| pH | 7.3 | 7.1 | ||||||
| EC (µs/cm) | 388 | 169 | ||||||
| Nitrate (mg/L) | 3.91 | 1.29 | ||||||
| Sodium (mg/L) | 7.87 | 4.44 | ||||||
| Potassium (mg/L) | 5.81 | 6.49 | ||||||
| Phosphate (mg/L) | 0.15 | 0.17 | ||||||
| Ammonia (mg/L) | 0.33 | 0.09 | ||||||
| Soil Physics | ||||||||
| Bulk Density (g/cm³) | 1.29 | 1.3 | ||||||
| Soil Moisture (%) | 1.8 | 5.2 | ||||||
| Soil Texture (%) | ||||||||
| Sand | 15.5 | 10.7 | ||||||
| Silt | 51.73 | 54.3 | ||||||
| Clay | 32.77 | 35 | ||||||
| Soil Biology | ||||||||
| Carbon Dioxide (mg/L) | 1.3 | 1.3 | ||||||
| Active Carbon (mg/L) | 31.96 | 30.08 | ||||||
| Organic Matter (%) | 4.3 | 4.8 |
Conclusion
Several physical, chemical and biological parameters, in soils affected by different land use types, were used for a thorough analysis the soil quality for the cultivated land and uncultivated land. Based on the results of soil quality parameter we found clear differences between them. As the land-use change from year to year the impact on soil quality and excessive use of fertilizers and pesticides weakens the soil. But the results in some parameters were comparable for each of the two lands. The reason for that, because the land that the soil sample were taken was not cultivated from three years ago, this period may be not sufficient to change the properties of soil. We recommended the researchers to take the period of time into consideration to get more accurate results.
Acknowledgements
We gratefully acknowledge Dr. Jawad AH Shoqeir for his encouragement, guidance and advices to prepare this paper. Many thanks to the Soil and Hydrology Research Lab (SHR), especially Doha Awwad for her cooperation.
References
-
Shukla MK, Lal R, Ebinger M (2006) Determining soil quality indicators by factor analysis. Soil and Tillage Research 87: 194-204.
-
Carter MR, Gregorich EG, Anderson DW, Doran JW, Janzen HH, et al. (1997) Concepts of soil quality and their significance. Soil quality for crop production and ecosystem health. Elsevier Science Publishers, Amsterdam, Netherlands 25: 1-19.
-
Heil D, Sposito G (1997) Chemical attributes and processes affecting soil quality. Gregorich, Soil quality for Crop Production and Ecosystem Health. Elsevier, Amsterdam 25: 59-79.
-
Eswaran H, Lal R, Reich PF (2001) Land degradation. An overview in Response to Land Degradation. Science Publishers, Enfield, NH, USA, 20-35.
-
Girmay G, Singh BR, Mitiku H, Borresen T, Lal R (2008) Carbon stocks in Ethiopian soils in relation to land use and soil management. Land Degradation and Development 19(4): 351-367.
-
Lal R, Sobecki TM, Iivari T, Kimble JM (2003) Soil Degradation in the United States. Extent, Severity and Trends, CRC Press, USA.
-
Warkentin BP (1995) The changing concept of soil quality. Journal of Soil and Water Conservation 50(3): 226-228.
-
Allmaras RR, Langdale GW, Unger PW, Dowdy RH, VanDoren DM (1991) Adoption of conservation tillage and associated planting systems. 53-84.
-
Edwards WM (1991) Soil structure: Processes and management 7-14.
-
USDA, United States Department of Agriculture. Soil Health Management Natural Resources Conservation Service Soils.
-
Shamsollah A, Farhad K (2008) Use of factor analysis to evaluate soil quality relation to land use change in Azadshar district, north of Iran.
-
ARIJ: Applied Research Institute of Jerusalem. Kharas town guide (2009)
-
Russell JR (1994) Description and Sampling of Contaminated Soils. A Field Guide. Lewis Publishers.
-
Ayoubi S, Khormali F, Sahrawat KL, Rodrigues AC (2011) Assessing Impacts of Land Use Change on Soil Quality Indicators in a Loessial Soil in Golestan Province, Iran. Journal of Agriculture and Science Technology 13(5): 727-742.
-
Frank D (2000) Activated Carbon Filtration. Water Quality Products Magazine.
- Enhancement of Vegetative Growth and Fruit Yield in Cucumber (Cucumis sativus L.) via Spiritual Blessing (Biofield) Energy Intervention
- Production of Açaí (Euterpe oleracea Mart.) under Different Agroforestry System Management Intensities in Amazonian Floodplain (Varzea) Forests
- Coffee and the Production Region: What is the Secret to the Expression "Quality"?
- Experiential Agripreneurship Training in Sub-Saharan Africa: Integrating a Business Incubator into Postgraduate Livestock Education at the University of Buea
- Advances in Agricultural High-Quality Development
- Linking Compost Residue to ABAGE in Plants - a Short Note