The Impact of Hydrosphere on Climate Change
The hydrosphere is the sum of all water on Earth and the water cycle that distributes it around the planet. Earth is unique in the solar system for its abundant surface waters. The hydrosphere comprises the combined mass of water that occurs on or near Earth’s surface. It includes oceans, lakes, rivers, and streams. Because it covers about 71 percent of Earth’s surface area, the hydrosphere plays a vital role in sustaining communities of water-inhabiting plants and animals. Many researchers stated that the human contributions to greenhouse gases in the atmosphere are warming the earth's surface a process that is projected to increase the evaporation of surface water and accelerate the hydrologic cycle. In turn, a warmer atmosphere can hold more water vapor. When the water body of the earth evaporates, the surroundings become cooled, as it condenses, water releases energy and warms its surroundings, it hydrates life on the planet and plays a role in the transfer of energy from terrestrial to aquatic systems. Therefore, according to the review, different authors from many countries analyzed that the main source of future global change is the warming of the hydrosphere.
Introduction
The processes and characteristics of the hydrosphere change through time in response to the internal dynamics of the climate system i.e. the chaotic dynamics of oceanographic and meteorological processes. In addition to this internal, natural variation, aspects of the hydrosphere also change in response to external climate change forcing, some of which are natural (e.g., changed solar insolation) and some of human origin (e.g., greenhouse gas forcing). This distinction between natural and anthropogenic forcing, which applies to all aspects of Earth’s climate system, is easy to draw in principle, but in practice, it has proved difficult to establish any specific changes documented in the hydrosphere over the past century have their origins in human activity. Near Earth’s surface, precipitation of water out of the atmosphere occurs mostly in the forms of rain and snow. Hail contributes locally when conditions of strong, upward motion and freezing at lower levels of the atmosphere occur within passing thunderstorms and result in the formation of ice balls and lumps. The Northern and Southern Hemisphere
monsoons are also precipitation-related phenomena, representing periods of particularly intense rainfall driven by strong, seasonal, wind-induced movements of moisture- laden air off the ocean and onto an adjacent landmass. At the same time, the patterns of evaporation that recycle water back to the atmosphere are heavily dependent upon both atmospheric and ocean temperature, which themselves vary in dynamic ways. Evaporation and precipitation are key processes that help determine the occurrence of rare meteorological events such as storm bursts, cyclones, and deluges that feed catastrophic (from the human perspective) flooding; alternatively, the absence of precipitation can lead to equally catastrophic dryings and droughts. In its 2007 report, the Intergovernmental Panel on Climate Change paid much attention to the possibility human greenhouse- induced warming would lead to an increase in either or both the number and severity of extreme meteorological events [1]. Subsequently, however, an IPCC expert working group has determined [2]. The earlier conclusions of update the Nongovernmental International Panel on Climate Change’s (NIPCC) summary of the scientific literature on global warming as it might affect the hydrosphere [3]. The analysis is presented in two parts, the first focusing on precipitation, monsoons, snow, and other hydrospheric phenomena, and the second on sea-level change, ocean heat, and ocean circulation.
Human contributions to greenhouse gases in the atmosphere are warming the earth’s surface - a process that is projected to increase evaporation of surface water and accelerate the hydrologic cycle. In turn, a warmer atmosphere can hold more water vapor. Some evidence suggests global warming is already responsible for more extreme precipitation events. Precipitation in a warming world is also projected to lead to departures from current timing and patterns of rainfall distribution. In recent years, with the significant global climate warming, the ice is melting, the global sea level is rising, and changes in the pattern of precipitation are bringing intense rainfall and floods to some areas and devastating droughts to others. Extreme high temperatures (>30°C) occurred in the Arctic in 2018. Satellite remote sensing and associated airborne and in-situ measurements have been crucial for advancing our understanding of the dynamics and impacts of changes in the hydrosphere. With these in mind, the main aim of this review was to report works done with a wide-ranging overview of the impact of the hydrosphere on climate change.
Methodology
This review paper was taken from different works of literature, books, websites, and scientific journals which are related to the impact of the hydrosphere on climate change.
Hydrosphere and Climate Change
Ecological Response of Ocean to Climate Change
Earth’s climate is not controlled solely by the atmosphere but also to a large degree by the heat stored in the ocean, which has a 3,300 times greater heat capacity than the atmosphere. With an average global circulation time of roughly 1,000 years, compared with one year for the atmosphere, changes in the release or uptake of ocean heat operate over the longer multidecadal, centennial, and millennial time scales associated with climate change, as opposed to weather variability. The exchange of ocean heat via currents and wind-enhanced ocean-atmosphere interactions drives weather at all scales of both space and time. In particular, repetitive weather patterns occur over the ocean itself and exercise far-reaching influence on adjacent landmasses. For example, the wet, warm winds that blow from the ocean to the continental interior in the Pacific Northwest of USA (Chinook wind, in original usage) can raise winter temperature from -20°C to more than +10°C and melt 30 cm or more of snow in a single day. Monsoon systems are another case in point, where seasonal differential heating of a landmass and its nearby ocean cause a reversal of winds from offshore to onshore at the start of the monsoon, often causing torrential rainfall deep into the continental interior. Despite its critical importance for climatic studies, we have a poor record of ocean heat observations, and it is only since the inception in 2004 of the Argo global network of more than 3,000 ocean profiling probes that we have an adequate estimate of ocean temperatures and heat budget Though Argo data are in their infancy and subject to adjustment for errors, early indications are that the oceans are currently cooling [4].
Shaviv NJ, et al. [5] explored some of the key issues relating to change in ocean heat as a driver of climate change, particularly in response to solar variations. He writes, “climatic variations synchronized with solar variations do exist, whether over the solar cycle or over longer time-scales,” citing numerous references. Nonetheless, many scientists decline to accept the logical derivative of this fact: Solar variations are driving climate changes. They say measured or reconstructed variations in total solar irradiance (TSI) seem too small to be capable of producing observed climate change. That concern can be addressed in two ways. The first is to observe that aspects of Earth-sun energy interrelations other than TSI are known to play a role, and perhaps a significant role, in climate change.
- Variations in the intensity of the Sun’s magnetic fields on cycles that include the Schwabe (11 years), Hale (22 years), and Gleissberg (70-90- year) periodicities.
- The effect of the sun’s plasma and electromagnetic fields on rates of Earth rotation, and therefore the length of day (LOD).
- The effect of the sun’s gravitational field through the 18.6year-long Lunar Nodal Cycle, which causes variations in atmospheric pressure, temperature, rainfall, sea level, and ocean temperature, especially at high latitudes.
- The known links between solar activity and monsoonal activity, or the phases of climate oscillations such as the Atlantic Multidecadal Oscillation, a 60-year-long cycle during which sea surface temperature varies ~0.2°C above and below the long-term average, with concomitant effects on Northern Hemisphere air temperature, rainfall and drought.
- Magnetic fields associated with solar flares, which modulate galactic cosmic ray input into Earth’s atmosphere and in turn may cause variations in the nucleation of low-level clouds at up to a few km high [6, 7]. This causes cooling, a 1 percent variation in low cloud cover producing a similar change in forcing (~4 W/m2) as the estimated increase caused by human greenhouse gases. This possible mechanism is controversial and is being tested in current experiments devised at the European Organization for Nuclear Research (CERN). But irrespective of the results of these experimental tests and the precise causal mechanism, Neff U, et al. [8] Ney EP, et al. [9] has provided evidence from paleoclimate records for a link between varying cosmic radiation and climate. Using samples from a speleothem from a cave in Oman, Middle East, they found a close correlation between radio-carbon production rates (driven by incoming cosmic radiation, which is solar modulated) and rainfall (as reflected in the geochemical signature of oxygen isotopes).
- The 1,500year-long Bond Cycle is probably also of solar origin, and another climate rhythm of similar length, the Dansgaard-Oeschger (D-O) cycle, occurs especially in North Atlantic glacial sediments deposited about 90,000-15,000 years ago.
A second way of resolving the too-weak-TSI dilemma would be the discovery of an amplification mechanism of the weak solar radiation signal. Shaviv NJ, et al. [5] makes a good case for the existence of such an amplifier. Shaviv NJ, et al. [5] used the oceans as a calorimeter with which to measure the radiative forcing variations associated with the solar cycle. He studied “three independent records: the net heat flux into the oceans over 5 decades, the sea-level change rate based on tide gauge records over the 20th century, and the sea surface temperature variations, each of which can be used independently to derive the oceanic heat flux.” Shaviv discovered large variations in oceanic heat content associated with the 11-year solar cycle. In addition, the datasets “consistently show that the oceans absorb and emit an order of magnitude more heat than could be expected from just the variations in the total solar irradiance.” This implies the existence of an amplification mechanism, although without pointing precisely to what that might be.
Ocean Circulation
The Cenozoic Palaeo-Ocean: The high specific heat of seawater makes ocean circulation the dominant mechanism for redistributing thermal energy within Earth’s climate system. Zachos J, et al. [10] Summarized the evolution of the global climate over the Cenozoic (last 65 million years) based on data obtained by the DSDP and ODP ocean drilling programs. Significant shifts in climate have been associated with major changes in ocean circulation. Major conclusions that can be drawn about ocean history from the supporting references cited in Zachos J, et al. [10] include the following:
- During the Eocene, the average temperature of the deep ocean declined by more than 7°C from ~12° C during the Eocene climatic optimum to ~4.5°C at the start of the Oligocene. This decline was associated with an increase in marine productivity, which had fallen after widespread benthic extinctions during the late Paleocene and early Eocene.
- The start of the Oligocene was associated with the opening of the Tasmania-Antarctica Passage between Australia and the Antarctic continents. This was associated with a reduction in the tropical linkages between the Pacific and Indian Oceans (strictly, their equivalents) north of Australia.
- During the Oligocene, the Drake Passage between South America and Antarctic continents opened, allowing water to circulate Antarctica and linking all the ocean basins. The change in ocean circulation due to the opening of the two passages was associated with the formation of an Antarctic ice cap and a further drop in deep ocean temperatures.
- The late Oligocene was marked by warming before temperatures fell during the Miocene.
- At the start of the Pliocene the Panama Seaway between the North and South America continents closed, removing the tropical linkage between the Pacific and Atlantic Oceans. The tropical through flow between the Pacific and Indian Oceans also was becoming more restricted. This resulted in the establishment of “modern” ocean circulation and is marked by the onset of Northern Hemisphere glaciation.
- The Pliocene and Pleistocene are characterized by glacial/interglacial climatic swings, suggesting the “modern” ocean circulation system makes Earth more sensitive to Milankovitch orbital cycles. Modern Ocean Circulation: In simple terms, atmospheric and oceanic circulation systems transport excess heat from the tropics to higher latitudes-from the Equator towards the Poles. However, ocean circulation is constrained by the configurations of ocean basins and the linkages between them. As discussed in the previous section, major changes in the basin linkages in the past have been associated with significant climatic shifts [10]. The current climate is, in part, a product of the modern system of ocean circulation. There are two main components of circulation: a surface system driven primarily by wind stress exerted by the atmosphere, and a subsurface system driven primarily by density differences associated with variations in temperature and salinity (thermohaline circulation). These two systems are linked by regions where water sinks (downwelling) and rises (upwelling) to provide a complete circulation system that eventually mixes the oceans (overturning). A popular simplification of the combined global overturning circulation is known as the Great Ocean Conveyor Belt, which emphasizes the down welling of water in the North Atlantic to drive the thermohaline circulation and the overall transport of water back into the North Atlantic by the surface circulation driving upwelling in the Indian and Pacific Oceans Broecker WS, et al. [11, 12] used this concept to argue global warming could trigger abrupt climate change by slowing or stopping the down welling of water in the North Atlantic. However, are unrealistic: the surface heat transport in the North Pacific is in the wrong direction, and the Indonesian through-flow is exaggerated. Schmitz WJ, et al. [13] presented a different version of the Great Ocean Con- veyor Belt summarizing the known circulation components and their volume transport rates. Although the ocean basins are linked by circulation around the Antarctic and some through-flow through the Arctic and the Indonesian Archipelago, it is evident there is also significant overturning circulation within each ocean basin. Schmitz WJ, et al. [13] refers to this basinal circulation as consisting of the meridional overturning. Atlantic Meridional Overturning Circulation: The Atlantic Meridional Overturning Circulation (AMOC) consists of a near-surface, warm northward flow in the Atlantic Ocean compensated by+ a colder southward return flow at depth [14]. A key feature is the transfer of heat to the atmosphere at high latitudes in the North Atlantic, which makes the northward-flowing surface waters saltier and cooler (denser), causing them to sink to considerable depths. Circulation cells.
Srokosz M, et al. [14] Provide a schematic illustration of the main flows of AMOC. Similar to the Great Ocean Conveyor Belt, this schematic oversimplifies the components of the circulation cell originally presented by Schmitz WJ, et al. [13], summarizes the major components of the circulation contributing to AMOC. The deeper thermohaline circulation is also driven by water sinking around Antarctica, which means the strength of the circulation is not solely a function of the formation of dense water in the North Atlantic. There is multiple flow paths at different depths, meaning there are many different lags associated with the circulation of water masses within the system. Baehr J, et al. [15] Used modeling to assess how quickly changes in the North Atlantic meridional overturning circulation (MOC) might flow through into consequential climate change. Simulated observations were projected onto a time-independent spatial pattern of natural variability. This variability was derived by regressing the zonal density gradient along 26°N against the strength of the MOC at 26°N, within a model-based control climate simulation. The resultant pattern was compared against observed anomalies found between the 1957 and 2004 hydrographic occupations of this latitudinal section.
The modeling revealed Atlantic MOC changes could be detected with 95% reliability after about 30 years, manifest by changes in zonal density gradients obtained from a recently deployed monitoring array. In terms of potential past changes, Baehr J, et al. [16] found “for the five hydrographic occupations of the 26°Ntransect, none of the analyzed depth ranges shows a significant trend between 1957 and 2004, implying that there was no MOC trend over the past 50 years.” This finding demonstrates the mild late- twentieth-century warming that so alarms the IPCC has not resulted in any observable change in the North Atlantic MOC. In turn, this suggests the North Atlantic MOC is not nearly as sensitive to global warming as many climate models suggest. In a second paper addressing North Atlantic deep water formation and circulation, Vage K, et al. [17] write, “in response to global warming, most climate models predict a decline in the Meridional Overturning Circulation, often due to a reduction of Labrador Sea Water,” noting “since the mid- 1990s, convection in the Labrador Sea has been shallow- and at times nearly absent.” Vage K, et al. [17] paper uses Argo data, supplemented by satellite and reanalysis data, to document a return of deep convection to the subpolar gyre in both the Labrador and Irminger seas in the winter of 2007- 2008. Winter mixing was observed to depths of 1,800 m in the Labrador Sea, 1,000 m in the Irminger Sea, and 1,600 m south of Greenland, whereas base-period (the winters of 2001-2006) mixing depths were less than 1,000m. By analyzing heat flux components, Vage K, et al. [17]. Determined the main cause of the enhanced heat flux and deep mixing was unusually cold air temperatures during the 2007-2008 winters. Moreover, the cooling was not merely a local phenomenon; the global temperature dropped 0.45°C between the winters of 2006-2007 and 2007-2008 [14]. Provide a review of available research on AMOC and associated climatic variations. They highlight how poorly understood the system is; the lack of key time-series data, particularly for the deeper components of AMOC; and the poor predictive abilities of computer models. From the available data, they demonstrate the recent behavior of AMOC has been surprising and unexplainable. They conclude AMOC plays a major role in climate changes, there is an urgent need for better observational data, and the behavior and potential predictability of the system needs further study Figure 1.
Shut-down of Arctic Ocean’s Thermohaline Circulation: To assess whether enhanced freshwater delivery to the Arctic Ocean by increased river flow could shut down the ocean’s thermohaline circulation, Peterson BJ, et al. [18] plotted annual values of the combined discharge of the six largest Eurasian Arctic rivers-Yenisey, Lena, Ob’, Pechora, Kolyma, and Severnaya Dvina, which drain about two-thirds of the Eurasian Arctic landmass-against the globe’s mean annual surface air temperature (SAT). They determined a simple linear regression trend through the data and concluded the combined discharge of the six rivers rises by about 212 km3/year in response to a 1°C increase in mean global air temperature. For the high-end global warming predicted by the Intergovernmental Panel on Climate Change (IPCC) to occur by AD 2100-i.e., a temperature increase of 5.8°C-they projected the warming-induced increase in freshwater discharge from the six rivers could rise by as much as 1,260 km3/year (we calculate 5.8°C x 212 km3/year/°C = 1230 km3/year), a 70 percent increase over the mean discharge rate of the past several years. It has been hypothesized that the delivery of such a large addition of freshwater to the North Atlantic Ocean may slow or even stop that location’s production of new deep water, which constitutes one of the driving forces of the thermohaline circulation, the great oceanic “conveyor belt.” Although still discussed, this scenario is not as highly regarded today as it was when Peterson, et al. conducted their research, for several reasons. For one, it is difficult to accept the tremendous extrapolation Peterson BJ, et al. [18] make in extending their Arctic freshwater discharge vs. SAT relationship to the great length implied by the IPCC’s predicted high-end warming of 5.8°Cover the remainder of the current century. According to Peterson, et al., “throughout the discharge record, global SAT increased by 0.4°C.” It is implausible to extend the relationship they derived for that small temperature increase fully 14-and- a-half times further, to 5.8°C. Consider also the Eurasian river discharge anomaly vs. global SAT plot of Peterson et al which we have re-plotted in enclosing their data with simple straight-line upper and lower bounds, it can be seen the upper bound of the data does not change over the entire range of global SAT variability, suggesting the upper bound corresponds to a maximum Eurasian river discharge rate that cannot be exceeded in the real world under its current geographic and climatic configuration. The lower bound, by contrast, rises so rapidly with increasing global SAT that the two bounds intersect less than two-tenths of a degree above the warmest of Peterson et al.’s 63 data points, suggesting 0.2°C beyond the temperature of their warmest data point may be as far as any relationship derived from their data may be validly extrapolated.
Sea-level Change
Sea-level rise is one of the most feared impacts of any future global warming [17]. But public discussion of the problem is beset by poor data, misleading analysis, and an overreliance on computer model projections, leading to unnecessary alarm. A proper understanding of the risks associated with sea-level change can be attained only by maintaining a clear distinction between changes in global sea level (often also called eustatic sea level) and changes in local relative sea level. Sea-level changes are measured relative to a defined reference level, or datum. This datum is difficult to define over regional and global scales because Earth’s surface is not static; it deforms at different rates and scales in different places. At any one time, the sum of such dynamics controls the volume of the global ocean basin and, therefore, for a fixed volume of seawater, dictates the average sea level worldwide. At the same time, and because both the dynamic Earth surface and the volume of seawater change through time, in combination; they also control the multiplicity of local rates of sea-level change we observe.
The possibility of large and damaging sea-level rises caused by human-related global warming features prominently in presentations by those who call for urgent action to “stop” global warming, such as former U.S. Vice President. Past sea-level positions are measured or inferred from geological evidence. Factual observations regarding modern sea level and its change are traditionally made using tide gauges. Since the early 1990s, the modern sea level also has been measurable independently by radar-ranging from satellites. When data from these sources are analyzed, rates of sea- level change, either rises or falls, are found to vary through time and space (geography), and often quite dramatically over geological time scales.
Ecological Responses of Lakes to Climate Change
Lakes around the world are warming at a rapid rate, as documented recently in a survey of 235 lakes O’Reilly CM, et al. [19]; Sharma S, et al. [20] showed an increase in the mean surface temperature by 0.34OC per decade between 1985 and 2009. Less is known about the warming that has occurred in water deeper under the lake surface, where a larger percentage of organisms occur. In this special issue, [21] quantified changes in water column temperatures and thermal stratification in 231 lakes in North America over the period 1975 to 2012. The dataset included lakes varying in their mixing regime, size, trophic state, and geomorphology. On average, the lakes displayed an increase in water temperature near the surface, as also observed by O’Reilly CM, et al. [19] in a global lake assessment and most lakes displayed an increase in the strength of thermal stratification. On average, surface waters warmed 1.7 times faster than corresponding air temperatures at the lakes. Lakes with high water transparency (Secchi disk depth >5m) had greater warming of surface waters and greater increases in stratification than lakes with lower transparency. Polymictic lakes displayed the greatest increase in warming throughout their water columns. The mean change in deep water temperature, the major new focus of this study, was not significantly different from zero. Approximately half of the lakes warmed and half cooled during the period of record. Likewise, a study of 20 Danish lakes revealed warming in the surface water of ca. 2OC per year and a simultaneous cooling of deep water by ca. 1OC over the period 1989 to 2006 [22]. Certain characteristics were linked to how lakes in North America changed over time. Distance of the lakes to the coastline was the most important explanatory variable; that is, coastal lakes cooled and inland lakes warmed in their deeper waters. Elevation, shading by vegetation, duration of ice cover, the input of ground water, and other factors may have contributed to the trend in deep water temperature changes observed. Two particularly important findings of this study were that lakes are an important sentinel of global warming due to their more rapid temperature increase than the overlying atmosphere [23]; and that there is considerable variability in lake response to climate change [24], implying that intensive studies of just prominent lakes will not suffice to understand how lakes, in general, will change in future decades. In addition to long-term synoptic assessment, an approach that is likely to become important to projecting the future of lake thermal properties in a warming world is coupled modeling. In this special issue, used a model that can simulate hydrological and thermal responses of water bodies to warming [25], and coupled it with output from the Coupled Model Inter-Comparison Project Phase 5 (CMIP5) Global Circulation Models (GCMs). They evaluated the projected effects of three future climate scenarios on the Fourche River, Quebec, Canada. The hydrologic model predicted that under these three scenarios, of global warming by 1.0, 1.8, and 3.7OC by 2100, the river will experience an increase in water temperature between 0.2 and 0.7OC in June and between 0.2 and 1.1OC in September. It is noteworthy that the Fourchue River is a coastal ecosystem and, as such, warming by a lesser amount than occurs in the atmosphere is consistent with the findings of the first paper in this issue by Richardson DC, et al. [21]. The model predictions have ecological and management implications for the river system. This river is a critical habitat for brook trout (Salvelinus fontinalis) and the predicted increases in temperature could be favorable to growth. However, the model results also indicated that there will be several days in the summer when temperatures exceed the upper incipient lethal temperature for this species and that might require releases of cold water from the reservoir into the river to prevent fish mortality.
Rivers and Stream Flow
Model projections suggest CO2-induced global warming may induce large changes in global stream flow characteristics, which has led many authors and the IPCC to claim to warm will lead to the intensification of the hydrological cycle and the occurrence of more floods [26, 27, 28]. Accordingly, many scientists have examined stream flow, or proxy stream flow records to elucidate these claimed relationships. On the assumption that global runoff represents an integrated response to continental hydrological dynamics, some authors invert the reasoning and use changes in hydrology as an indicator of global warming [29, 30]. These matters relate to forecasts of precipitation variability, floods, and droughts, issues also addressed in this chapter. In a pivotal study of this relationship that formed part of the World Climate Program supported by UNESCO and the WMO, [31] analyzed long- term and high-quality data on stream flow to determine whether floods have increased worldwide, as predicted by climate models. They concluded, “the analysis of 195 long time series of annual maximum flows, stemming from the GRDC holdings does not support the hypothesis of the general growth of flood flows. Observations to date provide no conclusive and general proof as to how climate change affects flood behavior. There is a discontinuity between some observations made so far. Increases in flood maxima are not evident whilst model-based projections show a clear increase in intense precipitation.” Milliman JD, et al. [30] examined discharge trends over the second half of the twentieth century for 137 rivers whose combined drainage basins represent about 55 percent of the world land area. They found “between 1951 and 2000 cumulative discharge for the 137 rivers remained statistically unchanged,” as did global on-land precipitation over the same period and also estimated global runoff for the period 1993-2009, using two methods both of which were derived by coupling modeled land-atmosphere and ocean-atmosphere water budgets with independent datasets to estimate water storage variations in several water budget compartments. The datasets included atmospheric reanalyzes, land surface models, satellite altimetry, and direct ocean temperature measurements. The results of both sets of calculations of global runoff correlate well for the full period 1993-2006. The researchers found “no significant trend … over the whole period” for either method of calculation. They conclude, “An intensification of the global water cycle due to global warming is not obvious over the last two decades.”
Dam Storage and Groundwater Depletion
Two human on-land development practices can have a material effect on sea level: the building of dams and reservoirs, which withhold water that would otherwise have flowed to the ocean; and the extraction of groundwater, which, after use, contributes water to the ocean that otherwise would have remained stored on the continent. The net freshwater run-off is thereby altered, with the first practice acting to lower sea level and the second practice helping to raise it. Though they act in opposite directions and are small in the natural scheme of things, these effects are not entirely negligible recently summarized the situation concerning groundwater removal by compiling the first comprehensive aquifer-based estimate of changes in groundwater storage using direct volumetric accounting [32, 33, 34, 35, 36, 37]. Konikow then compared the groundwater depletion results he obtained with sea-level rise observations. Konikow established groundwater depletion over the period 1900-2008 was about 4,500 km3, equivalent to a global sea-level rise of 12.6mm, or just over 6 percent of the total observed rise. Perhaps not surprisingly, the rate of groundwater depletion has increased markedly since about 1950, with maximum rates occurring during the most recent period (2000- 2008), when extraction averaged ~145 km3/year. The average rate of sea- level rise over the twentieth century was 1.8 ± 0.5 mm/year; Konikow’s work suggests on average 0.12 mm/year of this rise may have resulted from additional groundwater runoff.
Hydrological Cycle
The hydrological cycle describes the continuous circulation of water between the ocean, atmosphere, and land. Water is transferred through physical processes like evapotranspiration, precipitation, infiltration, and river runoff. This circle from one reservoir to another involves energy exchange in terms of heat transfer, solar radiation, and gravitational potential energy. During these processes, water can change its aggregation state (liquid, vapor, or ice) at various times. Hydrological processes encompass a variety of spatial and temporal scales. At the river catchment scale, the hydrological cycle comprises precipitation as major input, various transfer processes, different storages, and outputs. They are referred to by hydrologists as components of the water balance [38].
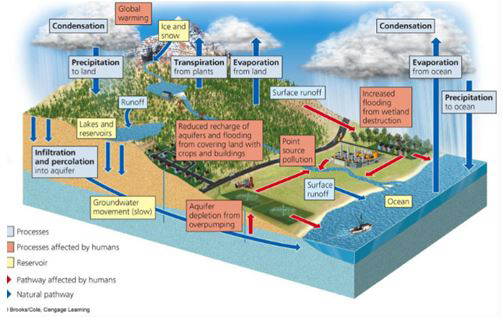
Figure.2: Hydrological cycle
Precipitation: All forms of precipitation are dynamic, occurring or not occurring in response to changing atmospheric conditions (especially heat and water vapor) on a minute-by-minute, hourly, daily, weekly, or seasonal basis. Regarding the potential effect of global warming on these patterns, Huntington TG, et al. [27] has noted there is “a theoretical expectation that climate warming will result in increases in evaporation and precipitation, leading to the hypothesis that one of the major consequences will be an intensification (or acceleration) of the water cycle [39, 40, 41].” In reviewing the scientific literature on recent patterns of precipitation, Huntington concluded on a globally averaged basis, precipitation over land had indeed increased by about 2 percent over the period 1900-1998. In keeping with this result, model predictions of CO2-induced global warming often suggest warming should be accompanied by increases in rainfall [42]. For example, state, after the Arctic Climate Impact Assessment (2005) [43], “warming is predicted to enhance atmospheric moisture storage resulting in increased net precipitation.” Rahmstorf S, et al. [44] noted “both theoretical arguments and models suggest that net high-latitude precipitation increases in proportion to increases in mean hemispheric temperature” citing [45]. Similarly, Kunkel (2003) says “several studies have argued that increasing greenhouse gas concentrations will increase heavy precipitation [46, 47, 48].” To date, global circulation models (GCMs) have failed to accurately reproduce observed patterns and totals of precipitation [49]. Analyzed the changes in tropical Australian climate projected by 19 CMIP3 coupled models for the IPCC’s A2 scenario over the twenty-first century. While equatorial regions to the north of Australia are projected to have increased precipitation during austral summer (December to February) by the end of the twenty-first century, there is no significant change over northern Australia itself, based on the model ensemble mean. There is a large spread in model simulations of precipitation change, with both large positive and negative anomalies. The ensemble means a change in the seasonal cycle of precipitation over tropical Australia is nonetheless small, with precipitation increasing during March and April, suggesting a prolonged Australian wet season. No model consensus exists on how inter annual variability of tropical Australian precipitation will change in the future, although more models simulate increased variability than decreased. Correlations between full wet season (October to April) precipitation and austral spring (September to November) NINO 3.4 sea surface temperature anomalies show a slight weakening. The spread in projected precipitation seasonal cycle changes between simulations from the same model is larger than the inter-model range, indicating large internal or natural variability in tropical Australian precipitation relative to the climate change signal. Zonal wind changes indicate an intensification of austral summer low-level westerlies combined with a weakening of upper easterlies. Low-level westerlies also persist for longer periods, consistent with a delay in the monsoon retreat. All models simulate an increase in the land-ocean temperature contrast in austral summer, with a significant correlation between changes in land-ocean temperature contrast in the pre-monsoon (austral spring) and summer precipitation changes. Analysis of precipitation changes using regime-sorting techniques shows offsetting tendencies from thermodynamic changes associated with enhanced atmospheric moisture and dynamic changes associated with a weakened atmospheric circulation. We are thus confronted with a dilemma: Although the theoretical expectation, supported by modeling, is that global warming should result in enhanced atmospheric moisture, empirical results often show otherwise. Many scientists are now examining historical precipitation records to determine how temperature changes of the past have affected Earth’s hydrologic cycle.
Evaporation: Evaporation is the primary source of atmospheric water vapor, a powerful greenhouse gas, and so is of particular interest to climate scientists [26]. Notes direct measurements of evaporation (pan evaporation) show a reduction in evaporation over the twentieth century, whereas indirect estimates suggest an increase [50]. Linked a reduction in pan evaporation rates to a reduction in insolation (solar dimming) at ground level due to increasing cloud cover and atmospheric aerosols. Subsequently, [51] calculated a reduction of 4.8 W/m2 for Australia as driving the observed reduction in pan evaporation. The Australian results are extended to the global behavior by Roderick ML, et al. [52], where a global reduction in pan evaporation is attributed to a combination of wind stilling and solar dimming. The authors also observe the interpretation of pan evaporation depends on whether the observations are from water-limited or energy-limited sites. For energy-limited sites, evaporation occurs at the maximum rate possible for the radiative flux present, and declining pan evaporation also indicates declining evapotranspiration. For water-limited sites, evaporation is restricted by the available water, and evapotranspiration depends on the supply of precipitation. Therefore, Roderick ML, et al. [52] Argue evapotranspiration can rise while pan evaporation decreases if the supply of precipitation increases sufficiently. This implies dry areas are getting wetter. Recognizing the importance of near- surface wind speed for evaporation, Roderick ML, et al. [52] noted the “occurrence of widespread declining trends of wind speed measured by terrestrial anemometers at many mid-latitude sites over the last 30-50 years,” citing papers by Mcvicar TR, et al. [53]; Jiang Y, et al. [54]; Beniston M, et al. [55]. Such a change, now widely termed “stilling,” will be a key factor in reducing the atmospheric demand that drives actual evapotranspiration when water availability is not limited, as in the case of lakes and rivers. In addition, Mcvicar TR, et al. [53] note near-surface wind speed (u) nearly always increases as land-surface elevation (z) increases (as demonstrated by Jiang Y, et al. [54]. Increasing wind speeds, they point out, lead to increases in atmospheric evaporative demand, and decreasing wind speeds do the opposite. These changes are significant for people who depend on water resources derived from mountainous headwater catchments: More than half the world’s population lives in catchments with rivers originating in mountainous regions [56], and this water supports about 25 percent of the global gross domestic product. Defining uz as a change in wind speed with elevation change-that is, uz = Δu/Δz, where Δu = u2- u1, Δz = z2-z1, and z2 > z1-McVicar et al. calculated monthly averages of uz, using 1960-2010 monthly average u data from low-set (10-meter) anemometers maintained by the Chinese Bureau of Meteorology at 82 sites in central China, and by MeteoSwiss at 37 sites in Switzerland. They suggest their research constitutes “the first time that long-term trends in uz in mountainous regions have been calculated,” and their uz trend results show u to have declined more rapidly at higher than at lower elevations in both study areas. The double benefit of a decline in wind speed at many mid- latitude sites and a further decline in wind speed at higher elevations should act to reduce water loss via evaporation from high-altitude catchments in many of the world’s mountainous regions, thus providing more water for people who obtain it from those sources. As Mcvicar TR, et al. [53] note, the “reductions in wind speed will serve to reduce rates of actual evapotranspiration partially compensating for increases in actual evapotranspiration due to increasing air temperatures.” Some papers in the literature [57], and also the published IPCC fourth and draft fifth Assessment Reports, confuse the causal physics of the relationship between temperature and evapotranspiration by assuming increasing temperature causes drought. In reality, when incoming radiation falls on a moist surface this energy is partitioned into evapotranspiration (latent heat) and heating of the near-surface/atmosphere (sensible heat). During drought, where moisture is limited, less of the incoming energy can be used for latent heat (i.e., reduced evapotranspiration) and consequently more sensible heat occurs. The consequence is that air temperatures raise as evapotranspiration is reduced [58].
Snowfall Avalanches
On March 20, 2000, a British newspaper reported “Snowfalls are just a thing of the past” based on statements by a member of the Climatic Research Unit of the University of East Anglia, who claimed within a few years snowfall will become “a very rare and exciting event” and “children just aren’t going to know what snow is.” The U.K.’s Hadley Centre for Climate Prediction and Research said eventually British children would have only a “virtual” experience of snow via movies and the Internet. A model developed at the U.S. National Oceanic and Atmospheric Administration (NOAA) published in the Journal of Climate projected the majority of the planet would experience less snowfall as a result of global warming due to increasing atmospheric CO2. The predicted decline in snowfall was expected to cause serious problems for ski resorts and areas in the western United States that rely on snowmelt as a source of fresh water. Oregon and Washington would get less than half their usual amount of snow. In June 2013, more than 100 ski resorts, concerning global warming would reduce snowfall and curtail skiing, joined the Business for Innovative Climate and Energy Policy Climate Declaration urging Americans to “use less electricity,” “drive a more efficient car,” and choose “clean energy” to combat climate change and save their ski resorts. The 2007 report of the IPCC warns of a difficult future for the industry: “…snow cover area is projected to contract mountainous areas will face glacier retreat, reduced snow cover and winter tourism shifting of ski slopes to higher altitudes.” And yet, three of the top five snowiest winters in the Northern Hemisphere on record have occurred in the past five years. In related research, examined the hypothesis that global warming might cause a dangerous increase in the number of snow avalanches in the French Alps. Because avalanches are mainly governed by temperature fluctuations in combination with heavy snow and strong wind regimes, and the IPCC have deemed it likely they will be strongly influenced by climatic fluctuations.
Analyzed snow avalanches using data from the Enquete Permanente Sur Les Avalanches- EPA, a chronicle that describes avalanche events on approximately 5,000 determined paths in the French Alps and the Pyrenees. Eckert et al. found no strong changes in mean avalanche activity or the number of winters of low or high activity over the last 60 years of record. Similar results have been reported from the Swiss Alps for the second half of the twentieth century by Schneebeli M, et al. [59] and by other researchers, including Bader S, et al. [60]; Eckert N, et al. [61]; Jomelli V, et al. [62] who reports no change in extreme snowfalls and catastrophic avalanches around Davos, Switzerland during the twentieth century. Jomelli V, et al. [63] Found “no correlation between the fluctuations in avalanche activity between 1978 and 2003 and large-scale atmospheric patterns” in the Maurienne Valley in France, Lombard A, et al. [64] suggest avalanche magnitude at low altitudes has declined since 1650 in the Massif des Ecrins in the French Alps.
Thermosteric
Briffa KR, et al. [65] used the global ocean temperature data to investigate the thermostatic, or temperature- induced, sea-level change of the past 50 years. A net rise in sea level occurred over the full half-century period but superimposed on that are marked decadal oscillations that represent ocean-atmosphere climatic perturbations such as the El Niño-Southern Oscillation, Pacific Decadal Oscillation, and North Atlantic Oscillation. Recognized these as thermostatic trends over 10year windows that showed large fluctuations in time, with positive values (in the range of 1 to 1.5 mm/year for the decade centered on 1970) and negative values (-1 to -1.5 mm/year for the decade centered on 1980). The record shows only an overall trend because it began at the bottom of a trough and ended at the top of a peak. In between these two points, there were both higher and lower values, so one cannot be sure what would be implied if earlier data were available or what will be implied as more data are acquired. Lombard et al. noted similar sea-level trends that occur in TOPEX/Poseidon altimetry over 1993-2003 are “mainly caused by thermal expansion” and thus probably not a permanent feature. They conclude, “We simply cannot extrapolate sea level into the past or the future using satellite altimetry alone.” If even the 50 years of global ocean temperature data we possess are insufficient to identify accurately the degree of global warming and related sea-level rise that has occurred over the past half-century, it will be many decades before satellite altimetry can identify a real climatic trend.
Drought
Even a moderate drought can have devastating effects on regional agriculture, water resources, and the environment. Many climate scientists and agriculturists have expressed growing concern about the worldwide drying of land areas and increasing evapotranspiration, which they attribute to man-induced global warming. Some recent peer-reviewed studies suggest the severity and length of droughts are increasing in various regions due to global warming [66, 67]. But in the United States, droughts have become shorter, less frequent, less severe, and less widespread over the past century, peaking during the Dust Bowl era of the 1930s, as clearly evidenced by the heat wave index for the period 1895-2008. Drought represents moisture deficit and therefore is an end-member of the precipitation spectrum. Many of the papers discussed earlier have referred to the issue. Providing a long-term perspective of the climate cycle that stretches from the Medieval Warm Period to the late twentieth-century warming [68]. Developed diatom-based proxy records for sediment cores from six lakes that provide a 250-km transect of the Winnipeg River Drainage Basin of northwest Ontario, Canada. The study was intended to address concerns that droughts similar to, or more extreme than, the 1930s Dust Bowl drought are a likely outcome of human-forced global warming and could perhaps last for several decades to centuries [69, 70]. A consequence of such droughts is decreased lake levels and river flows Cook ER, et al. [68] reported a synchronous change had occurred across all of the six lakes, indicating “a period of prolonged aridity” during the Medieval Warm Period (c. 900-1400 AD). The general coincidence in the time of this event at the six sites suggests an extrinsic climate forcing of natural origin [71, 72]. A parallel study by Williams JW, et al. [73] of five topographically closed lakes in Nebraska “indicated relative (climate) coherency over the last 4000 years, particularly during the MCA [Medieval Climate Anomaly] with all lakes indicating a lake-level decline.” 73 also report “in Minnesota, sand deposits in Mina Lake indicate large declines in lake level during the 1300s higheolian deposition occurred from ~1280 to 1410 AD in Lake, [74] and δ18O from calcite indicated an arid period from ~1100 to 1400 AD in Steel Lake.” They note, “in Manitoba, the cellulose δ18O record from the southern basin of Lake Winnipeg indicated severe dry conditions between 1180 and 1230 AD, and a less severe dry period from 1320 to 1340 AD [75]” and relatively warm conditions during the Medieval Warm Period “have been inferred from pollen records in the central boreal region of Canada and Wisconsin” [76, 77, 78].” In a study of drought in the global context over the past 60 years, [79] utilize datasets on temperature, precipitation, and surface energy parameters (wind, specific humidity, etc.) to calculate the standard Palmer Drought Severity Index (PDSI) using two different equations. The PDSI- TH (Thornwaite formulation of evapotranspiration) and PDSI-PM (Penman-Montheith formulation) differ in that the TH model estimates evapotranspiration based on air temperature (a proxy for potential evapotranspiration, not because of causal physics), whereas PM offers a more physically based evapotranspiration formulation, where the temperature is utilized only to calculate near-surface atmosphere humidity deficit. The TH model implicitly assumes no trend in air temperatures over the long term. The PDSI-TH approach overestimates evapotranspiration as long-term trends in temperature are apparent. The PDSI- PM equation does not respond to the temperature trend, as the temperature is only an indirect variable. Both the older, conventional index (PDSI-TH) and the newer index (PDSI- PM) show an increase in drought over recent years, though the trend for the latter was not significant [80].
Summary and Conclusion
The hydrosphere comprises the combined mass of water that occurs on or near Earth’s surface. It includes oceans, seas, lakes, rivers, streams, and precipitation. Because it covers about 71 percent of Earth’s surface area, the hydrosphere plays a vital role in sustaining communities of water-inhabiting plants and animals. Frist, the earth’s climate is not controlled solely by the atmosphere but also to a large degree by the heat stored in the ocean, which has a 3,300 times greater heat capacity than the atmosphere. The exchange of ocean heat via currents and wind-enhanced ocean-atmosphere interactions drive weather at all scales of both space and time. In particular, repetitive weather patterns occur over the ocean itself and exercise far-reaching influence on adjacent landmasses. For example, the wet, warm winds that blow from the ocean to the continental interior in the Pacific Northwest of USA (Chinook wind, in original usage) can raise winter temperature from -20°C to more than +10°C and melt 30 cm or more of snow in a single day.
Second, the high specific heat of seawater makes ocean circulation the dominant mechanism for redistributing thermal energy within Earth’s climate system. In simple terms, atmospheric and oceanic circulation systems transport excess heat from the tropics to higher latitudes-from the Equator towards the Poles. However, ocean circulation is constrained by the configurations of ocean basins and the linkages between them. Sea-level rise is one of the most feared impacts of any future global warming and Lakes around the world are warming at a rapid rate. On average, surface waters warmed 1.7 times faster than corresponding air temperatures at the lakes because of Lakes with high water transparency. Third, the hydrological cycle describes the continuous circulation of water between the ocean, atmosphere, and land. Water is transferred through physical processes like evapotranspiration, precipitation, infiltration, and river runoff. This circle from one reservoir to another involves energy exchange in terms of heat transfer, solar radiation, and gravitational potential energy. During these processes, water can change its aggregation state various times. All forms of precipitation are dynamic, occurring or not occurring in response to changing atmospheric conditions (especially heat and water vapor) on a minute- by-minute, hourly, daily, weekly, or seasonal basis. Lastly, the future impacts of global warming on agriculture and water resources due to the warming of the hydrosphere.
Acknowledgments
The authors would like to thank Dr. Demelash Kefalew for his advice and guidance in the entire scientific paper writing.
Conflict of Interest
The author declares that the paper was reviewed in the absence of any commercial or financial relationships that could be construed as a potential conflict of interest.
References
-
IPCC (2007) Climate Change 2007: The Physical Science Basis. Contribution of Working Group I to the Fourth Assessment Report of the Intergovernmental Panel on Climate Change. Solomon, S., et al. (Eds.) Cambridge, UK: Cambridge University Press.
-
IPCC (2012) Special Report on Managing the Risks of Extreme Events and Disasters to Advance Climate Change Adaptation (SREX). http://ipcc-wg2.gov/SREX/ report/.
-
Idso CD, Singer SF (2009) Climate Change Reconsidered: 2009 Report of the Nongovernmental International Panel on Climate Change (NIPCC). Chicago, IL: The Heartland Institute.
-
Loehle C (2009) Cooling of the global ocean since 2003. Energy and Environment 20(1): 101-104.
-
Shaviv NJ (2008) Using the oceans as a calorimeter to quantify the solar radiative forcing. Journal of Geophysical Research 113(A11): 10.
-
Dickinson RE (1975) Solar variability and the lower atmosphere. Bulletin of the American rological Society 56(12): 1240-1248.
-
Svensmark H (1998) Influence of cosmic rays on earth’s climate. Physical Review Letters 81: 5027-5030.
-
Neff U, Burns SJ, Mangini A, Mudelsee M, Fleitmann D, et al. (2001) Strong coherence between solar variability and the monsoon in Oman between 9 and 6 kyr ago. Nature 411: 290-293.
-
Ney EP (1959) Cosmic radiation and weather. Nature 183: 451-452.
-
Zachos J, Pagani M, Sloan L, Thomas E, Billups K (2001) Trends, rhythms, and aberrations in global climate 65 ma to present. Science 292(5517): 686-693.
-
Broecker WS (1991) The great ocean conveyor. Oceanography 4: 79-89.
-
Broecker WS (1997) Thermohaline circulation, the Achilles heel of our climate system: Will man-made CO2 upset the current balance? Science 278(5343): 1582- 1588.
-
Schmitz WJ (1996) On the World Ocean Circulation: Volume II—The Pacific and Indian Oceans / A Global Update. Technical Report, Woods Hole Oceanographic Institution, pp: 245.
-
Srokosz M, Baringer M, Bryden H, Cunningham S, Delworth T, et al. (2012) Past, present, and future changes in the Atlantic Meridional Overturning Circulation. Bulletin of the American Meteorological Society 93(11): 1663-1676.
-
Baehr J, Haak H, Alderson S, Cunningham SA, Jungclaus JH, et al. (2007) Timely detection of changes in the meridional overturning circulation at 26°N in the Atlantic. Journal of Climate 20(23): 5827-5841.
-
Baehr J, Keller K, Marotzke J (2008) Detecting potential changes in the meridional overturning circulation at 26°N in the Atlantic. Climatic Change 91: 11-27.
-
Vage K, Pickart RS, Thierry V, Reverdin G, Lee CM, et al. (2008) Surprising return of deep convection to the subpolar North Atlantic Ocean in winter 2007–2008. Nature Geoscience 2: 67-72.
-
Peterson BJ, Holmes RM, McClelland JW, Vorosmarty CJ, Lammers RB, et al. (2002) Increasing river discharge to the Arctic Ocean. Science 298(5601): 2171- 2173.
-
O Reilly CM, Sharma S, Gray DK, Hampton SE, Read JS, et al. (2015) Rapid and highly variable warming of lake surface waters around the globe. Geophys Res Lett 42(24): 10,773-10,781.
-
Sharma S, Gray DK, Read JS, O Reilly CM, Schneider P, et al. (2015) A global database of lake surface temperatures collected by in situ and satellite methods from 1985 to 2009. Sci Data 2: 150008.
-
Richardson DC, Melles SJ, Pilla RM, Hetherington AL, Knoll LB, et al. (2017) Transparency, geomorphology and mixing regime explain variability in trends in lake temperature and stratification across northeastern North America (1975–2014). Water 9(6): 442.
-
Jeppesen E, Søndergaard M, Lauridsen TL, Liboriussen L, Bjerring R, et al. (2012) Recent climate induced changes in freshwaters in Denmark. In Climatic Change and Global Warming of Inland Waters: Impacts and Mitigation for Ecosystems and Societies.
-
Jackson LJ, Lauridsen TL, Søndergaard M, Jeppesen E (2007) A comparison of shallow Danish and Canadian lakes and implications for climate change. Freshw Biol 52(9): 1782-1792.
-
Kosten S, Huszar VLM, Becares E, Costs LS, van Donk E, et al. (2012) Warmer climates boost cyanobacterial dominance in shallow lakes. Glob Chang Biol 18(1): 118- 126.
-
Kwak J, St Hilaire A, Chebana F, Kim G (2017) Summer season water temperature modeling under the climate change: A case study for Fourchue River, Quebec, Canada. Water 9(5): 346.
-
Labat D (2004) Evidence for global runoff increase related to climate warming. Advances in Water Resources 27(6): 631-642.
-
Huntington TG (2006) Evidence for intensification of the global water cycle: Review and synthesis. Journal of Hydrology 319(4): 83-95.
-
Dai A, Qian TT, Trenberth KE, Milliman JD (2009) Changes in continental freshwater discharge from 1948 to 2004. Journal of Climate 22(10): 2773-2792.
-
Nilsson C, Reidy C, Dynesius M, Revenga C (2005) Fragmentation and flow regulation of the world’s large river systems. Science 308(5720): 405-408.
-
Milliman JD, Farnsworth KL, Jones PD, Xu KH, Smith LC (2008) Climatic and anthropogenic factors affecting river discharge to the global ocean, 1951-2000. Global and Planetary Change 62(3-4): 187-194.
-
Kundzewicz ZW (2004) Detection of change in worldwide hydrological time series of maximum annual flow. World Climate Programme-Water, UNESCO-WMO.
-
Sahagian DL, Schwartz FW, Jacobs DK (1994) Direct anthropogenic contributions to sea level rise in the twentieth century. Nature 367: 54-57.
-
Gornitz V, Rosenzweig C, Hillel D (1997) Effects of anthropogenic intervention in the land hydrologic cycle on global sea-level rise. Global and Planetary Change 14(3-4): 147-161.
-
Konikow LF, Kendy E (2005) Groundwater depletion: A global problem. Hydrogeology Journal 13: 317-320.
-
Lettenmaier D, Milly PCD (2009) Land waters and sea level. Nature Geoscience 2: 452-454.
-
Milly PCD, Cazenave A, Famiglietti JS, Gornitz V, Laval K, et al. (2010) Terrestrial water-shortage contributions to sea-level rise and variability. _In:_ Church JA, et al. (Eds.), Understanding Sea-Level Rise and Variability. Wiley- Blackwell, Oxford, United Kingdom, pp: 226-255.
-
Konikow LF (2011) Contribution of global groundwater depletion since 1900 to sea-level rise. Geophysical Research Letters 38(17).
-
Goudie A (2006) Global warming and fluvial geomorphology. Geomorphology 79(3-4): 384-394.
-
Loaciga HA, Valdes JB, Vogel R, Garvey J, Schwarz H (1996) Global warming and the hydrologic cycle. Journal of Hydrology 174(1-2): 83-127.
-
Manabe S, Stouffer RJ (1994) Multiple-century response of a coupled ocean-atmosphere model to an increase of atmospheric carbon dioxide. Journal of Climate 7(1): 5-23.
-
Held IM, Soden BJ (2000) Water vapor feedback and global warming. Annual Review of Energy and Environment 25: 441-475.
-
Hulme M, Osborn TJ, Johns TC (1998) Precipitation sensitivity to global warming: comparisons of observations with HadCM2 simulations. Geophysical Research Letters 25(17): 3379-3382.
-
Rawlins MA, Willmott CJ, Shiklomanov A, Linder E, Frolking S, et al. (2006) Evaluation of trends in derived snowfall and rainfall across Eurasia and linkages with discharge to the Arctic Ocean. Geophysical Research Letters 33(7).
-
Rahmstorf S, Ganopolski A (1999) Long-term global warming scenarios computed with an efficient coupled climate model. Climatic Change 43: 353-367.
-
Cubasch U, Meehl GA, Boer GJ, Stouffer RJ, Dix M, et al. (2001) Projections of future climate change. _In:_ Houghton JT. et al. (Eds.), Climate Change, pp: 1-58.
-
Yonetani T, Gordon HB (2001) Simulated changes in the frequency of extremes and regional features of seasonal/annual temperature and precipitation when atmospheric CO2 is doubled. Journal of Climate 14(8): 1765-1779.
-
Zwiers FW, Kharin VV (1998) Changes in the extremes of climate simulated by CCC GCM2 under CO2doubling. Journal of Climate 11(9): 2200-2222.
-
Moise AF, Colman RA, Brown JR (2012) Behind uncertainties in projections of Australian tropical climate: Analysis of 19 CMIP3 models. Journal of Geophysical Research: Atmospheres 117 (D10).
-
Roderick ML, Farquhar GD (2002) The cause of decreased pan evaporation over the past 50 years. Science 298 (5597): 1410-1411.
-
Roderick ML, Hobbins MT, Farquhar GD (2009) Pan evaporation trends and the terrestrial water balance. I. Principles and Observations. Geography Compass 3(2): 746-760.
-
Mc Vicar TR, Van Niel TG, Roderick ML, Li LT, Mo XG, et al. (2010) Observational evidence from two mountainous regions that near-surface wind speeds are declining more rapidly at higher elevations than lower elevations: 1960-2006. Geophysical Research Letters 37(6).
-
Roderick ML, Rotstayn LD, Farquhar GD, Hobbins MT (2007) On the attribution of changing pan evaporation. Geophysical Research Letters 34(17).
-
Mcvicar TR, Van Niel TG, Li LT, Hutchinson MF, Mu XM, Liu ZH (2007) Spatially distributing monthly reference evapotranspiration and pan evaporation considering topographic influences. Journal of Hydrology 338(3-4): 196-220.
-
Jiang Y, Luo Y, Zhao Z, Tao S (2010) Changes in wind speed over China during 1956-2004. Theoretical and Applied Climatology 99: 421-430.
-
Beniston M (2005) Mountain Climates and Climatic Change: An Overview of Processes Focusing on the European Alps. Pure and Applied Geophysics 162: 1587- 1606.
-
Cai W, Cowan T, Briggs P, Raupach M (2009) Rising Temperature Depletes Soil Moisture and Exacerbates Severe Drought Conditions Across Southeast Australia. Geophysical Research Letters 36(21): L21709.
-
Lockart N, Kavetski D, Franks SW (2009) On the Recent Warming in the Murray-Darling Basin: Land Surface Interactions Misunderstood. Geophysical Research Letters 36(24): L24405.
-
Laternser M, Schneebeli M (2002) Temporal Trend and Spatial Distribution of Avalanche Activity During the Last 50 Years in Switzerland. Natural Hazards 27: 201-230.
-
Schneebeli M, Laternser M, Ammann W (1997) Destructive Snow Avalanches and Climate Change in the Swiss Alps. Eclogae Geologicae Helvetiae 90: 457-461.
-
Bader S, Kunz P (2000) Climate Risks-The Challenge for Alpine Region-PNR31. Verlag der Fachvereine Hochschulverlag AG an der ETH Zurich.
-
Eckert N, Parent E, Kies R, Baya H (2010) A Spatio- Temporal Modeling Framework for Assessing the Fluctuations of Avalanche Occurrence Resulting from Climate Change: Application to 60 Years of Data in the Northern French Alps. Climatic Change 101: 515-553.
-
Jomelli V, Delval C, Grancher D, Escande S, Brunstein D, et al. (2007) Probabilistic Analysis of Recent Snow Avalanche Activity and Climate in the French Alps. Cold Regions Science and Technology 47(1-2): 180-192.
-
Jomelli V, Pech P (2004) Effects of the Little Ice Age on Avalanche Boulder Tongues in the French Alps (Massif Des Ecrins). Earth Surface Processes and Landforms 29(5): 553-564.
-
Lombard A, Cazenave A, Le Traon PY, Ishii M (2005) Contribution of Thermal Expansion to Present-Day Sea- Level Change Revisited. Global and Planetary Change 47(1): 1-16.
-
Briffa KR, van der Schrier G, Jones PD (2009) Wet and Dry Summers in Europe Since 1750: Evidence of Increasing Drought. International Journal of Climatology 29(13): 1894-1905.
-
Laird KR, Haig HA, Ma S, Kingsbury MV, Brown TA, et al. (2012) The Expanded Spatial Extent of the Medieval Climate Anomaly Revealed in Lake-Sediment Records Across the Boreal Region in Northwest Ontario. Global Change Biology 18(9): 2869-2881.
-
Seager R, Graham N, Herweijer C, Gorodn AL, Kushnir Y, et al. (2007) Blueprints for Medieval Hydroclimate. Quaternary Science Reviews 26(19-21): 2322–2336.
-
Cook ER, Seager R, Heim Jr RR, Vose RS, Herweijer C, et al. (2010) Mega-droughts in North America: Placing IPCC Projections of Hydroclimatic Change in a Long-term Palaeoclimate Context. Journal of Quaternary Science 25(1): 48-61.
-
Schmieder J, Fritz SC, Swinehart JB, Shinneman A, Wolfe AP, et al. (2011) A Regional-Scale Climate Reconstruction of the Last 4000 Years from Lakes in the Nebraska Sand Hills, USA. Quaternary Science Reviews 30(12-14): 1797-1812.
-
Dean WE (1997) Rates, Timing, and Cyclicity of Holocene Eolian Activity in the North-Central US: Evidence from Varved Lake Sediments. Geology 25(4): 331-334.
-
Romm J (2011) The Next Dust Bowl. Nature 478: 450- 451.
-
Schindler DW, Lee PG (2010) Comprehensive Conservation Planning to Protect Biodiversity and Ecosystem Services in Canadian Boreal Regions Under A Warming Climate and Increasing Exploitation. Biological Conservation 143(7): 1571-1586.
-
Williams JW, Blois JL, Shuman BN (2011) Extrinsic and Intrinsic Forcing of Abrupt Ecological Change: Case Studies from the Late Quaternary. Journal of Ecology 99: 664-677.
-
Tian J, Nelson DM, Hu FS (2006) Possible Linkages of Late-Holocene Drought in the North American Midcontinent to Pacific Decadal Oscillation and Solar Activity. Geophysical Research Letters 33(23): 1-6.
-
Buhay WM, Simpson S, Thorleifson H, Lewis M, King J, et al. (2009) A 1000 Year Record of Dry Conditions in the Eastern Canadian Prairies Reconstructed from Oxygen and Carbon Isotope Measurements on Lake Winnipeg Sediment Organics. Journal of Quaternary Science 24(5): 426-436.
-
Viau AE, Gajewski K (2009) Reconstructing Millennial- Scale, Regional Paleoclimates of Boreal Canada during the Holocene. Journal of Climate 22(2): 316-330.
-
Viau AE, Ladd M, Gajewski K (2012) The climate of North America during the Past 2000 Years Reconstructed from Pollen Data. Global and Planetary Change 84-85: 75-83.
-
Wahl ER, Diaz HF, Ohlwein C (2012) A Pollenbased Reconstruction of Summer Temperature in Central North America and Implications for Circulation Patterns during Medieval Times. Global and Planetary Change 84- 85: 66-74.
-
Sheffield J, Wood EF, Roderick ML (2012) Little Change in Global Drought Over the Past 60 Years. Nature 491: 435-438.
-
Sheffield J, Andreadis KM, Wood EF, Lettenmaier DP (2009) Global and Continental Drought in the Second Half of the Twentieth Century: Severity-Areaduration Analysis and Temporal Variability of Large-Scale Events. Journal of Climate 22: 1962-1981.
- Enhancement of Vegetative Growth and Fruit Yield in Cucumber (Cucumis sativus L.) via Spiritual Blessing (Biofield) Energy Intervention
- Production of Açaí (Euterpe oleracea Mart.) under Different Agroforestry System Management Intensities in Amazonian Floodplain (Varzea) Forests
- Coffee and the Production Region: What is the Secret to the Expression "Quality"?
- Experiential Agripreneurship Training in Sub-Saharan Africa: Integrating a Business Incubator into Postgraduate Livestock Education at the University of Buea
- Advances in Agricultural High-Quality Development
- Linking Compost Residue to ABAGE in Plants - a Short Note