Evaluation of Cardiac Biomarkers after Administration of the Biofield Energy Treated Proprietary Test Formulation on L-NAME and High Fat Diet-Induced Cardiovascular Disorders in Sprague Dawley Rats
Recent medical advances, cardiovascular disorders (CVDs) continue to be major health concerns, and related high mortality. In this context, investigation of the functional biomarkers involved in the development of CVDs to be an active field of study. The study was aimed to evaluate the effect of Biofield Energy Treated/Blessed Proprietary Test Formulation and Biofield Energy Treatment per se on heart biomarkers in L-NAME and high fat diet (HFD)-induced cardiovascular disorders in Sprague Dawley rats. The functional heart biomarkers such as epinephrine, inducible nitric oxide synthase (iNOS), angiotensin-II, C-reactive protein (CRP), cholesterol, troponin-1, and Na+ /K+ -ATPase were measured using standard ELISA assay. A test formulation was formulated including minerals (magnesium, zinc, copper, calcium, selenium, and iron), vitamins (ascorbic acid, pyridoxine HCl, vitamin B9 , cyanocobalamin, and cholecalciferol), Panax ginseng extract, β-carotene, and cannabidiol isolate. In this experiment, nine groups were allocated, in which four were preventive maintenance groups. Each ingredients of the test formulation were divided into two parts; one section was defined as the untreated test formulation, however other part of the test formulation received Biofield Energy Healing/Blessing remotely for about 3 minutes by Mr. Mahendra Kumar Trivedi. Among nine groups, three groups of animals were also received Biofield Energy Healing Treatment per se (at day-15). The results showed that the level of epinephrine was significantly (p≤0.001) reduced by 72.49%, 63.83%, 80.21%, 89.53%, and 84.97% in the G5 (L-NAME + HFD + the Biofield Energy Treated test formulation), G6 (L-NAME + HFD + Biofield Energy Treatment per se to animals from day -15), and G7 (L-NAME + HFD + the Biofield Energy Treated test formulation from day -15), G8 (L-NAME + HFD + Biofield Energy Treatment per se plus the Biofield Energy Treated test formulation from day -15), and G9 (L-NAME + HFD along with Biofield Energy Treatment per se animals plus the untreated test formulation) groups, respectively as compared to the disease control group (G2). The results showed that the level of iNOS was reduced by 15.19%, 15%, and 23.94% in the G5, G8, and G9 groups, respectively as compared to the untreated test formulation group (G4). Moreover, the level of angiotensin-II was decreased by 29.57%, 18.62%, 34.16%, and 33.35% in the G5, G7, G8 and G9 groups, respectively, as compared to the G2 group. The level of CRP was decreased significantly by 17.57%, 44.94% (p≤0.001), and 41.36% (p≤0.001) in the G5, G8, and G9 groups, respectively as compared to the G2 group. Besides, the level of cholesterol was significantly (p≤0.001) decreased by 27.60%, 23.68%, 28.71%, 41.26%, and 36.94% in the G5, G6, G7, G8, and G9 groups, respectively as compared to the G2 group. The level of troponin-1 was decreased significantly (p≤0.05) by 27.53% in the G9 group as compared to the G2 group. The level of Na+ /K+ -ATPase was significantly increased by 42.16%, 87.87% (p≤0.05), 65.95% (p≤0.05), 31.40%, and 18.48% in the G5, G6, G7, G8, and G9 groups, respectively than G2 group. Overall, the data suggested significance improvement of vital functional heart biomarkers of the Biofield Energy Treated/Blessed test formulation and Biofield Energy Treatment per se along with preventive measure on the animal with respect to various pathological conditions that might be beneficial various types of cardiovascular disorders. Thus, the results showed the significant reduction of cardiovascular disease progression and its complications in the preventive treatment groups (viz. G6, G7, G8, and G9).
Introduction
Cardiovascular disorders (CVDs) are the leading cause of death in adult population in the world. Epinephrine is one of the principal hormones that modulate various functions of the body through adrenergic receptors. It is being used to induce defibrillation in case of cardiac arrest, inhaled to induce bronchodilation in case of acute asthma attack [1]. Nitric oxide (NO) is produced in most of tissues and organs by 3 distinct NO synthase (NOS) isoforms (neuronal, inducible, and endothelial NOS), all the enzymes are expressed in the human cardiovascular system [2]. Abnormal generation of NO is considered as a major cause of coronary heart disease (CHD). Endothelial dysfunction is characterized by reduced endothelial NO synthesis by constitutive NOS (cNOS) and increased systemic NO synthesis due to increased iNOS activity can leads to cardiovascular disorders [3]. Angiotensin II is considered one of the important mediators of the renin-angiotensin system (RAS). It has been reported that angiotensin-II plays a vital role for the pathophysiology of cardiovascular disorders such as hypertension, atherosclerosis, coronary heart disease, restenosis, and heart failure through the RAS [4]. C-reactive protein (CRP) seems to predict the risk of cardiovascular problems as well as cholesterol levels. An elevated level of CRP is associated with three-times more risk of heart attack. CRP is one of the best possible markers of vascular inflammation and plays a vital role in promoting vascular inflammation, vessel damage and clinical cardiovascular disease [5, 6]. There are multiple risk factors related to CVDs such as abnormal blood lipid and sugar levels, obesity, smoking, and high blood pressure. Cholesterol plays the detrimental roles in the pathogenesis of atherosclerosis and CVDs [7]. Cardiac troponins are the “gold standard” for diagnosing of myocardial damage in patients with chest pain [8]. There is great interest the use of high- sensitivity cardiac troponins for the development of CVDs and heart failure screening [9]. Based on the literatures reported that the concentration of Na+/K+-ATPase has been reduced by 40% in the heart failure patients [10]. Thus, study the change in vital functional heart biomarker in presence of L-NAME and High Fat Diet (HFD)-Induced Cardiovascular Disorders in Sprague Dawley Rats, a novel test formulation was designed with the combination of vital minerals (zinc, selenium, copper, iron, magnesium, and calcium), essential vitamins (cyanocobalamin, ascorbic acid, pyridoxine HCl, vitamin B9, and cholecalciferol), and nutraceuticals (β-carotene, Ginseng, cannabidiol isolate (CBD)). All the minerals and vitamins incorporate in this test formulation have significant physiological roles [11, 12, 13]. Besides, cannabidiol itself has wide range of pharmacological profile and has been reported to role in different disorders [14, 15], while ginseng extract is regarded as the one of the best immune boosters for overall immunity [16]. The current study was aimed to evaluate the vital functional cardiac biomarker on the Biofield Energy Treated Proprietary test formulation and Biofield Energy Treatment per se to the animals under L-NAME and high fat diet (HFD)-induced cardiovascular disorders in Sprague Dawley rats.
Biofield Therapy has been reported with significant effects against various disorders, and defined as one of the best Complementary and Alternative Medicine (CAM) treatment approach [17, 18, 19]. National Center for Complementary/ Alternative Medicine (NCCAM) recommended CAM with several clinical benefits as compared with the conventional treatment approach [20]. National Centre of Complementary and Integrative Health (NCCIH) accepted Biofield Energy
Healing as a CAM health care approach in addition to other therapies such as deep breathing, natural products, Tai Chi, yoga, therapeutic touch, Johrei, Reiki, pranic healing, chiropractic/osteopathic manipulation, guided imagery, meditation, massage, homeopathy, hypnotherapy, special diets, movement therapy, Ayurvedic medicine, relaxation techniques, mindfulness, traditional Chinese herbs and medicines in biological systems [21, 22]. The Trivedi Effect®- Consciousness Energy Healing was scientifically reported on various disciplines such as in the nutraceuticals [23], agriculture science [24], cardiac health [25], materials science [26, 27], antiaging [28], Gut health [29], pharmaceuticals [30], overall human health and wellness. In this study, the authors want to study the impact of the Biofield Energy Treatment (the Trivedi Effect) per se and Biofield Energy Treated test formulation on vital functional heart biomarkers such as epinephrine, iNOS, angiotensin-II, CRP, cholesterol, troponin-1, and Na+/K+-ATPase in presence of L-NAME and High Fat Diet-Induced Cardiovascular Disorders in Sprague Dawley Rats using standard ELISA assay.
Material and Methods
Chemicals and Reagents
Pyridoxine hydrochloride (vitamin B6), atorvastatin, zinc chloride, magnesium (II) gluconate, and β-carotene (retinol, provit A) were purchased from TCI, Japan. Copper chloride, cyanocobalamin (vitamin B12), calcium chloride, vitamin E (Alpha-Tocopherol), cholecalciferol (vitamin D3), iron (II) sulfate, captopril, L-NAME, and sodium carboxymethyl cellulose (Na-CMC) were procured from Sigma-Aldrich, USA. Sodium selenate and ascorbic acid were obtained from Alfa Aesar, India. Panax ginseng extract and cannabidiol isolate were obtained from Panacea Phytoextracts, India and Standard Hemp Company, USA, respectively. Standard normal chow diet and high fat diet were purchased from Altromin, USA and Research Diets, USA. For the estimation of cardiac biomarker panels specific ELISA kits were used such as for detection of epinephrine (CSB-E08678r), inducible nitric oxide synthase (iNOS; CSB-E08325r), angiotensin- II (CSB-E04494r), C-reactive protein (CRP; CSB-E07922r), cholesterol, troponin-1 (CSB-E08594r), and Na+/K+-ATPase (CSB-EL002322RA) were procured from CUSABIO, USA.
Experimental Animal
The male Sprague Dawley (SD) rats were randomly assigned as per body weight ranges (200 to 300 gm) and divided into nine groups. The animals were purchased from M/s. HYLASCO Biotechnology (India) Pvt. Ltd., India. Each group consisted of 15 animals of each group (at the time of induction period) and 10 animals of each group (at the time of treatment period). They were kept individually in sterilized polypropylene cages with stainless steel top grill having provision for holding pellet feed and drinking water bottle fitted with stainless steel sipper tube. The animals were maintained as per standard protocol throughout the experiment.
Consciousness Energy Healing Strategies
The novel test formulation was consisted of zinc chloride, iron (II) sulfate, copper chloride, vitamin B6, vitamin B12, vitamin D3, vitamin B9, sodium selenate, calcium chloride, ascorbic acid, beta carotene, Panax ginseng extract, cannabidiol and magnesium (II) gluconate. Each ingredient of the novel test formulation was divided into two parts. One part of the test compound did not receive any sort of treatment and were defined as the untreated or control sample. The second part of the test formulation was treated with the Trivedi Effect® - Energy of Consciousness Healing Treatment/Blessing (Biofield Energy Treatment) by a renowned Biofield Energy Healer, Mr. Mahendra Kumar Trivedi under laboratory conditions for ~3 minutes. Besides, three group of animals also received Biofield Energy Healing Treatment/Blessing by Mr. Mahendra Kumar Trivedi under similar laboratory conditions for ~3 minutes. The Biofield Energy Healing Treatment/ Blessing (prayer) was done remotely, for about 3 minutes via online web-conferencing platform. After that, the Biofield Energy Treated/Blessed samples was kept in the similar sealed condition and used as per the study plan. In the same manner, the control test formulation group was subjected to “sham” healer for ~3 minutes treatment, under the same laboratory conditions. The “sham” healer did not have any knowledge about the Biofield Energy Treatment/Blessing. The Biofield Energy Treated/Blessed animals were also taken back to experimental room for further proceedings.
Experimental Procedure
The animals were randomized and grouped based on the body weight after acclimatization for 7 days. The test formulation was prepared freshly prior to dosing and administered to the animals using an oral intubation needle attached to an appropriately graduated disposable syringe. The dose volume was 10 mL/kg in morning and evening based on body weight. The experimental groups were divided as G1 as normal control (vehicle, 0.5% w/v CMC-Na); G2 as disease control (L-NAME + HFD + 0.5% CMC); G3 as reference item (L-NAME + HFD + Captopril + Atorvastatin); G4 includes L-NAME + HFD along with untreated test formulation; G5 as L-NAME + HFD along with the Biofield Energy Treated test formulation; G6 group includes L-NAME + HFD along with Biofield Energy Treatment per se to animals from day -15; G7 as L-NAME + HFD along with the Biofield Energy Treated test formulation from day -15; G8 group includes L-NAME + HFD along with Biofield Energy Treatment per se plus the Biofield Energy Treated test formulation from day -15, and G9 group denoted L-NAME + HFD along with Biofield Energy Treatment per se animals plus the untreated test formulation. The normal control animals’ group (G1) was received normal drinking water and a normal diet throughout the experimental period. The animals in groups G2-G9 were received L-NAME (20 mg/kg, i.p.) and a HFD throughout the experimental period. At the end of the experimental period (8 weeks treatment) the animals were sacrifice, remove heart, homogenate and subjected for the estimation of epinephrine, inducible nitric oxide synthase (iNOS), angiotensin-II, C-reactive protein (CRP); cholesterol, troponin-1, and Na+/K+-ATPase.
Estimation of Different Biomarkers in Heart Homogenate
The heart homogenate from all the groups was subjected for the estimation of various vital biomarkers such as epinephrine, iNOS, angiotensin-II, CRP, cholesterol, troponin-1, and Na+/K+-ATPase. All the biomarker panel was estimation using ELISA method as per manufacturer’s recommended standard procedure. This was a quantitative method, and the principle was based on the binding of antigen and antibody in sandwich manner assay.
Statistical Analysis
The data were represented as mean ± standard error of mean (SEM) and subjected to statistical analysis using Sigma-Plot statistical software (Version 11.0). For multiple comparison One-way analysis of variance (ANOVA) followed by post-hoc analysis by Dunnett’s test and for between two groups comparison Student’s t-test was performed. The p≤0.05 was considered as statistically significant.
Results and Discussion
Estimation of Epinephrine/Adrenaline
Adrenaline was measured in the presence of the effect of the test formulation in the experimental groups and was graphically presented in the (Figure 1).
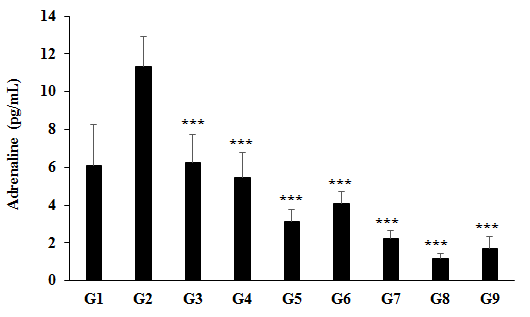
Figure 1: The effect of the test formulation on the level of adrenaline in Sprague Dawley rats. G1 as normal control (vehicle, 0.5% w/v CMC-Na); G2 as disease control (L-NAME + high fat diet (HFD) + 0.5% CMC); G3 as reference item (L-NAME + HFD + Captopril + Atorvastatin); G4 includes L-NAME + HFD along with untreated test formulation; G5 as L-NAME + HFD along with the Biofield Energy Treated test formulation; G6 group includes L-NAME + HFD along with Biofield Energy Treatment per se to animals from day -15; G7 as L-NAME + HFD along with the Biofield Energy Treated test formulation from day -15; G8 group includes L-NAME + HFD along with Biofield Energy Treatment per se plus the Biofield Energy Treated test formulation from day -15, and G9 group denoted L-NAME + HFD along with Biofield Energy Treatment per se animals plus the untreated test formulation. Values are presented as mean ± SEM (n=7 to 9). ***p≤0.001 vs. Disease control (G2).
The data suggested that the disease control (L-NAME + high fat diet (HFD) + 0.5% CMC) group (G2) showed value of adrenaline as 11.34 ± 1.56 pg/mL, which was increased by 85.48% as compared with the normal control (G1, 6.11 ± 2.16 pg/mL). However, positive control (captopril + atorvastatin) treatment (G3) showed the level of adrenaline i.e., 6.23 ± 1.49 pg/mL, which was significantly (p≤0.001) decreased by
45.02% as compared to the G2 group. The level of adrenaline was significantly (p≤0.001) decreased by 51.73%, 72.49%, 63.83%, 80.21%, 89.53%, and 84.97% in the G4 (L-NAME + HFD along with untreated test formulation), G5 (L-NAME + HFD + the Biofield Energy Treated test formulation), G6 (L-NAME + HFD + Biofield Energy Treatment per se to animals from day -15), G7 (L-NAME + HFD + the Biofield Energy
Treated test formulation from day -15), G8 (L-NAME + HFD + Biofield Energy Treatment per se plus the Biofield Energy Treated test formulation from day -15), and G9 (L-NAME + HFD along with Biofield Energy Treatment per se animals plus the untreated test formulation) groups, respectively, as compared to the disease control group (G2). On the other hand, the level of adrenaline was reduced by 42.98%, 25.01%, 58.97%, 78.30%, and 68.85% in the G5, G6, G7, G8, and G9 groups, respectively as compared to the untreated test formulation (G4) group (Figure 1). From literature, it has been reported that continuous secretion of adrenaline during stress conditions can damage blood vessels, elevated blood pressure, and increased the severity of heart attacks or stroke [31]. Overall, here the Biofield Energy Treated test formulation and Biofield Energy Treatment per se significantly reduced the level of adrenaline, which might be helpful for the management of cardiovascular disorders.
Estimation of iNOS Heart Homogenate
The effect of the test formulation and Biofield Energy Treatment per se on the expression of induced nitric oxide synthase (iNOS) is shown in Figure 2. The disease control (L-NAME + high fat diet (HFD) + 0.5% CMC) group (G2) showed value of iNOS as 20.78 ± 2.05 IU/mL, which was increased by 27.91% as compared with the normal control (G1, 16.25 ± 1.37 IU/mL). However, positive control (captopril + atorvastatin) treatment group (G3) showed decreased iNOS level by 5.03% i.e., 19.73 ± 2.22 IU/mL as compared to the G2 group. The expression of iNOS in heart tissue homogenate was decreased by 3.88%, 3.66%, and 13.80% in the G4 (L-NAME + HFD + untreated test formulation), G5 (L-NAME + HFD + the Biofield Energy Treated test formulation), G8 (L-NAME + HFD + Biofield Energy Treatment per se plus the Biofield Energy Treated test formulation from day -15), and G9 (L-NAME + HFD + Biofield Energy Treatment per se animals plus the untreated test formulation) groups, respectively, as compared to the disease control group (G2). Further, the level of iNOS was reduced by 15.19%, 9.75%, 15%, and 23.94% in the G5, G7, G8, and G9 groups, respectively as compared to the untreated test formulation (G4) group (Figure 2). Nitric oxide (NO) is the potent vasodilator that maintain the vascular tone and reactivity. More generation of NO by the stimulation of iNOS have been proposed as a major mechanism of endothelial dysfunction, and that causes cardiovascular abnormalities [32, 33]. Besides, iNOS is overexpressed due to the more secretion of proinflammatory cytokines and can release more NO than other isoform of nitric oxide synthase enzymes [34]. Excess production of NO also causes inhibition of iron-containing enzymes and DNA fragmentation [35]. The induction of iNOS is involved in the pathophysiology of autoimmune diseases and septic shock [36]. Overall, in this study the Biofield Energy Treated test formulation reduced the level of iNOS, which was increased due to cardiovascular disease condition, induced by L-NAME and HFD, which could be beneficial in the cardiovascular patients.
![Figure 2: The disease control (L-NAME + high fat diet (HFD) + 0.5% CMC) group (G2) showed value of iNOS as 20.78 ± 2.05 IU/mL, which was increased by 27.91% as compared with the normal control (G1, 16.25 ± 1.37 IU/mL). However, positive control (captopril + atorvastatin) treatment group (G3) showed decreased iNOS level by 5.03% _i.e.,_ 19.73 ± 2.22 IU/mL as compared to the G2 group. The expression of iNOS in heart tissue homogenate was decreased by 3.88%, 3.66%, and 13.80% in the G4 (L-NAME + HFD + untreated test formulation), G5 (L-NAME + HFD + the Biofield Energy Treated test formulation), G8 (L-NAME + HFD + Biofield Energy Treatment _per se_ plus the Biofield Energy Treated test formulation from day -15), and G9 (L-NAME + HFD + Biofield Energy Treatment _per se_ animals plus the untreated test formulation) groups, respectively, as compared to the disease control group (G2). Further, the level of iNOS was reduced by 15.19%, 9.75%, 15%, and 23.94% in the G5, G7, G8, and G9 groups, respectively as compared to the untreated test formulation (G4) group (Figure 2). Nitric oxide (NO) is the potent vasodilator that maintain the vascular tone and reactivity. More generation of NO by the stimulation of iNOS have been proposed as a major mechanism of endothelial dysfunction, and that causes cardiovascular abnormalities [32,33]. Besides, iNOS is overexpressed due to the more secretion of proinflammatory cytokines and can release more NO than other isoform of nitric oxide synthase enzymes [34]. Excess production of NO also causes inhibition of iron-containing enzymes and DNA fragmentation [35]. The induction of iNOS is involved in the pathophysiology of autoimmune diseases and septic shock [36]. Overall, in this study the Biofield Energy Treated test formulation reduced the level of iNOS, which was increased due to cardiovascular disease condition, induced by L-NAME and HFD, which could be beneficial in the cardiovascular patients.](/fulltextimages/7465/fig_2.png)
Figure 2: The effect of the test formulation on the level of inducible nitric oxide synthase (iNOS) on heart homogenate in Sprague Dawley rats. G1 as normal control (vehicle, 0.5% w/v CMC-Na); G2 as disease control (L-NAME + high fat diet (HFD) + 0.5% CMC); G3 as reference item (L-NAME + HFD + Captopril + Atorvastatin); G4 includes L-NAME + HFD along with untreated test formulation; G5 as L-NAME + HFD along with the Biofield Energy Treated test formulation; G6 group includes L-NAME + HFD along with Biofield Energy Treatment per se to animals from day -15; G7 as L-NAME + HFD along with the Biofield Energy Treated test formulation from day -15; G8 group includes L-NAME + HFD along with Biofield Energy Treatment per se plus the Biofield Energy Treated test formulation from day -15, and G9 group denoted L-NAME + HFD along with Biofield Energy Treatment per se animals plus the untreated test formulation. Values are presented as mean ± SEM (n=7 to 9).
Estimation of Angiotensin-II in Heart Homogenate
The level of angiotensin-II in heart homogenate was measured and the data are shown in Figure 3. The disease control (L-NAME + high fat diet, HFD + 0.5% CMC) group (G2) showed the expression of angiotensin-II as 88.03 ± 10.41 pg/mL, which was increased by 49.09% as compared with the normal control (G1, 59.05 ± 4.99 pg/mL) group. While, in the positive control (captopril + atorvastatin) treatment (G3) group the level of angiotensin-II was decreased by 27.60% i.e., 63.74 ± 6.85 pg/mL. The level of angiotensin-II was decreased by 18.38%, 29.57%, 3.59%, 18.62%, 34.16%, and 33.35% in the G4 (L-NAME + HFD + untreated test formulation), G5 (L-NAME + HFD + the Biofield Energy Treated test formulation), G6 (L-NAME + HFD + Biofield Energy Treatment per se to animals from day -15), G7 (L-NAME + HFD + the Biofield Energy Treated test formulation from day -15), G8 (L-NAME + HFD + Biofield Energy Treatment per se plus the Biofield Energy Treated test formulation from day -15), and G9 (L-NAME + HFD + Biofield Energy Treatment per se animals plus the untreated test formulation) groups, respectively, as compared to the disease control group (G2). Moreover, the level of angiotensin-II was reduced by 13.71%, 0.29%, 19.33%, and 18.34% in the G5, G7, G8, and G9 groups, respectively as compared to the untreated test formulation (G4) group (Figure 3). Based on the various research outcomes, it has been reported that angiotensin-II plays a vital role for the pathophysiology of cardiovascular disorders, through the renin-angiotensin system (RAS) [37, 38]. It also causes cardiac remodelling and dysfunction. Inhibitions of the RAS have proven beneficial in the treatment of CVDs patients [39]. Overall, here the Biofield Energy Treated test formulation reduced the level of angiotensin-II, which could be beneficial in the cardiovascular patients (Figure 3).
![Figure 3: The disease control (L-NAME + high fat diet, HFD + 0.5% CMC) group (G2) showed the expression of angiotensin-II as 88.03 ± 10.41 pg/mL, which was increased by 49.09% as compared with the normal control (G1, 59.05 ± 4.99 pg/mL) group. While, in the positive control (captopril + atorvastatin) treatment (G3) group the level of angiotensin-II was decreased by 27.60% _i.e.,_ 63.74 ± 6.85 pg/mL. The level of angiotensin-II was decreased by 18.38%, 29.57%, 3.59%, 18.62%, 34.16%, and 33.35% in the G4 (L-NAME + HFD + untreated test formulation), G5 (L-NAME + HFD + the Biofield Energy Treated test formulation), G6 (L-NAME + HFD + Biofield Energy Treatment _per se_ to animals from day -15), G7 (L-NAME + HFD + the Biofield Energy Treated test formulation from day -15), G8 (L-NAME + HFD + Biofield Energy Treatment _per se_ plus the Biofield Energy Treated test formulation from day -15), and G9 (L-NAME + HFD + Biofield Energy Treatment _per se_ animals plus the untreated test formulation) groups, respectively, as compared to the disease control group (G2). Moreover, the level of angiotensin-II was reduced by 13.71%, 0.29%, 19.33%, and 18.34% in the G5, G7, G8, and G9 groups, respectively as compared to the untreated test formulation (G4) group (Figure 3). Based on the various research outcomes, it has been reported that angiotensin-II plays a vital role for the pathophysiology of cardiovascular disorders, through the renin-angiotensin system (RAS) [37,38]. It also causes cardiac remodelling and dysfunction. Inhibitions of the RAS have proven beneficial in the treatment of CVDs patients [39]. Overall, here the Biofield Energy Treated test formulation reduced the level of angiotensin-II, which could be beneficial in the cardiovascular patients (Figure 3).](/fulltextimages/7465/fig_3.png)
Figure 3: The effect of the test formulation on the level of angiotensin-II on heart homogenate in Sprague Dawley rats. G: Group; G1 as normal control (vehicle, 0.5% w/v CMC-Na); G2 as disease control (L-NAME + high fat diet (HFD) + 0.5% CMC); G3 as reference item (L-NAME + HFD + Captopril + Atorvastatin); G4 includes L-NAME + HFD along with untreated test formulation; G5 as L-NAME + HFD along with the Biofield Energy Treated test formulation; G6 group includes L-NAME + HFD along with Biofield Energy Treatment per se to animals from day -15; G7 as L-NAME + HFD along with the Biofield Energy Treated test formulation from day -15; G8 group includes L-NAME + HFD along with Biofield Energy Treatment per se plus the Biofield Energy Treated test formulation from day -15, and G9 group denoted L-NAME + HFD along with Biofield Energy Treatment per se animals plus the untreated test formulation. Values are presented as mean ± SEM (n=7 to 9).
Estimation of C-Reactive Protein (CRP) on Heart Homogenate
The effect of the test formulation and Biofield Energy Treatment per se on the level of C-reactive protein (CRP) in heart homogenate and the results are shown in Figure 4. The disease control (L-NAME + high fat diet, HFD + 0.5% CMC) group (G2) showed value of CRP as 1323.50 ± 168.38 ng/ mL, which was increased by 105.40% as compared with the normal control (G1, 644.34 ± 55.24 ng/mL). Further, the positive control (captopril + atorvastatin) treatment (G3) showed significant (p≤0.001) decreased the level of CRP by 40.56% i.e., 786.67 ± 79.69 ng/mL as compared to the G2 group. The level of microvascular inflammatory biomarker, CRP was decreased significantly by 23.44%, 17.57%, 3.43%, 44.94% (p≤0.001), and 41.36% (p≤0.001) in the G4 (L-NAME + HFD + untreated test formulation), G5 (L-NAME + HFD + the Biofield Energy Treated test formulation), G7 (L-NAME + HFD + the Biofield Energy Treated test formulation from day -15), G8 (L-NAME + HFD + Biofield Energy Treatment per se plus the Biofield Energy Treated test formulation from day -15), and G9 (L-NAME + HFD +
Biofield Energy Treatment per se animals plus the untreated test formulation) groups, respectively, as compared to the disease control group (G2). Similarly, CRP level was decreased by 28.09% and 23.41% in the G8 and G9 groups, respectively as compared to the untreated test formulation (G4) group (Figure 4). Inflammation plays a major role in the pathogenesis of cardiovascular disease [40]. In this context, CRP is playing an independent risk factor for cardiovascular patients and one of the best microvascular inflammatory biomarkers for detection of immune function alterations [41, 42]. Therefore, in this experiment the Biofield Energy Treated test formulation and the preventive maintenance groups significantly reduced the level of CRP, which could be beneficial to improve the cardiovascular disease conditions (Figure 4).
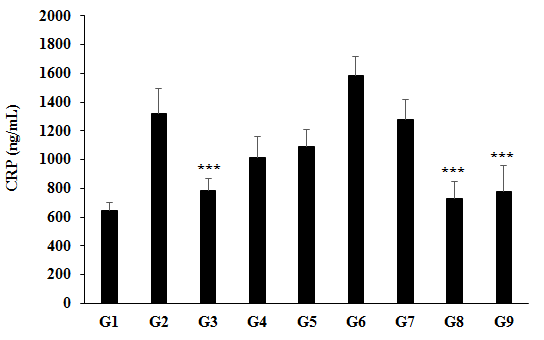
Figure 4: The effect of the test formulation on the level of heart C-reactive protein (CRP) in Sprague Dawley rats. G: Group; G1 as normal control (vehicle, 0.5% w/v CMC-Na); G2 as disease control (L-NAME + high fat diet (HFD) + 0.5% CMC); G3 as reference item (L-NAME + HFD + Captopril + Atorvastatin); G4 includes L-NAME + HFD along with untreated test formulation; G5 as L-NAME + HFD along with the Biofield Energy Treated test formulation; G6 group includes L-NAME + HFD along with Biofield Energy Treatment per se to animals from day -15; G7 as L-NAME + HFD along with the Biofield Energy Treated test formulation from day -15; G8 group includes L-NAME + HFD along with Biofield Energy Treatment per se plus the Biofield Energy Treated test formulation from day -15, and G9 group denoted L-NAME + HFD along with Biofield Energy Treatment per se animals plus the untreated test formulation. Values are presented as mean ± SEM (n=7 to 9). ***p≤0.001 vs. Disease control (G2).
Estimation of Cholesterol in Heart Tissue
The effect of the test formulation and Biofield Energy Treatment per se on the level of cholesterol in heart tissue and the results are shown in Figure 5. The level of cholesterol in the disease control (L-NAME + high fat diet, HFD + 0.5% CMC) group (G2) was 38.85 ± 2.11 mg/dL, which was increased by 150.21% as compared with the normal control (G1, 15.42 ± 1.71 mg/dL). Further, the positive control (captopril + atorvastatin) treatment (G3) showed significant decreased level of cholesterol in heart tissue by 40.42%, i.e., 22.98 ± 2.47 mg/dL as compared with the G2. The level of cholesterol was significantly (p≤0.001) decreased by 27.42%, 27.60%, 23.68%, 28.71%, 41.26%, and 36.94% in the G4 (L-NAME + HFD + untreated test formulation), G5 (L-NAME + HFD + the Biofield Energy Treated test formulation), G6 (L-NAME + HFD + Biofield Energy Treatment per se to animals from day -15), G7 (L-NAME + HFD + the Biofield Energy Treated test formulation from day -15), G8 (L-NAME + HFD + Biofield Energy Treatment per se plus the Biofield Energy Treated test formulation from day -15), and G9 (L-NAME + HFD + Biofield Energy Treatment per se animals plus the untreated test formulation) groups, respectively, as compared to the disease control group (G2). Similarly, cholesterol level was decreased by 0.24%, 1.78%, 19.07%, and 13.11% in the G5, G6, G7, G8, and G9 groups, respectively as compared to the untreated test formulation (G4) group (Figure 5). Cholesterol is a biological molecule essential component for cell membrane and function and synthesis of hormone and vitamin in mammals. Increased level of cholesterol leads to cardiovascular disorders like atherosclerosis [43, 44]. Overall, in this experiment all the treatment groups have significantly reduced the level of cholesterol, which could reduce the risks of cardiovascular risks.
![Figure 5: The level of cholesterol in the disease control (L-NAME + high fat diet, HFD + 0.5% CMC) group (G2) was 38.85 ± 2.11 mg/dL, which was increased by 150.21% as compared with the normal control (G1, 15.42 ± 1.71 mg/dL). Further, the positive control (captopril + atorvastatin) treatment (G3) showed significant decreased level of cholesterol in heart tissue by 40.42%, _i.e_., 22.98 ± 2.47 mg/dL as compared with the G2. The level of cholesterol was significantly (_p_≤0.001) decreased by 27.42%, 27.60%, 23.68%, 28.71%, 41.26%, and 36.94% in the G4 (L-NAME + HFD + untreated test formulation), G5 (L-NAME + HFD + the Biofield Energy Treated test formulation), G6 (L-NAME + HFD + Biofield Energy Treatment _per se_ to animals from day -15), G7 (L-NAME + HFD + the Biofield Energy Treated test formulation from day -15), G8 (L-NAME + HFD + Biofield Energy Treatment _per se_ plus the Biofield Energy Treated test formulation from day -15), and G9 (L-NAME + HFD + Biofield Energy Treatment _per se_ animals plus the untreated test formulation) groups, respectively, as compared to the disease control group (G2). Similarly, cholesterol level was decreased by 0.24%, 1.78%, 19.07%, and 13.11% in the G5, G6, G7, G8, and G9 groups, respectively as compared to the untreated test formulation (G4) group (Figure 5). Cholesterol is a biological molecule essential component for cell membrane and function and synthesis of hormone and vitamin in mammals. Increased level of cholesterol leads to cardiovascular disorders like atherosclerosis [43,44]. Overall, in this experiment all the treatment groups have significantly reduced the level of cholesterol, which could reduce the risks of cardiovascular risks.](/fulltextimages/7465/fig_5.png)
Figure 5: The effect of the test formulation on the level of cholesterol on heart homogenate in Sprague Dawley rats. G: Group; G1 as normal control (vehicle, 0.5% w/v CMC-Na); G2 as disease control (L-NAME + high fat diet (HFD) + 0.5% CMC); G3 as reference item (L-NAME + HFD + Captopril + Atorvastatin); G4 includes L-NAME + HFD along with untreated test formulation; G5 as L-NAME + HFD along with the Biofield Energy Treated test formulation; G6 group includes L-NAME + HFD along with Biofield Energy Treatment per se to animals from day -15; G7 as L-NAME + HFD along with the Biofield Energy Treated test formulation from day -15; G8 group includes L-NAME + HFD along with Biofield Energy Treatment per se plus the Biofield Energy Treated test formulation from day -15, and G9 group denoted L-NAME + HFD along with Biofield Energy Treatment per se animals plus the untreated test formulation. Values are presented as mean ± SEM (n=7 to 9). ***p≤0.001 vs. Disease control (G2).
Estimation of in Troponin-1 Heart Tissue
The effect of the test formulation and Biofield Energy
Treatment per se on the level of troponin-1 in heart tissue and the results are shown in Figure 6.
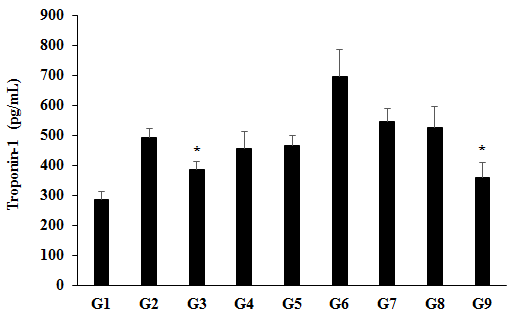
Figure 6: The effect of the test formulation on the level of troponin-1 on heart homogenate in Sprague Dawley rats. G: Group; G1 as normal control (vehicle, 0.5% w/v CMC-Na); G2 as disease control (L-NAME + high fat diet (HFD) + 0.5% CMC); G3 as reference item (L-NAME + HFD + Captopril + Atorvastatin); G4 includes L-NAME + HFD along with untreated test formulation; G5 as L-NAME + HFD along with the Biofield Energy Treated test formulation; G6 group includes L-NAME + HFD along with Biofield Energy Treatment per se to animals from day -15; G7 as L-NAME + HFD along with the Biofield Energy Treated test formulation from day -15; G8 group includes L-NAME + HFD along with Biofield Energy Treatment per se plus the Biofield Energy Treated test formulation from day -15, and G9 group denoted L-NAME + HFD along with Biofield Energy Treatment per se animals plus the untreated test formulation. Values are presented as mean ± SEM (n=7 to 9). *p≤0.05 vs. Disease control (G2).
The level of troponin-1 in the disease control (L-NAME + high fat diet, HFD + 0.5% CMC) group (G2) was 494.17 ± 29.69 pg/mL, which was increased by 73.12% as compared with the normal control (G1, 285.44 ± 27.17 pg/mL). Further, the positive control (captopril + atorvastatin) treatment (G3) showed significant (p≤0.05) decreased level of troponin-1 in heart tissue by 21.54%, i.e., 387.7 ± 24.92 pg/mL as compared with the G2. The level of troponin-1 was significantly decreased by 7.97%, 5.40%, and 27.53% (p≤0.05) in the G4 (L-NAME + HFD + untreated test formulation), G5 (L-NAME + HFD + the Biofield Energy Treated test formulation), and G9 (L-NAME + HFD + Biofield Energy Treatment per se animals plus the untreated test formulation) groups, respectively, as compared to the disease control group (G2). Similarly, troponin-1 level was decreased by 21.25% in the G9 group as compared to the untreated test formulation (G4) group (Figure 6). Cardiac troponins are biomarkers mainly used to diagnose acute myocardial injury and cardiac infarction [45]. High level of troponins indicates acute myocardial infarction [46], coronary artery stenosis, microvascular lesions, silent plaque, rupture or subclinical myocardial fibrosis, and necrosis [47]. Overall, in this experiment the Biofield Energy Treatment per se preventive maintenance group significantly reduced the level of troponin in heart tissues, which could reduce the risks of cardiovascular diseases.
Estimation of in Na+/K+-ATPase Heart Tissue
The effect of the test formulation and Biofield Energy Treatment per se on the level of Na+/K+-ATPase in heart tissue and the results are shown in Figure 7. The level of Na+/K+- ATPase in the disease control (L-NAME + high fat diet, HFD + 0.5% CMC) group (G2) was 605.98 ± 79.94 pg/mL, which was decreased by 25.89% as compared with the normal control (G1, 817.67 ± 108.96 pg/mL). Further, the positive control (captopril + atorvastatin) treatment (G3) showed increased the level of Na+/K+-ATPase by 36.68% in heart tissue as 822.22 ± 87.76 pg/mL. The level of Na+/K+-ATPase was significantly increased by 19.22%, 42.16%, 87.87% (p≤0.05), 65.95% (p≤0.05), 31.40%, and 18.48% in the G4 (L-NAME + HFD + untreated test formulation), G5 (L-NAME + HFD + the Biofield Energy Treated test formulation), G6 (L-NAME + HFD + Biofield Energy Treatment per se to animals from day -15), G7 (L-NAME + HFD + the Biofield Energy Treated test formulation from day -15), G8 (L-NAME + HFD + Biofield Energy Treatment per se plus the Biofield Energy Treated test formulation from day -15), and G9 (L-NAME + HFD + Biofield Energy Treatment per se animals plus the untreated test formulation) groups, respectively, as compared to the disease control (G2) group. The level of Na+/K+-ATPase was significantly increased by 19.23%, 57.57%, 39.19%, and 10.21% in the G5 (L-NAME + HFD + the Biofield Energy Treated test formulation), G6 (L-NAME + HFD + Biofield Energy Treatment per se to animals from day -15), G7 (L-NAME + HFD + the Biofield Energy Treated test formulation from day -15), and G8 (L-NAME + HFD + Biofield Energy Treatment per se plus the Biofield Energy Treated test formulation from day -15) groups, respectively, as compared to the untreated test formulation (G4) group (Figure 7). The literature data suggest that the level of Na+/ K+-ATPase has been decreased in the heart failure patients, and simultaneously decrease the function of heart [48]. Overall, in this experiment the Biofield Energy Treated test formulation and Biofield Energy Treatment per se preventive maintenance groups significantly increased the level of Na+/ K+-ATPase, which could reduce the risks of cardiovascular diseases.
![Figure 7: The level of Na+/K+- ATPase in the disease control (L-NAME + high fat diet, HFD + 0.5% CMC) group (G2) was 605.98 ± 79.94 pg/mL, which was decreased by 25.89% as compared with the normal control (G1, 817.67 ± 108.96 pg/mL). Further, the positive control (captopril + atorvastatin) treatment (G3) showed increased the level of Na+/K+-ATPase by 36.68% in heart tissue as 822.22 ± 87.76 pg/mL. The level of Na+/K+-ATPase was significantly increased by 19.22%, 42.16%, 87.87% (_p_≤0.05), 65.95% (_p_≤0.05), 31.40%, and 18.48% in the G4 (L-NAME + HFD + untreated test formulation), G5 (L-NAME + HFD + the Biofield Energy Treated test formulation), G6 (L-NAME + HFD + Biofield Energy Treatment _per se_ to animals from day -15), G7 (L-NAME + HFD + the Biofield Energy Treated test formulation from day -15), G8 (L-NAME + HFD + Biofield Energy Treatment _per se_ plus the Biofield Energy Treated test formulation from day -15), and G9 (L-NAME + HFD + Biofield Energy Treatment _per se_ animals plus the untreated test formulation) groups, respectively, as compared to the disease control (G2) group. The level of Na+/K+-ATPase was significantly increased by 19.23%, 57.57%, 39.19%, and 10.21% in the G5 (L-NAME + HFD + the Biofield Energy Treated test formulation), G6 (L-NAME + HFD + Biofield Energy Treatment _per se_ to animals from day -15), G7 (L-NAME + HFD + the Biofield Energy Treated test formulation from day -15), and G8 (L-NAME + HFD + Biofield Energy Treatment _per se_ plus the Biofield Energy Treated test formulation from day -15) groups, respectively, as compared to the untreated test formulation (G4) group (Figure 7). The literature data suggest that the level of Na+/ K+-ATPase has been decreased in the heart failure patients, and simultaneously decrease the function of heart [48]. Overall, in this experiment the Biofield Energy Treated test formulation and Biofield Energy Treatment _per se_ preventive maintenance groups significantly increased the level of Na+/ K+-ATPase, which could reduce the risks of cardiovascular diseases.](/fulltextimages/7465/fig_7.png)
Figure 7: The effect of the test formulation on the level of Na+/K+-ATPase on heart homogenate in Sprague Dawley rats. G: Group; G1 as normal control (vehicle, 0.5% w/v CMC-Na); G2 as disease control (L-NAME + high fat diet (HFD) + 0.5% CMC); G3 as reference item (L-NAME + HFD + Captopril + Atorvastatin); G4 includes L-NAME + HFD along with untreated test formulation; G5 as L-NAME + HFD along with the Biofield Energy Treated test formulation; G6 group includes L-NAME + HFD along with Biofield Energy Treatment per se to animals from day -15; G7 as L-NAME + HFD along with the Biofield Energy Treated test formulation from day -15; G8 group includes L-NAME + HFD along with Biofield Energy Treatment per se plus the Biofield Energy Treated test formulation from day -15, and G9 group denoted L-NAME + HFD along with Biofield Energy Treatment per se animals plus the untreated test formulation. Values are presented as mean ± SEM (n=7 to 9). *p≤0.05 vs. Disease control (G2).
Conclusion
The level of epinephrine was significantly reduced by 72.49%, 63.83%, 80.21%, 89.53%, and 84.97% in the G5 (L-NAME + HFD + the Biofield Energy Treated test formulation), G6 (L-NAME + HFD + Biofield Energy Treatment per se to animals from day -15), and G7 (L-NAME + HFD + the Biofield Energy Treated test formulation from day -15), G8 (L-NAME + HFD + Biofield Energy Treatment per se plus the Biofield Energy Treated test formulation from day -15), and G9 (L-NAME + HFD along with Biofield Energy Treatment per se animals plus the untreated test formulation) groups, respectively as compared to the disease control group (G2). Moreover, expression of iNOS was decreased by 15.19%, 15%, and 23.94% in the G5, G8, and G9 groups, respectively as compared to the untreated test formulation group (G2). However, the level of angiotensin-II was reduced by 29.57%, 18.62%, 34.16%, and 33.35% in the G5, G7, G8, and G9 groups, respectively, as compared to the disease control group (G2). Additionally, the level of CRP was significantly decreased by 17.57%, 44.94% (p≤0.001), and 41.36% (p≤0.001) in the G5, G8, and G9 groups, respectively, as compared to the G2 group. On the other hand, estimation of cholesterol data showed that the level was significantly (p≤0.001) decreased by 27.60%, 23.68%, 28.71%, 41.26%, and 36.94% in the G5, G6, G7, G8, and G9 groups, respectively as compared to the G2 group. The level of troponin-1 was decreased by 27.53% in the G9 group as compared to the G2 group. Further, the level of Na+/K+-ATPase was significantly decreased by 42.16%, 87.87% (p≤0.05), 65.95% (p≤0.05), 31.40%, and 18.48% in the G5, G6, G7, G8, and G9 groups, respectively as compared to the G2 group. Altogether, the Biofield Energy Treated test formulation and Biofield Energy Healing Treatment (the Trivedi Effect®) per se showed significant results with respect to different heart biomarkers in the preventive maintenance group per se (G6), as well as other preventive maintenance groups (G7, G8, and G9) in L-NAME and High Fat Diet- Induced cardiovascular disorders rat model study. It also helped to slowdown the cardiovascular disease progression and disease-related complications of the overall animal’s health. These data suggested that Biofield Energy Treatment per se and/or Biofield Energy Treated Test formulation in combination would be the best treatment strategies to prevent and protect from the occurrence of any type of diseases. Therefore, the Biofield Energy Treatment might act as a preventive maintenance therapy to maintain good health, or full restoration of health or improve the overall health and quality of life in human. This therapy might also reduce the severity of acute/chronic diseases related to hyperthyroidism, Goiter, hypothyroidism, Graves’ disease. This test formulation also can be used against fibromyalgia, Addison disease, multiple sclerosis, myasthenia gravis, aplastic anaemia, psoriasis, rheumatoid arthritis, Crohn’s disease, ulcerative colitis, dermatitis, hepatitis, Parkinson’s, stroke, etc. and to improve the overall health and quality of life.
Acknowledgements
The authors are grateful to Dabur Research Foundation, Trivedi Science, Trivedi Global, Inc., and Trivedi Master Wellness for the assistance and support during the work.
References
-
Jang Y, Kim E (2013) Cardiovascular effect of epinephrine in endodontic microsurgery: A review. Restor Dent Endod 38(4): 187-193.
-
Tsutsui M, Shimokawa H, Otsuji Y, Ueta Y, Sasaguri Y (2009) Nitric oxide synthases and cardiovascular diseases: Insights from genetically modified mice. Circ J 73(6): 986-993.
-
Besedina A (2016) NO-Synthase activity in patients with coronary heart disease associated with hypertension of different age groups. J Med Biochem 35(1): 43-49.
-
Ferrario CM (2006) Role of angiotensin II in cardiovascular disease therapeutic implications of more than a century of research. J Renin Angiotensin Aldosterone Syst 7(1): 3-14.
-
Cozlea DL, Farcas DM, Nagy A, Keresztesi AA, Ramona T, et al. (2013) The impact of C reactive protein on global cardiovascular risk on patients with coronary artery disease. Curr Health Sci J 39(4): 225-231.
-
Lagrand WK, Visser CA, Hermens WT, Niessen HW, Verheugt FW, et al. (1999) C-reactive protein as a cardiovascular risk factor: More than an epiphenomenon? Circulation 100(1): 96-102.
-
Eyup A, Ahmet D, Didar EA (2018) Role of Cholesterol as a Risk Factor in Cardiovascular Diseases, Cholesterol - Good, Bad and the Heart, Madan L. Nagpal, Intech Open.
-
Zethelius B, Johnston N, Venge P (2006) Troponin I as a predictor of coronary heart disease and mortality in 70-year-old men: A community-based cohort study. Circulation 113(8): 1071-1078.
-
Welsh P, Preiss D, Hayward C, Shah ASV, McAllister D, et al. (2019) Cardiac troponin T and troponin I in the general population. Circulation 139(24): 2754‐2764.
-
Nørgaard A, Bagger JP, Bjerregaard P, Baandrup U, Kjeldsen K, et al. (1988) Relation of left ventricular function and Na,K-pump concentration in suspected idiopathic dilated cardiomyopathy. Am J Cardiol 61(15): 1312-1315.
-
Byrne JH, Voogt M, Turner KM, Eyles DW, McGrath JJ (2013) The impact of adult vitamin D deficiency on behaviour and brain function in male Sprague-Dawley rats. PLoS One 8(8): e71593.
-
Rayman MP (2000) The importance of selenium to human health. Lancet 356(9225): 233-241.
-
Beard JL, Connor JR (2003) Iron status and neural functioning. Ann Rev Nutr 23: 41-58.
-
Peres FF, Lima AC, Hallak JEC, Crippa JA, Silva RH, et al. (2018) Cannabidiol as a Promising Strategy to Treat and Prevent Movement Disorders? Front Pharmacol 9: 482.
-
Nagarkatti P, Pandey R, Rieder SA, Hegde VL, Nagarkatti M (2009) Cannabinoids as novel anti-inflammatory drugs. Future Med Chem 1(7): 1333-1349.
-
Kang S, Min H (2012) Ginseng, the ‘Immunity Boost’: The Effects of _Panax ginseng_ on Immune System. J Ginseng Res 36(4): 354-368.
-
Maizes V, Rakel D, Niemiec C (2009) Integrative medicine and patient-centered care. Explore (NY) 5(5): 277-289.
-
Bischof M, Del Giudice E (2013) Communication and the emergence of collective behavior in living organisms: a quantum approach. Mol Biol Int 2013: 987549.
-
Cassidy CM (2004) What does it mean to practice an energy medicine? J Altern Complement Med 10(1): 79- 81.
-
Barnes PM, Bloom B, Nahin RL (2008) Complementary and alternative medicine use among adults and children: United States, 2007. Natl Health Stat Report 12: 1-23.
-
Fan K wai (2005) National Center for Complementary and Alternative Medicine Website. J Med Libr Assoc 93(3): 410-412.
-
Wisneski L, Anderson L (2009) The Scientific Basis of Integrative Medicine. Boca Raton, FL: CRC Press, pp: 1-434.
-
Trivedi MK, Branton A, Trivedi D, Jana S (2021) Isotopic abundance ratio analysis of consciousness energy healing treated folic acid. Food Nutr Current Res 4(2): 290-295.
-
Trivedi MK, Branton A, Trivedi D, Nayak G, Mondal SC, et al. (2015) Morphological characterization, quality, yield and DNA fingerprinting of biofield energy treated alphonso mango (_Mangifera indica_ L.). Journal of Food and Nutrition Sciences 3(6): 245-250.
-
Mahendra KT, Snehasis J (2019) _In vitro_ assessment of the biofield treated test item on cardiac function using rat cardiomyocytes cell line (H9c2) _via_ multiparametric analysis. Journal of Hypertension and Cardiology 2(4): 1-12.
-
Trivedi MK, Branton A, Trivedi D, Jana S (2021) Effect of consciousness energy healing treatment on the metal profile and properties of tellurium. Eng Technol Open Acc 3(5): 555623.
-
Mahendra KT, Alice B, Dahryn T, Snehasis J (2021) Consciousness energy healing treatment impacted the isotopic abundance ratio of 6-Mercaptopurine (6-MP). Nov Appro Drug Des Dev 5(5): 555673.
-
Trivedi MK, Jana S (2021) Anti-aging activity of biofield energy treated novel proprietary test formulation by assessment of vital biomarkers in cerebrospinal fluid (CSF) in Sprague Dawley rats. On J Neur & Br Disord 5(2).
-
Trivedi MK, Jana S (2021) Evaluation of biofield energy healing treatment based proprietary test formulation on gut health potential in colon cancer cell line (HT-29). J Pharmacol Clin Res 8(4): 555743.
-
Trivedi MK, Branton A, Trivedi D, Jana S (2020) The consciousness energy healing treatment and its impact on the isotopic abundance ratio analysis of flutamide. Drug Des Int Prop Int J 3(5): 427-438.
-
de Lucia C, Femminella GD, Gambino G, Pagano G, Allocca E, et al. (2014) Adrenal adrenoceptors in heart failure. Front Physiol 5: 246.
-
Tang EH, Vanhoutte PM (2010) Endothelial dysfunction: A strategic target in the treatment of hypertension? Pflugers Arch 459(6): 995-1004.
-
Raddino R, Caretta G, Teli M, Bonadei I, Robba D, et al. (2007) Nitric oxide and cardiovascular risk factors. Heart International 3(1): 18.
-
Besedina A (2016) NO-synthase activity in patients with coronary heart disease associated with hypertension of different age groups. J Med Biochem 35(1): 43-49.
-
Viaro F, Nobre F, Evora PR (2000) Expression of nitric oxide synthases in the pathophysiology of cardiovascular diseases. Arq Bras Cardiol 74(4): 380-393.
-
Forstermann U, Closs EI, Pollock JS, Nakane M, Schwarz P, et al. (1994) Nitric oxide synthase isozymes. Characterization, purification, molecular cloning, and functions. Hypertension 23: 1121-1131.
-
Ferrario CM (2006) Role of angiotensin II in cardiovascular disease therapeutic implications of more than a century of research. J Renin Angiotensin Aldosterone Syst 7(1): 3-14.
-
Lemarie CA, Schiffrin EL (2010) The angiotensin II type 2 receptor in cardiovascular disease. J Renin Angiotensin Aldosterone Syst 11(1): 19-31.
-
Zablocki D, Sadoshima J (2013) Angiotensin II and oxidative stress in the failing heart. Antioxid Redox Signal 19(10): 1095-1109.
-
Ross T (1993) The pathogenesis of atherosclerosis: a perspective for the 1990s. Nature 362(6423): 801-809.
-
Mendall MA, Patel P, Ballam L, Strachan D, Northfield TC (1996) C-reactive protein and its relation to cardiovascular risk factors: a population based cross sectional study. BMJ 312(7038): 1061-1065.
-
DuBrock HM, AbouEzzeddine OF, Redfield MM (2018) High-sensitivity C-reactive protein in heart failure with preserved ejection fraction. PLoS One 13(8): e0201836.
-
National Cholesterol Education Program (NCEP) (2002) Expert Panel on Detection, Evaluation, and Treatment of High Blood Cholesterol in Adults (Adult Treatment Panel III). Circulation 106(25): 3143-3421.
-
Soliman GA (2018) Dietary Cholesterol and the lack of evidence in cardiovascular disease. Nutrients 10(6): 780.
-
Michos ED, Berger Z, Yeh HC, Cuervo CS, Wilson LM, et al. (2014) Cardiac troponins used as diagnostic and prognostic tests in patients with kidney disease. Rockville (MD): Agency for Healthcare Research and Quality (US).
-
Taheri S, Pilehvarian AA, Akbari N, Musavi S, Naeini AE (2016) Association between troponin I level and cardiovascular risk factors in asymptomatic hemodialysis patients. J Res Pharm Pract 5(2): 101‐105.
-
Resic H, Ajanovic S, Kukavica N, Masnic F, Coric A (2009) Plasma levels of brain natriuretic peptides and cardiac troponin in hemodialysis patients. Bosn J Basic Med Sci 9(2): 137-141.
-
Kjeldsen K (2003) Myocardial Na,K-ATPase: Clinical aspects. Exp Clin Cardiol 8(3): 131‐133.
- Anomalous Origin of the Left Coronary System from the Right Coronary Cusp: A Rare Coronary Anomaly in a Patient Undergoing Aortic Stenosis Workup
- Optimizing the Therapeutic Potential of Sacubitril/Valsartan: The Promise of Co-Crystal Engineering
- Association between Mortality and Topography of Peripheral Arterial Disease due to Atherosclerosis Obliterans
- Mitral Valve Replacement vs Mitral Valve Repair
- Characteristics and Evolution of Patients with Heart Failure Hospitalized in the Cardiology Department of Dalal Jamm Hospital
- Distribution of Association between Basic Knowledge of Chest Pain and Myocardial Infarction (Heart Attack) and Demographic Variables: A Survey-Based Study