Heart Rate Response Patterns during Different Stages of Stress Phase of Exercise Electrocardiography Using Bruce Protocol in Normal Persons
There is no literature about different patterns of heart rate response during different stages of exercise stress electrocardiography using Bruce protocol in normal persons. We studied seventy five individuals after strictly excluding various conditions that could affect exercise capacity or heart rate response. Only ten persons had nearly linear progressive increase in heart rate. Other individuals had variable increase during different stages of stress. We observed eleven different types of responses. Our study shows that every individual has an intrinsic maximal heart rate that can be attained during exercise. Magnitude of the increase in heart rate during a particular stage of stress is influenced by the magnitude of increase in heart rate and percentage of age predicted maximal heart rate attained by the individual prior to that stage. It is also influenced by the relative activation of the sympathetic and the parasympathetic systems during and prior to a particular stage.
Introduction
Exercise electrocardiography is a non-invasive investigation frequently used for evaluation of cardiac patients. It has been realized that heart rate response to stress is important in evaluation of stress test [1]. Most of the literature on heart rate response is, however, focused around maximal heart rate attained (chronotropic incompetence) and reduction in heart rate during recovery [2, 3, 4, 5, 6]. Literature regarding heart rate response during various stages of stress during exercise test and their significance is very scanty and controversial. Savonen, et al. observed that slope of heart rate increase during exercise test was steeper in survivor when compared with those who died due to cardiovascular disease [7]. They also observed that blunted heart rate increase between 40% to 100% of maximal workload was associated with increased cardiovascular mortality. However, the study has some limitations. Only males were enrolled. Secondly, various conditions that could affect heart rate response to exercise were not excluded. Thirdly, during a conventional treadmill test, it is difficult to separate the slope of increase in heart rate up to 40% of work load from the slope after 40% of workload. Finally, no values of slope are given that can be used in clinical practice. Leeper, et al. have observed that heart rate rise at one third of total exercise capacity significantly predicted both, the all cause and cardiovascular risk [8]. Once again various conditions that could affect heart rate response and prognosis were not excluded and patients of suspected coronary artery disease were included. Other authorities also have some reservations about these conclusions [9]. On the other end, some authorities feel that heart rate increase at peak exercise is the most powerful predictor of cardiovascular prognosis [10]. These controversies are probably because of the fact that there are no studies on the patterns of increase in heart rate during different stage of stress in normal persons. Some data is available about normal range of heart rate for Ellestad protocol [11]. However, variations in patterns of increase in heart rate are not available.
It is taken for granted that heart rate increases linearly with workload in each individual Lipinski MJ [10]. While analyzing the reports of the treadmill stress test of persons without evidence of cardiac disease and without any evidence of myocardial ischemia during stress test, we observed that there was no uniform pattern of increase in heart rate during different stages of stress. This information may be of help in correct evaluation of significance of variations of response in persons with cardiovascular disorders. We, therefore, studied heart rate response patterns during different stages of Bruce protocol in normal persons.
Material and Methods
Inclusion criteria
- Absence of any cardiovascular symptoms.
- Normal clinical examination.
- Normal resting electrocardiogram.
- Normal 2 Dimensional and colour Doppler echocardiographic examination.
- No evidence of myocardial ischemia during exercise electrocardiography.
Exclusion criteria
- Patients with contraindications for exercise stress testing [12].
- Conditions that could affect heart rate response to exercise e.g: Autonomic neuropathy, patients with paced ventricular rhythm, patients taking beta blockers, ditiazem or verapamil.
- Patient who could not perform adequate exercise.
- Development of any of the following during stress test - angina, significant ST segment elevation or depression, frequent premature beats, bradyarrhythmia or tachyarrhythmia.
- Inconclusive test
Exercise stress test protocol
- Mason - Likar lead system was used [13].
- All treadmill stress tests were performed using Bruce protocol [14].
- Before starting exercise, ECGs were recorded in standing position and after hyperventilation. Changes after hyperventilation and before start of exercise are mentioned as “Ex-start”. This increase in heart rate is mentioned separately so that increase in heart rate due to standing and hyperventilation is not wrongly included as increase in heart rate during stage 1 of exercise.
- Stress test was symptom limited (exhaustive) rather than using age adjusted target heart rate to optimally assess maximal heart rate response and exclude any possibility of ischemia [15, 16, 17].
- Exercise was terminated if there was development of angina, any magnitude of ST- segment elevation, ST segment depression of 1mm, bundle branch block, increasing frequency of premature ventricular contractions or inability to continue exercise from any cause [18].
- Ten seconds of post exercise cool down walk was practiced to avoid post exertional dizziness or syncope due to sudden reduction in venous return or a vagal response [4].
- Recovery was usually recorded for six minutes. Recovery period was extended of indicated. Patients showing any evidence of ischemia during exercise or recovery was excluded from analysis because exercise induced myocardial ischemia could affect heart rate response to exercise.
Finally seventy five patients qualified for analysis. None of them has any abnormality as mentioned in inclusion and exclusion criteria.
Evaluation of heart rate
Computer derived heart rate was used for analysis. Heart rate was calculated manually if it was felt that there was some error in computer evaluation of heart rate. Age predicted maximal heart rate (MPHR) was calculated by formula suggested by Fox, et al. as 220-age [19].
Statistical analysis
Significance of changes in heart rate between different stages was evaluated using “Paired‘t’ test” [20]. Difference between different groups was evaluated using “unpaired‘t’ test” [21].
Lead selection for reproduction in figures
All twelve leads were recorded during the test and were analysed for any evidence of ischemia. However, to reduce the size of the figures, one lead has been selected from each group of leads to represent different surfaces of the heart.
Group of leads Lead selected for figure I, aVL I II, III, aVF aVF V1, V2 V1 V4, V5, V6 V5
Results
We observed various patterns of heart rate response during treadmill stress electrocardiography in normal persons. We have divided our observation in following groups.
- Progressive nearly linear increase in heart rate -type 1 response.
- Variations in heart rate response during stage 1 -type 2 responses.
- Variations in heart rate response during stage 2 -type 3 responses.
- Variations in heart rate response during stage 3 -type 4 responses.
- Variations in heart rate response during stage 4 -type 5 responses.
- Maximum increase in heart rate during stage 5 -type 6 responses. Details of various types of responses and there subdivisions are given below. Mean and standard deviation of age, resting supine heart rate, resting supine systolic blood pressure and resting supine diastolic blood pressure of different types of responses are shown in Table 1.
| Pattern of response | Number of cases (M/F) | Age (years) | Resting, Supine HR (bpm) | Resting, supine systolic BP (mm Hg) | Resting, supine diastolic BP (mm Hg) | ||||
|---|---|---|---|---|---|---|---|---|---|
| Range | mean±SD | Range | mean±SD | Range | mean±SD | Range | mean±SD | ||
| Type - 1 | (10) M- 9,F-1 | 23-65 | 42.8±13.03 | 50-108 | 74.4±16.55 | 120-140 | 125.6±6.85 | 80-90 | 82.6±4.32 |
| Type - 2a | (6)M- 5 ,F-1 | 28-56 | 37.0±10.17 | 60-90 | 74.8±12.96 | 110-140 | 123.33±10.32 | 60-90 | 78.33±11.01 |
| Type - 2b | (7) All males | 28-50 | 37.85±7.28 | 67-81 | 74.8±8.71 | 110-130 | 121.42±8.52 | 75-90 | 82.14±5.66 |
| Type - 2c | (4) All males | 26-57 | 35.5±14.70 | 53-89 | 70.0±16.26 | 120-130 | 127.5±5 | 80-90 | 82.5±5 |
| Type - 3a | (3) M- 2 ,F-1 | 26-56 | 44.66±16.28 | 61-78 | 72.33±9.81 | 130-140 | 136.66±5.77 | 80-90 | 83.33±5.76 |
| Type - 3b | (10) M- 8,F-2 | 27-73 | 43.0±13.20 | 63-96 | 77.5±10.78 | 100-158 | 112.5±20.07 | 60-75 | 79.1±11.89 |
| Type - 4a | (12) M- 9 ,F-3 | 20-65 | 37.75±14.43 | 67-108 | 79.75±10.93 | 110-140 | 125.5±7.82 | 70-90 | 83.0±6.23 |
| Type - 4b | (10) M- 7 ,F-3 | 24-64 | 45.63±12.37 | 65-106 | 81.45±12.81 | 110-140 | 123.63±12.13 | 80-96 | 86.0±7.18 |
| Type - 5a | (6) M- 5 ,F-1 | 22-65 | 44.9±12.86 | 63-91 | 73.2±9.6 | 120-130 | 122.5±4.29 | 70-90 | 79.5±6.07 |
| Type - 5b | (6) All males | 27-57 | 40.0±12.31 | 58-108 | 82.16±16.72 | 110-130 | 122.66±7.65 | 70-90 | 81.0±6.78 |
Table 1: Age, resting supine heart rate, resting supine systolic blood pressure and resting supine diastolic blood pressure in pe
Type 1 response - Progressive, nearly linear increase in heart rate during different stages of exercise
Changes in heart rate and percentage of MPHR during different stages and their statistical significance are shown in Table 2. There was progressive, nearly linear, increase in heart rate and percentage of age predicted maximal heart rate (MPHR). Increase at each stage was statically significant (P<0.001). Representative tracings of the average page of the treadmill test showing heart rate at the end of different stages of stress from one person with such response are shown in Figure 1.
| HR (bpm) (mean±SD) | Change in HR from previous stage (mean±SD) | P value | % of MPHR (mean±SD) | Change in % of MPHR from previous stage (mean±SD) | P value | |
|---|---|---|---|---|---|---|
| Supine | 74.4±16.55 | 17.3±3.97 | 42.05±9.96 | 11.4±5.03 | ||
| Ex start | 94.5±16.13 | 26.4±5.69 | <0.001 | 53.85±10.64 | 14.87±3.45 | <0.001 |
| Stage 1 | 115.7±20.32 | 21.2±9.16 | <0.001 | 65.63±11.69 | 11.98±5.25 | <0.001 |
| Stage 2 | 135.5±23.71 | 19.6±7.45 | <0.001 | 76.52±14.62 | 10.86±4.31 | <0.001 |
| Stage 3 | 161.4±28.17 | 26.4±5.69 | <0.001 | 91.40±17.47 | 14.87±3.45 | <0.001 |
Table 2: Change in heart rate and MPHR of persons with nearly linear, progressive increase in heart rate.
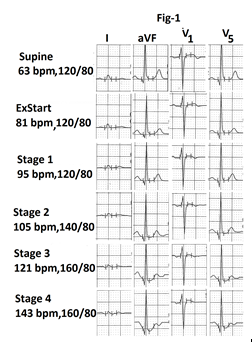
Figure1: Part of the average page of treadmill stress test report from a person with type 1 response. Heart rate shows progressive, nearly linear increase in heart rate. There is no evidence of exercise induced schemia in leads I, aVF, V1 and V5.
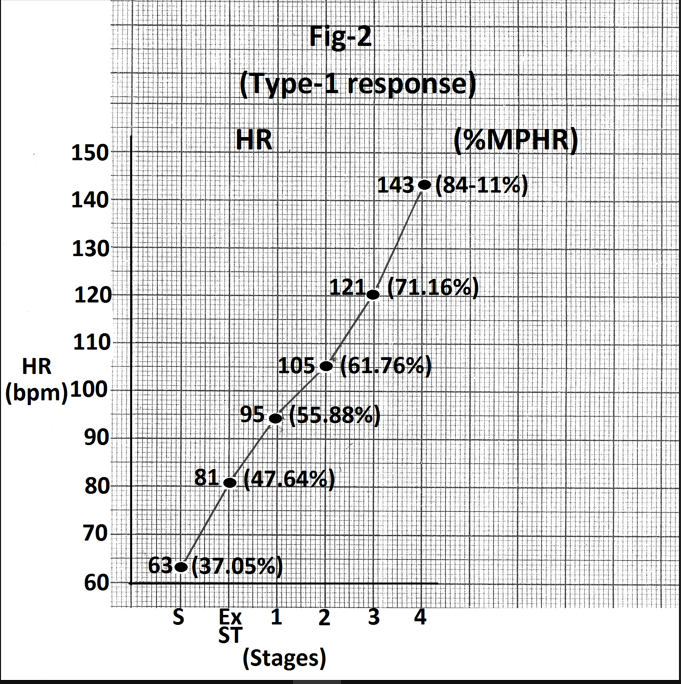
Representative tracings of leads I, aVF, V1 and V5 are also shown in Figure 1. There is no evidence of exercise induced myocardial ischemia. Graph showing heart rate and percentage of MPHR attained at the end of different stages from the same person is shown in Figure 2.
Type 2 a response - Maximum increase in heart rate in stage 1
Changes in heart rate and percentage of MPHR attained at the end of different stages are shown in Table 3. Difference in values between different stages and P values of differences are also shown in Table 3. Maximum increase in heart rate during stage 1 is highlighted. Maximum increase was seen during stage 1 (P< 0.001) Representative tracings of the average page of the treadmill test showing heart rate at the end of different stages of stress are shown in Figure 3. Representative tracings of leads I, aVF, V1 and V5 are also shown in Figure 3.
| Stage of exercise | HR (bpm) (mean±SD) | Change in HR from previous stage (mean±SD) | P value | % of MPHR (mean±SD) | Change in % of MPHR from previous stage (mean±SD) | P value |
|---|---|---|---|---|---|---|
| Supine | 74.83±20.79 | 40.84±6.29 | ||||
| Ex start | 89.66±20.79 | 14.83±9.7 | <0.01 | 48.80±7.40 | 7.96±5.03 | <0.02 |
| Stage 1 | 128.0±22.09 | 38.33±7.08 | <0.001 | 69.69±9.40 | 20.88±3.14 | <0.001 |
| Stage 2 | 148.66±16.16 | 20.66±8.38 | <0.01 | 81.11±5.78 | 11.43±4.9 | <0.01 |
| Stage 3 | 165.66±15.89 | 17±6.7 | <0.01 | 90.42±5.46 | 9.14±3.41 | <0.01 |
Table 3: Change in heart rate and MPHR of persons with maximum increase during stage-1.
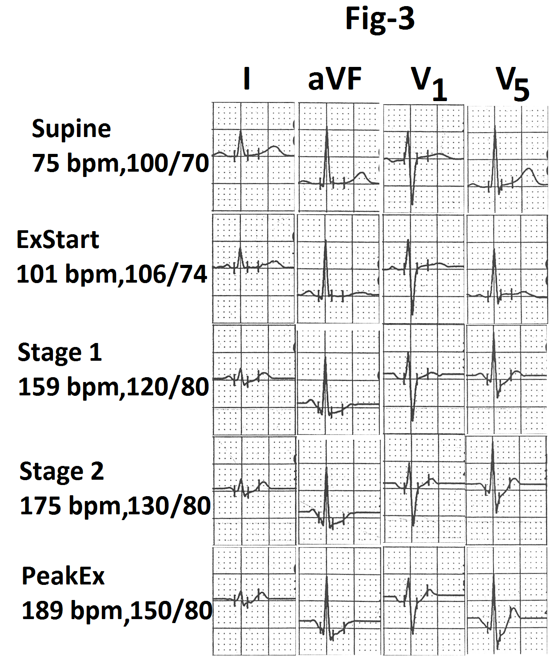
There is no evidence of exercise induced myocardial ischemia. Graph showing heart rate and percentage of MPHR attained at the end of different stages from same person is shown in Figure 4. There is significant increase in heart rate (88 beats per minute) during stage 1(marked).
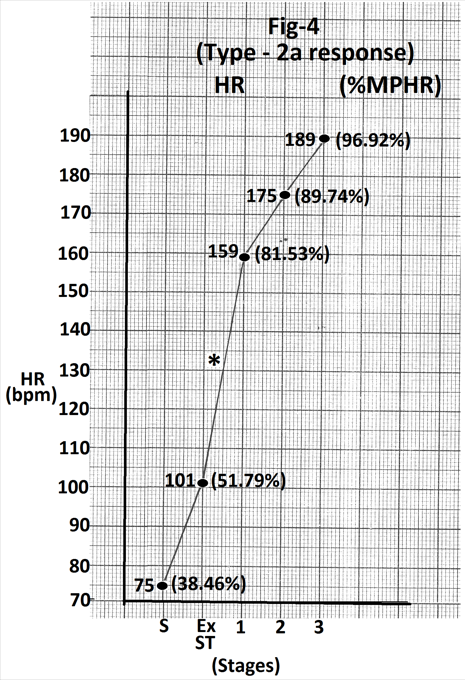
Figure 4: Graph of heart rate at the end of different stages of exercise of the person whose treadmill stress test report is shown in Figure 3. There is significant increase in heart rate (58 beats/min.) during stage 1(marked). Abbreviations - HR- heart rate, bpm- beats per minute S- Supine, Ex ST- Exercise start, ST - Stage of stress, MPHR- percentage of age predicted maximal heart rate.
Type 2 b responses - No increase or increase of less than 5 beats per minute during stage 1
Heart rate and percentage of MPHR attained at the end of different stages of stress are shown in Table 4. Differences in values from previous stage and P values of the differences are also shown in Table 4. Minimum increase in heart rate during stage 1 is highlighted. Representative tracing of the average page of the treadmill test showing heart rate at the end of different stages of stress are from one person with such response are shown in figure 5. Representative tracings of leads I, aVF, V1 and V5 are also shown in Figure 5. There is no evidence of exercise induced myocardial ischemia. Graph showing heart rate and percentage of MPHR attained at the end of different stages of stress from the same person is shown in Figure 6. There is no increase in heart rate during stage 1(marked). Was significant increase in heart rate (44bpm) from supine position (s) to starting of exercise (Ex start)? There was during stage 1.
| HR (bpm) (mean±SD) | Change in HR from previous stage (mean±SD) | P value | % of MPHR (mean±SD) | Change in % of MPHR from previous stage (mean±SD) | P value | |
|---|---|---|---|---|---|---|
| Supine | 74.5±8.71 | 41.03±5.16 | ||||
| Ex start | 110.42±17.99 | 38.83±14.38 | <0.001 | 60.74±10.58 | 21.46±8.16 | <0.01 |
| Stage 1 | 113.85±16.36 | 3.42±2.36 | <0.01 | 62.64±10.11 | 1.89±1.3 | <0.01 |
| Stage 2 | 130.14±16.17 | 14.85±11.46 | <0.02 | 71.69±10.64 | 9.04±6.93 | <0.02 |
| Stage 3 | 153.85±20.21 | 23.71±13.41 | <0.01 | 84.66±12.14 | 12.97±7.31 | <0.01 |
| Stage 4 | 172.16±21.60 | 18.5±9.89 | <0.01 | 93.60±12.15 | 10.01±5.12 | <0.01 |
Table 4: Change in heart rate and MPHR of persons with increase of less than 5 bpm during stage-1.
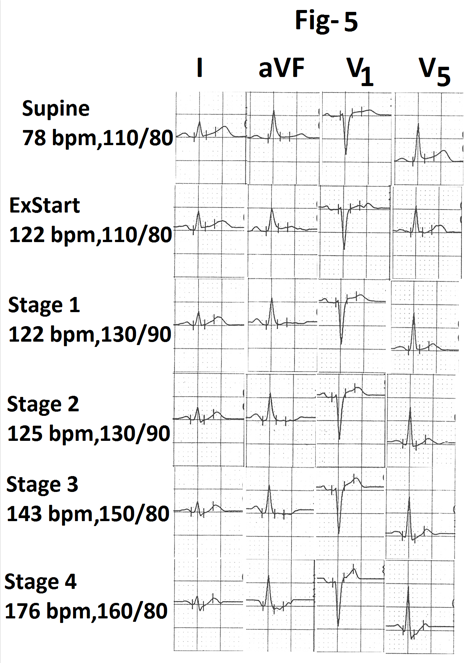
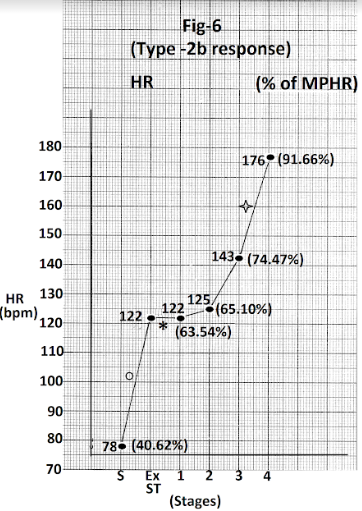
Figure 6: Graph of heart rate at the end of different stages of exercise of the person whose treadmill stress test report is shown in Figure 5. There is no increase in heart rate during stage 1(marked). There is significant increase. In heart rate (44 bpm) from supine position to start of exercise (marked O) and again in stage in (33 bpm) (marked). Abbreviations - HR- heart rate, bpm - beats per minute S- Supine, Ex ST- Exercise start, ST - Stage MPHR- percentage of age predicted maximal heart rate.
Type 2 c response - decrease in heart rate during stage 1
Heart rate and percentage of MPHR attained at the end of different stages of stress are shown in Table 5. Differences in values from previous stage and ‘P’ values of the differences are also shown in Table 5. Decrease in heart rate during stage 1 is highlighted. Representative tracings of the average page of the treadmill stress test showing heart rate at the end of different stages of stress from one person with such response are shown in Figure 7. Representative tracings of leads I, aVF, V1 and V5 are also shown in figure 7. There is no evidence of exercise induced myocardial ischemia. Graph showing heart rate and percentage of MPHR attained at the end of different stages from the same person is shown in Figure 8. There is decrease in heart rate (22bpm) during stage 1(marked). There is significant increase in heart rate (43bpm) from supine to start of exercise (marked). There is significant increase in heart rate (42 bpm) again during stage 4 (marked).
| HR (bpm) (mean±SD) | Change in HR from previous stage (mean±SD) | P value | % of MPHR (mean±SD) | Change in % of MPHR from previous stage (mean±SD) | P value | |
|---|---|---|---|---|---|---|
| Supine | 70.0±16.26 | |||||
| Ex start | 114.75±26.31 | 44.75±15.52 | <0.01 | 62.09±11.57 | 24.19±6.94 | <0.01 |
| Stage 1 | 102.75±27.47 | 12±3.26 | <0.01 | 55.81±13.49 | 6.38±4.79 | <0.05(NS) |
| Stage 2 | 129.5±36.59 | 26.75±17.95 | <0.05 | 70.36±16.78 | 14.56±9.38 | 0.05 |
| Stage 3 | 150.5±41.74 | 21±7.87 | <0.01 | 81.87±20.78 | 11.51±4.31 | <0.02 |
| Stage 4 | 170.75±36.48 | 20.25±16.49 | <0.01 | 92.86±12.55 | 10.98±8.81 | <0.05(NS) |
Table 5: Change in heart rate and MPHR of persons with decrease during stage-1.
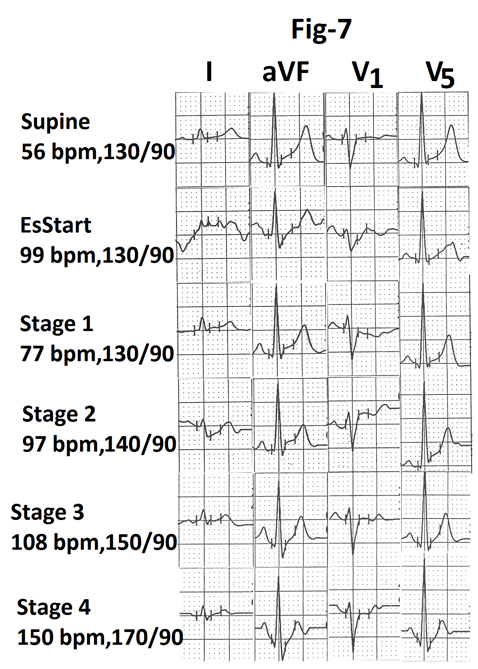
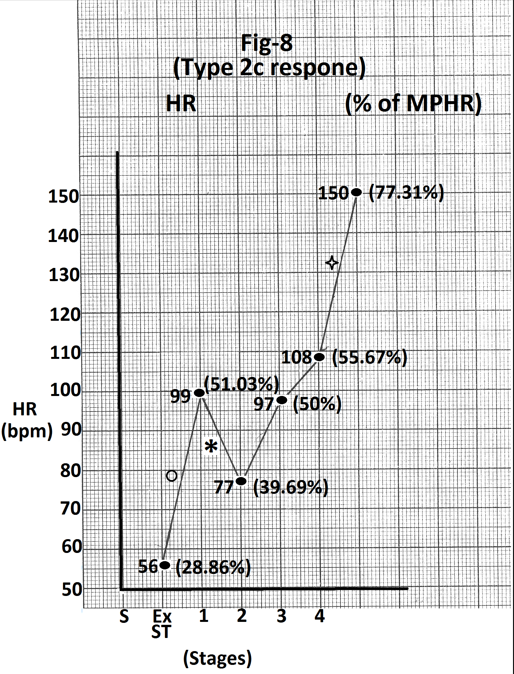
Figure 8: Graph of heart rate at the end of different stages of exercise of the person whose treadmill stress test report is shown in Figure 7. There is significant increase in heart rate from supine to pre-exercise (43 bpm) (marked ‘O’). There is decrease in heart rate (22 bpm) during stage 1(marked). There is significant increase in heart rate (42 bpm) again during stage 4 (marked). Abbreviations’ HR- heart rate, bpm- beats per minute, S- Supine, Ex ST - Exercise start, ST - Stage of stress.
Type 3a response -Maximum increase in heart rate during stage2
Heart rate and percentage of MPHR attained at the end of different stages of stress are shown in Table 6. Differences in values from previous stage and ‘P’ values of the differences are also shown in Table 6. Change in heart rate during stage 2 is highlighted. Representative tracings of the average page of the treadmill stress test showing heart rate at the end of different stages of stress from one person with such response are shown in Figure 9. Representative tracings of leads I, aVF, V1 and V5 are also shown in Figure 9. There is no evidence of exercise induced myocardial ischemia. Graph showing heart rate and percentage of MPHR attained at the end of different stages from same person is shown in Figure 10. There is significant increase (27 bpm) in heart rate during stage 2(marked).
| Stage of exercise | HR (bpm) (mean±SD) | Change in HR from previous stage (mean±SD) | P value | % of MPHR (mean±SD) | Change in % of MPHR from previous stage (mean±SD) | P value |
|---|---|---|---|---|---|---|
| Supine | 72.33±9.81 | 41.35±5.7 | ||||
| Ex start | 108.33±31.21 | 36±26.28 | >0.10 (NS) | 61.11±11.81 | 19.89±12.49 | >0.10(NS) |
| Stage 1 | 109.66±14.20 | 1.33±16.25 | >0.10(NS) | 62.42±2.78 | 7.49±2.31 | <0.05 |
| Stage 2 | 149.33±25.32 | 39.66±12.5 | <0.05 | 85.01±7.98 | 16.23±7.69 | >0.05(NS) |
| Stage 3 | 171.33±30.53 | 22±9.41 | >0.05 (NS) | 97.31±10.38 | 12.58±7.14 | >0.05(NS) |
Table 6: Change in heart rate and MPHR of persons with maximum increase during stage-2.
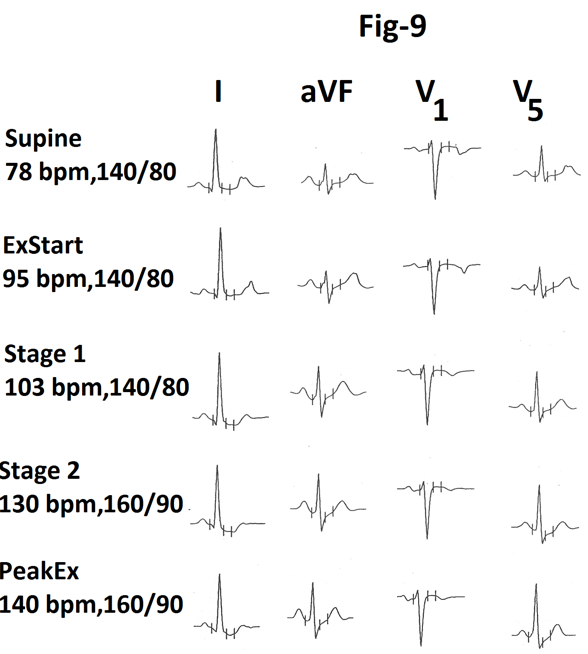
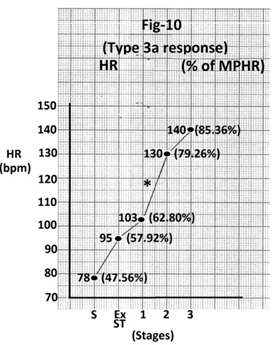
Figure 10: Graph of heart rate at the end of different stages of exercise of the person whose treadmill stress test report is shown in Figure 9. There is significant increase in heart rate (27 bpm) during stage 2 (marked). Abbreviations - HR- heart rate, bpm- beats per minutes, S- Supine, Ex ST - Exercise start, ST - Stage of stress, MPHR- percentage of age predicted maximal heart rate.
Type 3b response - No increase or increase of less than 10 bpm increase during stage 2
Heart rate and percentage of MPHR attained at the end of different stages of stress are shown in Table 7. Differences in values from the previous stage and ‘P’ values of the differences are also shown in Table 7. There was significantly less increase in heart rate and percentage of MPHR during stage 2. It is highlighted. Representative tracings of the average page of the treadmill stress test showing heart rate at the end of different stages of stress from two persons with such response are shown in Figures 11, 13. There is significantly less increase in heart rate during stage 2. Graph showing heart rate and percentage of MPHR attained at the end of different stages of stress from these two cases are shown in Figure 12, 14. In Figure 12 there is significant increase in heart rate (55 bpm) during stage 1(marked). This is followed by no increase in stage 2 (marked). In Figure 14 there is significant increase in heart rate (47 bpm) from supine to start of exercise (marked). It is followed by less increase in stage 1 and minimal increase (7 bpm) in stage 2 (marked).
| Stage of exercise | HR (bpm) (mean±SD) | Change in HR from previous stage (mean±SD) | P value | % of MPHR (mean±SD) | Change in % of MPHR from previous stage (mean±SD) | P value |
|---|---|---|---|---|---|---|
| Supine | 77.5±10.78 | 43.88±6.91 | ||||
| Ex start | 105.88±19.16 | 45.11±33.52 | <0.01 | 60.62±11.17 | 17.55±10.1 | <0.01 |
| Stage 1 | 125.9±19.96 | 20±19.46 | 0.01 | 76.93±13.37 | 17.21±16.69 | <0.01 |
| Stage 2 | 130.8±21.42 | 4.9±3.1 | <0.001 | 73.56±11.20 | 7.55±10.39 | 0.05 |
| Stage 3 | 145.7±21.08 | 14.9±6.98 | <0.001 | 82.02±9.68 | 8.26±3.76 | <0.001 |
| Stage 4 | 160.25±15.81 | 13±13.75 | <0.05 | 88.23±10.10 | 7.48±6.31 | <0.05 |
Table 7: Change in heart rate and MPHR of persons with no increase of increase of less than 10 bpm during stage-2.
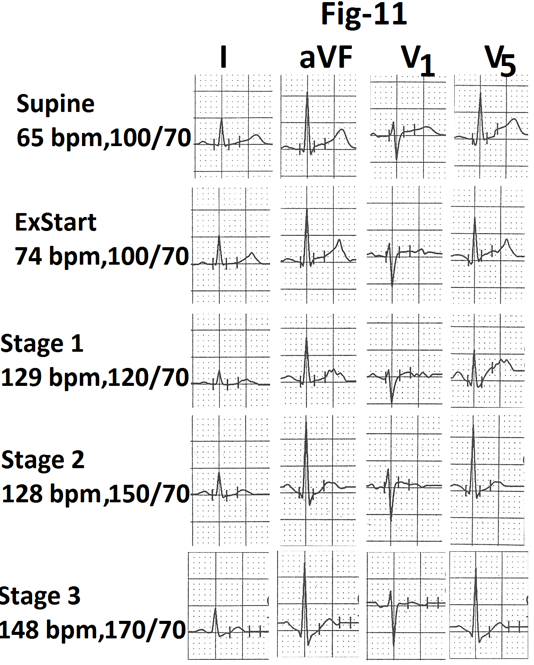
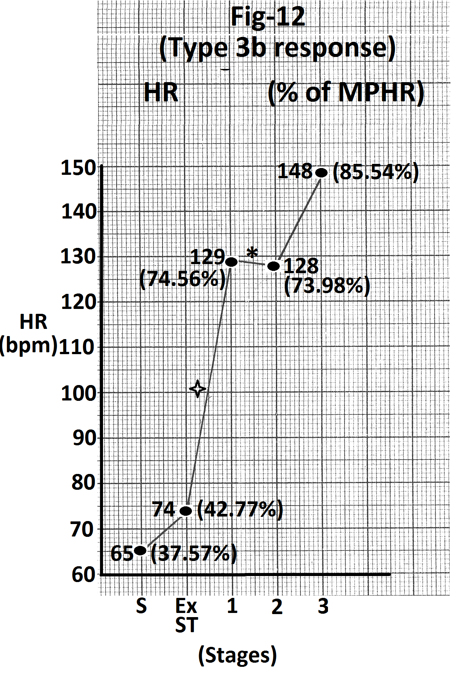
Figure 12: Graph of heart rate at the end of different stages of exercise of the person whose treadmill stress test report is shown in Figure 11. There is no increase in heart rate during stage 2 (marked).There is significant increase (55 beats per minute) in heart rate during stage 1 (marked). Abbreviations- HR- heart rate, bpm- beats per minute, S- Supine, Ex ST - Exercise start, ST - Stage of stress, MPHR- percentage of age predicted maximal heart rate.
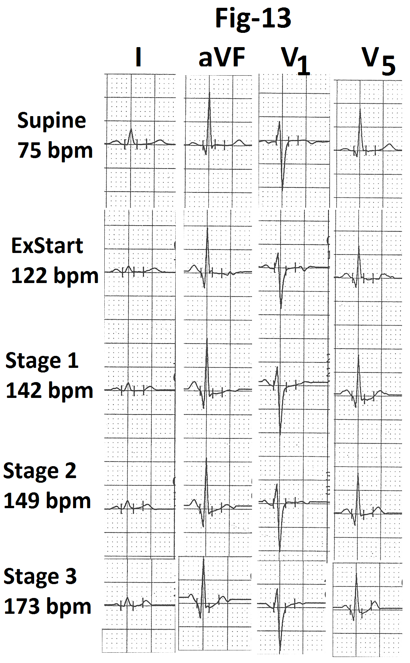
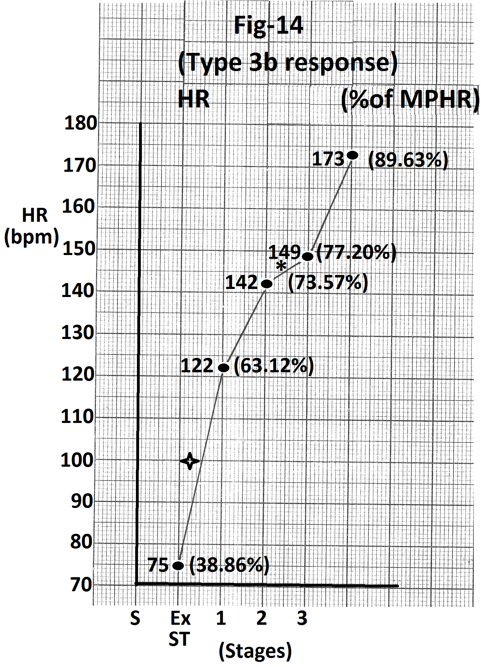
Figure 14: Graph of heart rate at the end of different stages of exercise of the person whose treadmill stress test report is shown in Figure 13. There is minimal increase (7beats/minute) during stage 2 (marked). There is significant increase in heart rate (47 beats/minute) from supine position to start of exercise (marked). Abbreviations - HR- heart rate, bpm- beats per minute, S- Supine, Ex ST - Exercise start, ST - Stage of stress, MPHR- percentage of age predicted maximal heart rate.
Type 4a response -Maximum increase in heart rate during stage3
Heart rate and percentage of MPHR attained at the end of different stages of stress of the treadmill test are shown in Table 8. Differences in values from the previous stage and ‘P’ values of the differences are also shown in Table 8. There was significant increase in heart rate during stage 3. It is highlighted. Representative tracings of the average page of the treadmill stress test showing heart rate at the end of different stages of stress from one such case are shown in Figure 15. Representative tracings of leads I, aVF, V1 and V5 are also shown in Figure 15. There is no evidence of exercise induced ischemia. Graph showing heart rate and percentage of MPHR attained at the end of different stages of stress from the same person are shown in Figure 16. There is significant increase in heart rate (39 bpm) during stage 3(marked).
| HR (bpm) (mean±SD) | Change in HR from previous stage (mean±SD) | P value | % of MPHR (mean±SD) | Change in % of MPHR from previous stage (mean±SD) | P value | |
|---|---|---|---|---|---|---|
| Supine | 79.75±10.93 | 44.07±7.41 | ||||
| Ex start | 100.91±16.81 | 20.91±10.14 | <0.001 | 55.70±10.24 | 11.64±5.48 | <0.001 |
| Stage 1 | 109.25±19.46 | 17.08±12.54 | <0.001 | 65.82±9.43 | 11.6±3.2 | <0.001 |
| Stage 2 | 136.16±19.56 | 17.33±4.63 | <0.001 | 75.29±12.94 | 9.46±3.38 | <0.001 |
| Stage 3 | 171.91±23.84 | 35.75±14.4 | <0.001 | 94.68±14.86 | 19.35±7.16 | <0.001 |
| Stage 4 | 184.14±14.89 | 11.48±7.56 | <0.01 | 95.85±8.6 | 6.22±3.28 | <0.01 |
Table 8: Change in heart rate and MPHR of persons with maximum increase in stage-3.
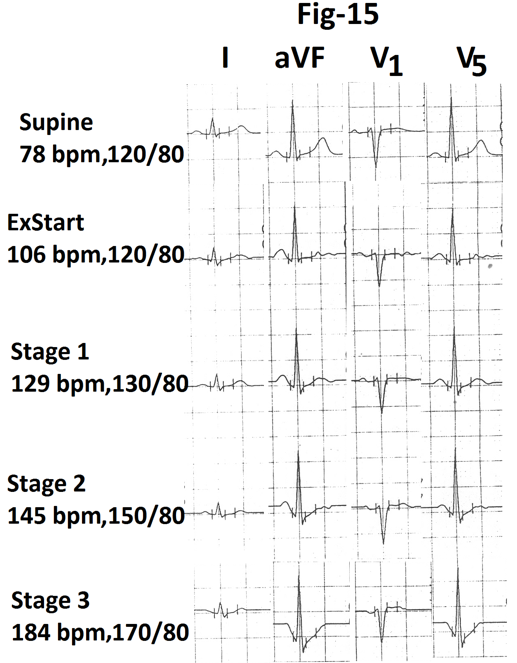
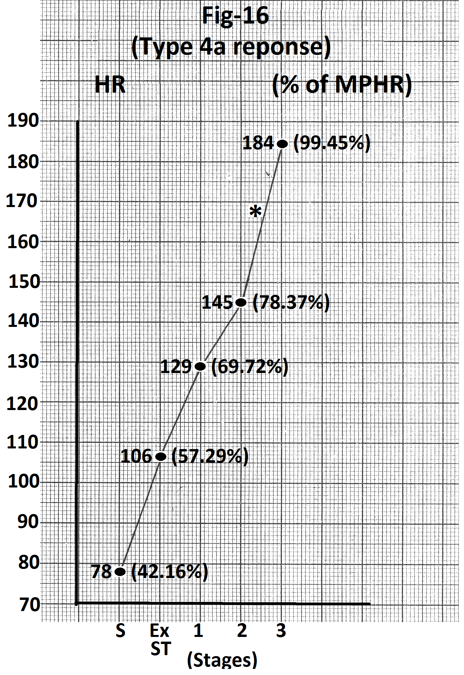
Figure 16: Graph of heart rate at the end of different stage of exercise of the person whose treadmill stress test report is shown in figure 15. There is significant increase in heart rate (39 beats per minute) during stage 3 (marked). Abbreviations- HR- heart rate, bpm- beats per minute, S- Supine, Ex ST - Exercise start, ST - Stage of stress, MPHR- percentage of age predicted maximal heart rate.
Type 4b response - Less than 10 bpm increase in heart rate during stage 3
Heart rate and percentage of MPHR attained at the end of different stages of stress are shown in Table 9. Differences in values from previous stage and ‘P’ values of the differences are also shown in Table 9. There was significantly less increase in heart rate during stage 3. It is highlighted. Representative tracings of the average page of the treadmill stress test showing heart rate at the end of different stages of stress from one case showing such response are shown in Figure 17. Representative tracings of leads I, aVF, V1 and V5 are also shown in Figure 17. There is no evidence of exercise induced myocardial ischemia. Graph showing heart rate and percentage of MPHR attained at the end of different stages of stress from the same person are shown in Figure 18. There is minimal increase in heart rate (9 bpm) during stage 3(marked).
| Stage of exercise | HR (bpm) (mean±SD) | Change in HR from previous stage (mean±SD) | P value | % of MPHR (mean±SD) | Change in % of MPHR from previous stage (mean±SD) | P value |
|---|---|---|---|---|---|---|
| Supine | 81.45±12.81 | 46.80±7.38 | ||||
| Ex start | 102.0±15.93 | 22.36±10.81 | <0.001 | 58.50±8.6 | 11.7±7 | <0.001 |
| Stage 1 | 133.0±25.0 | 31±14.53 | <0.001 | 76.25±13.79 | 17.76±8.42 | <0.001 |
| Stage 2 | 151.81±23.15 | 18.63±4.32 | <0.001 | 87.16±12.77 | 10.57±3.07 | <0.001 |
| Stage 3 | 160.0±21.67 | 8.36±4.29 | <0.001 | 91.92±12.58 | 4.8±2.65 | <0.001 |
| Stage 4 | 159.0±17.60 | 12.5±4.04 | <0.01 | 89.05±3.06 | 7.09±2.51 | <0.02 |
Table 9: Change in heart rate and MPHR of persons with less than 10 bpm increase in heart rate in stage 3.
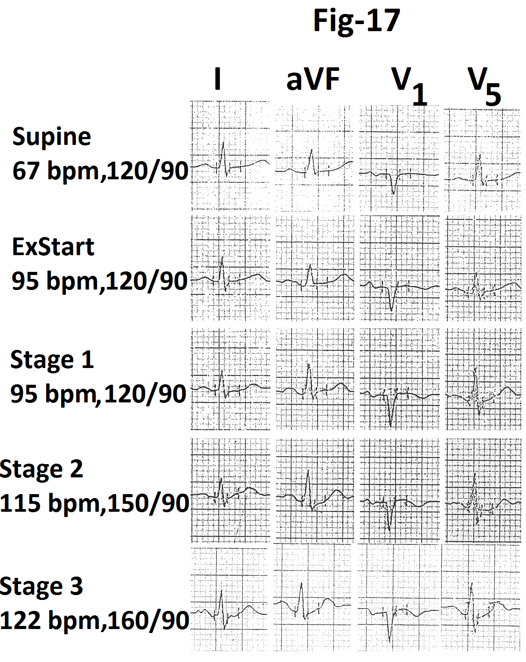
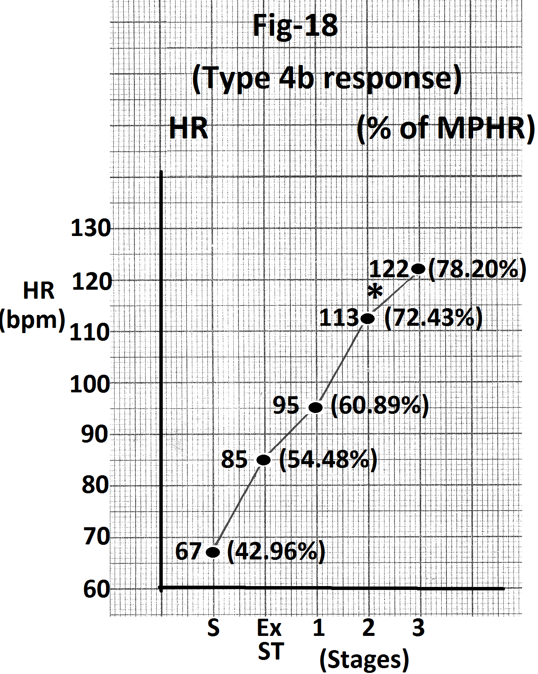
Figure 18: Graph of heart rate at the end of different stages of exercise of the person whose treadmill stress test report is shown in Figure 17. There is minimal increase in heart rate (9 beats per minute) during stage 3(marked). Abbreviations- HR- heart rate, bpm- beats per minute, S- Supine, Ex ST - Exercise start, ST - Stage of stress, MPHR- percentage of age predicted maximal heart rate.
Type 5a response - Maximum increase in heart rate during stage 4/peak exercise
Heart rate and percentage of increase in MPHR attained at the end of different stages of stress are shown on Table 10. Differences in values from previous stage and ‘P’ values of the differences are also show in Table 10. There was maximum increase in heart rate during stage 4. It is highlighted. Representative tracings of the average page of the treadmill stress test showing heart rate at the end of different stages of stress from one case are shown in Figure 19. Representative tracings of leads I, aVF, V1 and V5 are also shown in Figure 19. There is no evidence of exercise induced myocardial ischemia. Graph showing heart rate and percentage of MPHR attained at the end of different staged of stress from the same case are shown in Figure 20. Maximum increase in heart rate (35 bpm) is seen during stage 4(marked).
| HR (bpm) (mean±SD) | Change in HR from previous stage (mean±SD) | P value | % of MPHR (mean±SD) | Change in % of MPHR from previous stage (mean±SD) | P value | |
|---|---|---|---|---|---|---|
| Supine | 73.2±9.6 | 42.07±6.82 | ||||
| Ex start | 91.6±10.37 | 18.4±5.85 | <0.001 | 52.62±7.68 | 10.54±3.45 | <0.001 |
| Stage 1 | 106.3±14.44 | 14.7±7.51 | <0.001 | 61.32±9.72 | 8.7±4.29 | <0.001 |
| Stage 2 | 117.5±16.47 | 13.6±7.8 | <0.001 | 67.38±10.62 | 14.21±3.96 | <0.001 |
| Stage 3 | 142.1±21.37 | 24±4.34 | <0.001 | 81.60±14.04 | 6.06±3.23 | <0.001 |
| Stage 4 | 159.66±17.88 | 28±7.8 | <0.001 | 87.90±6.56 | 15.45±2.02 | <0.001 |
Table 10: Change in heart rate and MPHR of persons with maximal increase in stage 4
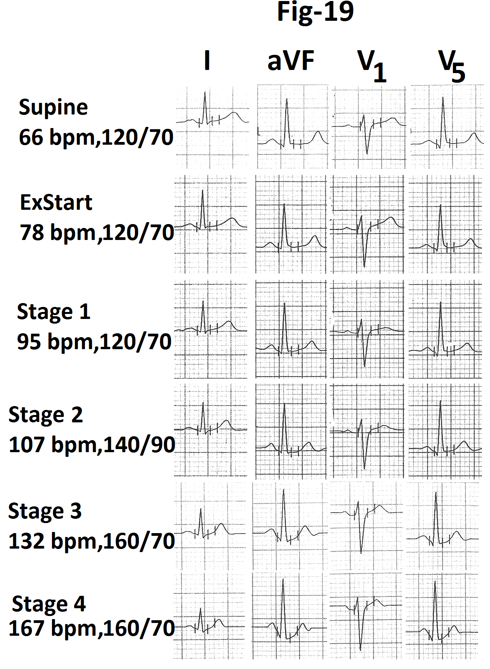
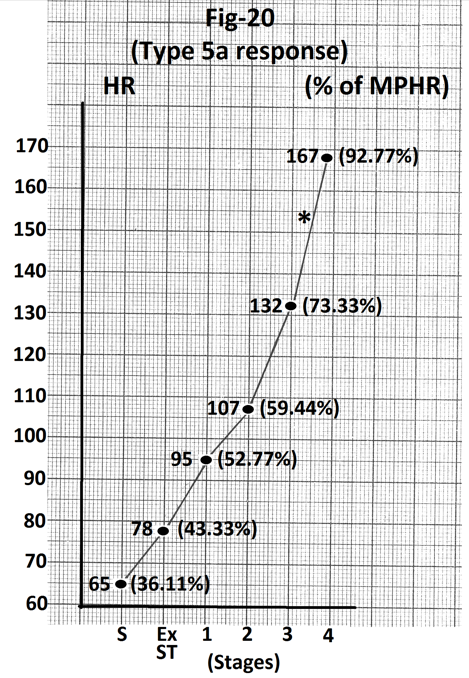
Figure 20: Graph of heart rate at the end of different stages of exercise of the person whose treadmill stress test report is shown in Figure 19. There is maximal increase in heart rate (35 beats per minute) during stage 4(marked). There is relatively less increase in heart rate up to end of stage 2. Abbreviations- HR- heart rate, bpm- beats per minute, S- Supine, Ex ST - Exercise start, ST - Stage of stress, MPHR- percentage of age predicted maximal heart rate.
Type 5b response - Decrease, no increase or increase of less than 5 bpm during stage 4
Heart rate and percentage of MPHR attained at the end of different stages of stress are shown in Table 11. Differences in values from previous stage and ‘P’ values of the difference are also shown in Table 11. Decrease in heart rate during stage 4 is highlighted. Representative tracings of the average page of the treadmill stress test showing heart rate at the end of different stages of stress are shown in Figure 21. Representative tracings of leads I, aVF, V1 and V5 are also shown. There is no evidence of exercise induced myocardial ischemia. Graph showing heart rate and percentage of MPHR attained at the end of different stages of stress and during stage 4 from the same case are shown in Figure 22. There is decrease of 2 bpm during stage 4(marked).
| Stage of exercise | HR (bpm) (mean±SD) | Change in HR from previous stage (mean±SD) | P value | % of MPHR (mean±SD) | Change in % of MPHR from previous stage (mean±SD) | P value |
|---|---|---|---|---|---|---|
| Supine | 82.16±16.72 | 45.58±8.61 | ||||
| Ex start | 111.0±17.49 | 28.83±11.48 | <0.01 | 61.43±6.91 | 15.85±5.65 | 0.001 |
| Stage 1 | 130.16±22.92 | 17.5±17.68 | >0.05(NS) | 72.21±11.09 | 13.74±3.66 | <0.001 |
| Stage 2 | 151.0±25.17 | 17.83±10.23 | <0.01 | 83.97±13.23 | 11.75±5.58 | <0.001 |
| Stage 3 | 184.0±23.91 | 33±20.51 | <0.02 | 98.75±7.42 | 18.13±10.42 | <0.001 |
| Stage 4 | 183.0±24.49 | 0.6 | >0.10 (NS) | 101.73±10.61 | 0.28 | >0.10 (NS) |
Table 11: Change in heart rate and MPHR of persons with decrease, no increase or increase of less than 5 bpm in stage 4.
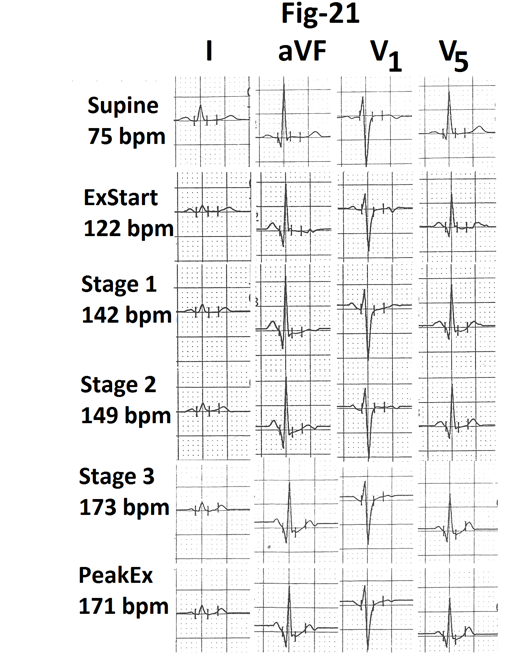
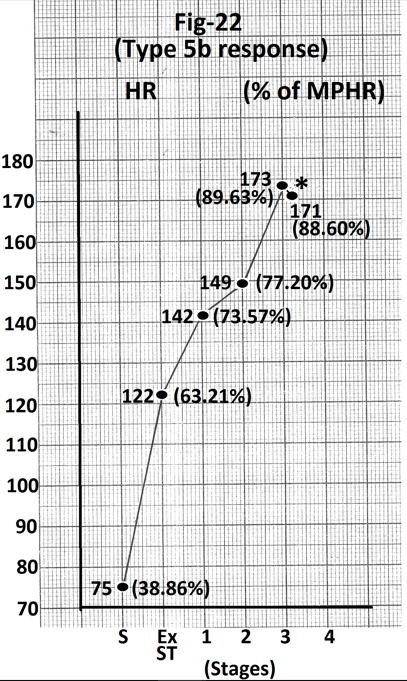
Figure 22: Graph of heart rate at the end of different stages of exercise of the person whose treadmill stress test report is shown in Figure 21. There is decrease of 2 beats per minute during stage 4(marked). Abbreviations- HR- heart rate, bpm- beats per minute, S- Supine, Ex ST - Exercise start, ST - Stage of stress, MPHR- percentage of age predicted maximal heart rate.
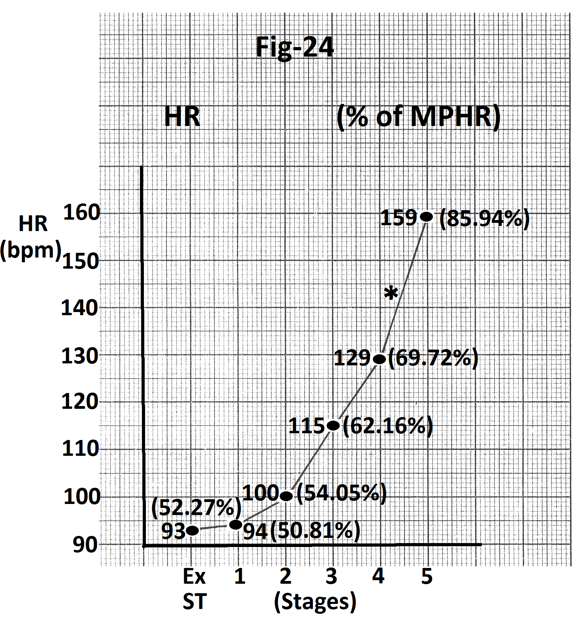
Type 6a response - Maximum increase in stage 5
One person completed stage 5. He had maximal increase in heart rate during stage 5. Tracings of the average page of
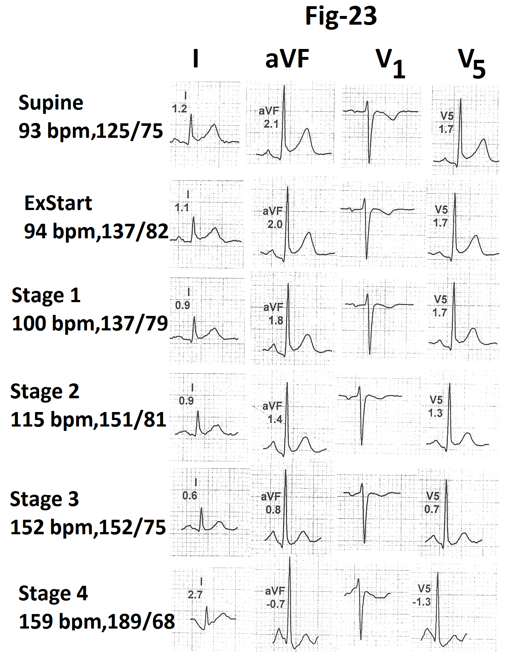
the treadmill stress test report are shown in Figure 23 and graphic representation is shown in Figures 24. Maximum increase in heart rate (30 bpm) occurred during stage 5(marked).
Comparison of age, resting supine heart rate and resting supine blood pressure amongst groups showing maximal increase in heart rate during different stages.
| Parameter | Type 1 response (A) | Type 2a response (B) | Type 3a response (C) | Type 4a response (D) | Type 5a response (E) |
|---|---|---|---|---|---|
| Age (Years) (mean + SD) | 42.8±13.03 | 37.0±10.17 | 44.66±16.28 | 37.75±14.43 | 44.9±12.86 |
| Resting heart rate (bpm) (mean + SD ) | 74.4±16.13 | 74.83±12.96 | 108.33±31.21 | 79.75±10.93 | 73.2±9.6 |
| Resting supine blood pressure (mm Hg) Systolic (mean + SD) | 125.6±6.85 | 123.33±10.32 | 136.66±5.77 | 125.0±7.82 | 122.5±4.24 |
| Diastolic (mean + SD) | 82.6±4.32 | 78.33±11.01 | 83.33±5.76 | 83.0±6.23 | 79.5±6.07 |
Table 12(a): Comparison of age, resting heart rate and resting supine blood pressure in groups showing maximal increase in heart rate during different stages.
| Parameter | (A) v/s (B) | (A) v/s (C) | (A) v/s (D) | (A) v/s (E) | (B) v/s (C) | (B) v/s(D) | (B) v/s (E) | (C) v/s (D) | (C) v/s(E) | (D) v/s (E) |
|---|---|---|---|---|---|---|---|---|---|---|
| Age | > 0.10(NS) | > 0.10(NS) | > 0.10(NS) | > 0.10(NS) | > 0.10(NS) | > 0.10(NS) | > 0.10(NS) | > 0.10(NS) | > 0.10(NS) | > 0.10(NS) |
| Resting supine heart rate | > 0.10(NS) | > 0.10(NS) | > 0.10(NS) | > 0.10(NS) | > 0.10(NS) | > 0.10(NS) | > 0.10(NS) | > 0.05(NS) | > 0.10(NS) | > 0.10(NS) |
| Resting supine blood pressure Systolic | > 0.10(NS) | < 0.01 | > 0.10(NS) | > 0.10(NS) | > 0.10(NS) | > 0.10(NS) | > 0.10(NS) | < 0.02 | < 0.01 | > 0.10(NS) |
| Diastolic | > 0.10(NS) | > 0.10(NS) | > 0.10(NS) | > 0.10(NS) | > 0.10(NS) | > 0.10(NS) | > 0.10(NS) | > 0.10(NS) | > 0.10(NS) | > 0.10(NS) |
Table 12(b): P value of difference in various parameters between different groups.
Comparison is shown in Table 12a and ‘P’ values of differences among different groups are shown in Table 12b. Individual with type 3a response (maximum increase in heart rate during stage 2) had significantly higher supine systolic blood pressure than other groups (P<0.02 to < 0.01). However, the number of patients in this group was very small. This could be affecting the result. There was no
Discussion
Type 1 response (Nearly linear increase in heart rate with increasing work load)
Progressive, nearly linear increase in heart rate is a usual response in persons with normal conditioning and normal autonomic response. Heart rate increases with increasing work load [10]. We observed this type of response only in 13.8% of ‘normal’ individuals.
Type 2a response (Maximum increase in heart rate during stage 1)
These individuals had relatively less increase in heart rate (14.83+9.70 beats per minute) in pre-exercise period i.e. on standing from supine position (Table 3). This was followed by significantly greater increase (38.33+7.08 beats per minute) during stage 1 (Table 3) so that by the end of stage 1, their heart rate reached around 69% of age predicted maximal heart rate (MPHR) (Table 3). This value was nearly similar to the percentage of age predicted maximal heart rate (around 65%) attained by individuals with type 1 response (Table 2). This shows that the overall heart rate response to exercise was normal. Maximum increase in heart rate during stage 1 was only a compensation of relatively less increase in heart rate during pre-exercise period. Percentage of age predicted maximal heart rate attained by these individuals by the end of stage 2 and stage 3 was similar to the heart rates attained by individuals of type 1 response. Abnormal increase in heart rate during stage 1 is suggestive of physical deconditioning [9]. Such response can also be seen in persons who are anxious about the stress test [22]. Such a response does not suggest underlying cardiovascular disease and does not have any adverse prognostic significance [9].
Type 2b response (Minimum increase in heart rate during stage 1)
These individuals had significant increase in heart rate during pre-exercise period (38.83±14.38 beats per minute, (Table 4)) they had already attained nearly 60% of their age predicted maximal heart rate before start of exercise (Table 4). Therefore, further increase during stage 1 was minimal. Percentage of age predicted maximal heart rate at the end of stage 1 was nearly similar to individuals with type 1 response (Table 2). This shows that relatively less increase in heart rate during stage 1 was only a compensation for relatively greater increase during pre-exercise period. Percentage of age predicted maximal heart rate attained by the end of stage 2 and 3 was nearly similar to that of individuals with type significant difference in age, resting supine heart rate and resting supine diastolic blood pressure between different groups (Tables 12a, 12b).
1 response (Table 2). This shows that the overall heart rate response to exercise was normal.
Normally the heart rate increases by about 20 beats per minute on standing from supine position. This is because of gravity induced pooling of blood in lower limbs and inferior mesenteric region. Reduced venous return results in reflex increase in sympathetic activity and heart rate to maintain cardiac output [23, 24]. Postural orthostatic tachycardia syndrome can be another cause of abnormal increase in heart rate without reduction of more than 20 mm Hg in systolic blood pressure on standing from supine position. Relatively greater increase in heart rate on standing, therefore, only suggests a variation in autonomic response and does not suggest underlying cardiovascular disease.
Type 2c response (Decrease in heart rate during stage 1)
These individuals had still greater increase in heart rate on standing from supine position (44.75±15.52 beats per minute, (Table 5)) as compared to individuals with type 2b response (Table 4). They had already attained a higher percentage of age predicted maximal heart rate (62.09±11.57%, (Table 5)) before start of exercise. Therefore, these patients did not require increasing their heart rate further during stage 1. On the contrary, the heart rate showed mild decrease. Initial significant increase in heart rate due to anxiety or reflex sympathetic activation due to pooling of blood in lower limbs tends to stabilize in 30 to 60 seconds [22, 23]. This result in decrease in heart rate during stage 1 in these individuals. However by the end of stage 1, 2 and 3. These individuals attained age predicted maximal heart rate similar to individuals with type 1 response. This shows that the overall heart rate response to exercise was normal in these individuals. Decrease in heart rate during stage 1 was only a compensation of significantly greater increase in heart rate before start of exercise.
Type 3a response (Maximum increase in heart rate during stage 2)
These individuals had significant increase in heart rate (36±26.28 beats per minute) and age predicted maximal heart rate (19.89±12.49%) before onset of exercise Table 6 as compared to individuals with type 1 response (Table 2). This was followed by significantly less increase during stage 1. This was probably compensatory to significant increase before start of exercise with the result that at the end stage 1, their age predicted maximal heart rate (62.42±9.78%, (Table
6)) was nearly similar to the percentage of MPHR attained by individuals with type 1 response. Subsequently, the heart rate of these individuals increased during stage 2 to the extent that their heart rate at the end of stage 2 exceeded Table 6 heart rate and percentage of MPHR attained by individuals with type 1 response (Table 2). Thus maximum increase in heart rate during stage 2 was partly because of increased work load and partly compensation of relatively less increase during stage 1. Heart rate and percentage of MPHR attained at the end of stage 3 was nearly identical to that attained by individuals with type 1 response. Thus the total increase in heart rate and percentage of MPHR attained at the peak exercise were normal.
Type 3b response (No or minimal increase in heart rate during stage 2)
These individuals also had significant increase in heart rate before exercise (45.11±33.52 beats per minute, (Table 7)) However, they had further increase in heart rate during stage 1 (20±19.46 beats per minute, (Table 7)). This increase during stage 1 was nearly equal to the increase during stage 1 in individuals with type 1 response (21.2±9.16 beats per minute, (Table 2)) with the result that these individuals attained nearly 76% of age predicted maximal heart rate by the end of stage 1 (Table 7). This was much higher than the age predicted maximal heart rate attained by individuals with type 1 response (65.63±11.69 %, (Table 2)). This resulted in significantly less increase in heart rate during stage 2.
Type 4a response (maximum increase in heart rate during stage 3)
These individuals had increase in heart rate that was similar to individuals with type 1 response up to stage 2. They attained nearly similar percentage of age predicted maximal heart rate by the end of stage 2 (75.29±12.94% (Table 8) v/s 76.52±14.62% (Table 1)). Subsequently these individuals had significantly greater increase in heart rate during stage 3 (35.75±14.40 beats per minute (Table 8). type 1 as compaired to 26.4+5.69 beats per minute in individuals with response (Table 2)). These individuals attained higher percentage of age predicted maximal heart rate by the end of stage 3 (94.68+14.86%, Table 8) as compared to individuals with type 1 response (76.52±14.62%, (Table 2)). This suggests that these individuals were probably less well conditional to higher levels of physical stress and, therefore, had greater increase in sympathetic drive at higher levels of physical stress.
Type 4b response (Increase of less than 10 beats per minute during stage 3)
These individuals had relatively greater increase during stage 1 (31±14.53 beats per minute (Table 9)) as compared to individuals with type 1 response (21.2±9.16 beats per minute (Table 2)). Increase during stage 2 was, however, nearly similar to individuals with type 1 response with the result that by the end of stage 2, these individuals had already attained nearly 90% (97.16±12.77%) of their age predicted maximal heart rate (Table 9). Therefore, further increase in heart rate during stage 3 was much less as compared to individuals with type 1 response.
Type 5a response (Maximum increase in heart rate during stage 4)
These individuals had progressive increase in heart rate up to stage 3 (Table 10). However, the magnitude of increase was relatively less than in individuals with type 1 response (Table 2). Their heart rate at the end of stage 3 was only around 80% of age predicted maximal heart rate. Therefore, these individuals had greater margin to further increase their heart rate till they attained their age predicted maximal heart rate. These individuals could, therefore, continue their exercise when the workload was increased further during stage 4. Thus, it was a normal response in physically conditioned individuals.
Type 5b response (Decrease, no increase or minimal increase during stage 4)
These individuals had significantly greater increase in heart rate before and during stage 3 (33±20.51 beats per minute, (Table 11)) as compared to individuals with type 5a response (Table 10). Their heart rate at the end of stage 3 was already more than 90% of age predicted maximal heart rate (98.79±7.42%, (Table 11)). Further increase in heart rate was not possible. Some persons had decrease in heart rate when they exercise during stage 4. This could be because of exhaustion and secondary vagal stimulation to keep the heart rate below the maximum possible heart rate.
Our study shows that every individual has a predetermined maximal intrinsic heart rate that can be attained during exercise. This can be influenced by age, sex and physical conditioning. Maximal heart rate declines with advancing age [25, 26]. It is lower in females [11, 27]. Physically conditioned persons have lower heart rate under a standard exercise load [28, 29]. And unconditioned persons have higher heart rate for the same work load [30]. During exercise heart rate increases till an individual attains his/her maximal heart rate. Magnitude of increase in heart rate during a particular stage of stress depends on the heart rate attained prior to that stage and the maximal heart rate that can be attained by that individual. It is also influenced by relative activity of the sympathetic and the parasympathetic system during that stage. Initial increase in heart rate is because of withdrawal of parasympathetic tone and later increase is due to increased sympathetic activity [10]. Undue increase in heart rate during any stage is compensated by relatively less increase during the next stage so that the individual can continue exercise without exhausting his ‘chronotropic reserve.’ On the other end, relatively less increase in heart rate during initial stage is associated with greater increase in heart rate during later stage. Finally each individual attains maximal heart rate. Maximal heart rate is associated with exhaustion of the ‘chronotropic reserve.’ Further exercise leads to vagal stimulation to reduce the heart rate so that the individual can continue exercise for some more time [31, 32].
Diagnostic and prognostic significance of various patterns observed by us is not clear. All of our patients were asymptomatic and had no abnormality on clinical examination and detailed echocardiographic evaluation. There was no clinical or electrocardiographic evidence of myocardial ischemia during maximal stress and recovery of treadmill stress test. All persons achieved 85% or more of age predicted maximal heart rate. There was no chronotropic incompetence. Heart rate recovery was normal in all individuals. We, therefore, feel that these variations represent normal variations in heart rate response during treadmill test. Long term significance of these variations can be assessed only by long term follow up of larger number of persons with different patterns of response observed by us. Our observations will help researchers trying to correlate heart rate response with underlying cardiovascular status, diagnosis and prognosis.
Conclusion
Pattern of increase in heart rate during stress phase of exercise electrocardiography varies from person to person even in individuals without any cardiovascular disease. Variations depend on physical conditioning and influence of autonomic nervous system. Contrary to the widely held impression, all normal individual do not show nearly linear increase in heart rate. Individuals can show minimal or maximal increase in heart rate during any stage of stress. Increase during a particular stage depends on magnitude of increase in heart rate during previous stage. These variations do not suggest any possibility of significant cardiovascular disease if the individual has normal effort tolerance and attains age predicted maximal heart rate at the time of peak exercise.
References
-
Sharif S, Alway SE (2016) The diagnostic value of exercise stress testing for cardiovascular disease is more than just ST segment changes: A review. J Integr Cardiol 2: 341-355.
-
Sharma K, Kohli P, Gulati M (2012) An update on exercise stress testing. Curr Probl Cardiol 37(5): 177-202.
-
Thomas GS (2018) Heart rate response to exercise. In: Thomas GS, et al. (Eds). Ellestad’s Stress Testing. Oxford 2018: 437-445.
-
Thomas GS, Ellestad MH (2017) Electrocardiographic exercise testing. In: Fuster VF, et al. (Eds.), Hurst’s The Heart 2017: 318-334.
-
Balady GJ, Morvise AP (2019) Exercise electrocardiographic testing. In: Zipes DP, et al. (Eds.), Braunwald’s Heart Disease. Elsevier, Philadelphia 2019:154-173.
-
Mittal SR (2021) Significance of heart rate profile during treadmill stress test-A critical appraisal. J Cardiol 5: 1-9.
-
Savonen KP, Lakka TH, Laukkanen JA, Halonen PM, Rauramaa TH, et al. (2006) Heart rate response during exercise test and cardiovascular mortality in middle aged men. Eur Heart J 27(5): 582-588.
-
Leeper NJ, Dewoy FE, Ashley EA, Sandri M, Tan SY, et al. (2007) Prognostic value of heart rate increase at onset of exercise testing. Circulation 115(4): 468-474.
-
Chaitman BR (2007) Should early acceleration of heart rate during exercise be used to risk stratify patients with suspected or established coronary artery disease?. Circulation 115(4): 430-431
-
Lipinski MJ, Froelicher VF (2011) ECG exercise testing. In: Fuster V, et al. (Eds.), Hurst’s The Heart 2011: 371- 387.
-
Thomas GS, Wann LS, Ellestad MH (2018) Normal heart rate range for the Ellestad protocol by age and sex. Appendix B. In: Thomas GS, et al. (Eds.), Oxford 2018: 548-552.
-
Thomas GS, Ellestad MH (2018) Contraindications and safety for stress testing. In: Thomas GS, et al. (Eds.), Oxford 2018: 71-81.
-
Chin CF, Messenger JC, Greenberg PS, Ellestad MH (1979) Chronotropic incompetence in exercise testing. Clin Cardiol 2(1): 12-18.
-
Gibbons RJ, Balady GJ, Bricker JT, Chaitman BR, Fletcher GF, et al. (2002) ACC/AHA 2002 guideline update for exercise testing: summary article. A report of the American College of Cardiology/American Heart Association Task Force on Practice Guidelines (Committee to Update the 1997 Exercise Testing Guidelines). J Am Coll Cardiol 40(8): 1531-1540.
-
Mason RE, Likar I (1996) A new system of multiple lead exercise electrocardiography. Am Heart J 71(2): 196- 205.
-
Bruce R, Blackmon J, Jones J, Strait J (1963) Exercise testing in adult normal subjects and cardiac patients. Pediatrics 32: 742-756.
-
Thomas GS, Ellestad MH (2018) Stress testing protocols. In: Thomas GS, et al. (Eds.), Oxford 2018: 135-148.
-
Jain M, Nikonde C, Lin BA, Walker A, Wackers FJ (2011) 85% of maximal age predicted heart rate is not a valid end point for exercise treadmill testing. J Nucl Cardiol 18(6): 1026-1035.
-
Burbaker PH, Kitzman DW (2011) Chronotropic incompetence: causes, consequences and management. Circulation 123(9): 1010-1020.
-
Fletcher GF, Ades PA, Kligfield P, Arena R, Balady GJ, et al. (2013) Exercise standards for testing and training: a scientific statement from the American Heart Association. Circulation 128(8): 873-934.
-
Fox S III, Naughton JP, Haskell WL (1971) Physical activity and the prevention of coronary heart disease. Ann Clin Res 3(6): 404-432.
-
Paired Test. Analysis Parametric Paired t.
-
Student T tests - an overview.
-
Chaitman BR (2012) Exercise stress testing. In: Bonow RO, et al. (Eds.), Braunwald’s Heart Disease. Elsevier pp: 168-192.
-
Calkins H, Zipes DP (2019) Hypotension and syncope. In: Zipes DP, et al. (Eds.), Braunwald’s Heart Disease. Elsevier pp: 848-856.
-
Grubb BP (2017) Diagnosis and management of syncope. In: Fuster V, et al. (Eds.), Hurst’s The Heart pp: 2098- 2112.
-
Cheitlin MD (2003) Cardiovascular physiology-changes with aging. Am J Geriatr Cardiol 12(1): 9-13.
-
Gellish RL, Goslin BR, Olson RE, Mc Donald A, Russi GD, et al. (2007) Longitudinal modelling of the relationship between age and maximal heart rate. Med Sci Sport Exe 39(5): 822-829.
-
Nes B, Janszky I, Wisloff U, Stoylen A, Karlsen T (2012) Age predicted maximal heart rate in healthy subjects. The HUNT Fitness study. Scand J Med Sci Sports 23(6): 697-704.
-
Thomas GS, Ellestad MH (2018) Parameters to be measured during exercise In: Thomas GS, et al. (Eds.), Oxford pp: 82-105.
-
Copper KH, Poudy LG, White SR, Pollock ML, Linnerud A (1982) Age fitness adjusted maximal heart rates. Res Q Exer Sport 53: 297-304.
-
Shefield LT, Roitman D (1976) Stress testing methodology. Progress in Cardiovascular Diseases 19: 33-49.
- Anomalous Origin of the Left Coronary System from the Right Coronary Cusp: A Rare Coronary Anomaly in a Patient Undergoing Aortic Stenosis Workup
- Optimizing the Therapeutic Potential of Sacubitril/Valsartan: The Promise of Co-Crystal Engineering
- Association between Mortality and Topography of Peripheral Arterial Disease due to Atherosclerosis Obliterans
- Mitral Valve Replacement vs Mitral Valve Repair
- Characteristics and Evolution of Patients with Heart Failure Hospitalized in the Cardiology Department of Dalal Jamm Hospital
- Distribution of Association between Basic Knowledge of Chest Pain and Myocardial Infarction (Heart Attack) and Demographic Variables: A Survey-Based Study