A Novel Approach in the Characterization of Writing Inks using Fluorescence Microscopy and ImageJ
Ink analyses play a vital role in forensic investigation of cases in which the identification of legal, financial document is essential. The aim of the present study was to categorize the writing inks of different brands and colours on the basis of their fluorescence using Fluorescence Microscope. 125 ink samples of blue, black and red colour of both gel and ballpoint variety were taken for the study. The inks were also aged under different set of storage conditions and then the variation in their fluorescence was observed. The results from this study highlight the suitability of using Fluorescence Microscope as an appropriate technique for the characterization of writing inks. The results from the analysis offer a significant benefit in that it enables information to be gathered in a non-destructive manner, which is quite ideal for questioned document examination in forensic labs. However, the lack of quantitative data in the Fluorescence Microscope to determine the intensity of fluorescence is a limitation, thus it can be employed in collaboration with image processing software like ImageJ to determine the spectroscopic data.
Khare V¹*, Singla A² and Gupta P³
¹Research Scholar, Bundelkhand University, India ²Associate Professor, Bundelkhand University, India ³Assistant Professor, UPSIFS, India
Abbreviations
HPTLC: High Performance Thin-Layer Chromatography; PCA: Principal Component Analysis; FTIR: Fourier Transform Infrared Spectroscopy; UV-VIS-NIR: Ultraviolet-Visible- Near Infrared Spectroscopy; DAPNe: Direct Analyte-Probed Nanoextraction; DART-MS: Direct Analysis in Real Time Mass Spectrometry; ROI: Region of Interest.
Introduction
An important component of questioned document analysis is the evaluation of ink entries on a document. Forensic Document Examiner has to identify added, altered or deleted ink entries in a forged document. The characterization and dating of a writing ink helps document examiners to prove the genuineness of a document [1]. The various techniques of perpetrating document forgeries and document alterations are becoming sophisticated rapidly, thus it is getting difficult for document examiners to identify the individual writing instrument used for making the entries in the document; however the ink can be concretely identified [2, 3].
In forensic investigations, ink analyses play a crucial role where the identification of legal and financial documents is crucial. Writing inks are complex in nature and contains pigments or dyes dissolved in a solvent [4, 5]. The purpose of ink analysis is to identify the origin of an ink, the moment at which it was deposited on a substrate, and the “date” on which the ink was created. Although the physical form and general appearance of the writing inks produced by different manufacturers may appear to be identical, their chemical compositions are fundamentally different [6].
In the examination of writing inks, the non-destructive techniques comprising of optical and microscopic techniques are generally applied first. In contrast to the previously used tintometer method, inks, printing inks, and ballpoint ink on the surface of paper were characterized in a research on the basis of their transmission, fluorescence, and reflection spectra in the range of 220-900 nm [7].
Chemical techniques are often destructive in nature as sample preparation of the questioned ink sample is required. The most useful experimental methods for examining ink are Thin-Layer Chromatography, Paper Chromatography, and Capillary Electrophoresis [8, 9, 10, 11, 12]. The chemical techniques separate the dyes from the ink component for their characterization. Fourier Transform Infrared Spectroscopy (FTIR), UV-Visible Spectrometry [13, 14]. Thin-Layer Chromatography, High Performance Liquid Chromatography [15, 16], Positive and Negative Ion Electro spray Ionization Mass Spectrometry, are a few destructive analytical techniques used to investigate the chemical composition of ink. Senior S H, 2012 analyzed 10 blue ballpoint inks in Infrared Spectroscopy, UV-Visible Spectroscopy, High Performance Thin-Layer Chromatography (HPTLC) and Principal Component Analysis (PCA). The inks were classified according to their RF values and colour tones by TLC [17].
Luminescence Spectroscopy [18] and Raman Spectroscopy [19] also provides vital information regarding the colourants, resins, solvents and other vital components of ink. For the differentiation of writing inks, Wilkinson, 2002 used Synchrotron-based Fourier Transform Infrared Micro Spectroscopy [3]. For the non-destructive analysis of inks, the Mass Spectrometry technique is also widely utilized. For the analysis of writing inks on paper, Jones R. W., 2006 used Direct Analysis in Real Time Mass Spectrometry (DART-MS) in situ. The authors successfully differentiated 43 inks of blue and black inks of both gel and ballpoint variety. Denman JS, [20] performed surface analysis by using Time-of-Flight Secondary Ion Mass Spectrometry (TOF-SIMS) of ballpoint inks to identify the organic and inorganic components of ink without any disturbance from the substrate. Laura Feraru DM, [21] applied the spectroscopic and chromatographic techniques of FTIR, Ultraviolet-Visible-Near Infrared Spectroscopy (UV-VIS-NIR) and X-Ray Fluorescence, Thin Layer Chromatography and original method of Commission Internationale de l’ Eclairage (CIEL*a*b*) for the characterization of writing inks [22]. Huynh [1] utilized Direct Analyte-Probed Nanoextraction (DAPNe) coupled to Raman Spectroscopy, Nano electrospray Mass Spectrometry (NSI-MS) and Fluorescence Microscopy for the examination of forged documents. The techniques utilized had the ability to characterize different writing inks of similar colour. However, it was not able to correctly discern, if the forged ink entry was made with the same ink as that present on the original document [1].
Fluorescence Microscopy combines the magnification capabilities of light microscopy with the observation of the fluorescence, making it a possible analytical method for the investigation of ink. A typical microscope employs electromagnetic radiation with wavelengths between 400 and 700 nm, whereas a Fluorescence Microscope uses a light source with a significantly higher intensity to activate the fluorescent pigment of a sample. Fluorescence Microscopy requires high intensity light within the absorption region of a fluorophore. There are numerous light sources that meet these specifications, such as mercury vapour lamps, xenon arc lamps, and light emitting diodes. These light sources use a standard dichroic excitation filter configuration. Lasers are employed in more complex Fluorescence Microscopy setups. Although xenon lamps can eliminate the discontinuous spectra that mercury lamps produce, they are nevertheless a common source of radiation in the visible and ultraviolet ranges. The selection of a specific light wavelength is done using a variety of filters. Excitation filters select light sources from among those that illuminate the most portion of the fluorescent dye’s absorption spectrum. Fluorescence wavelengths are only permitted by the emission cut-off filter. The fluorescent samples get excited when they are subjected or illuminated by a desired wavelength of light.
The majority of writing instruments used nowadays, such as stamp pad ink, ink pads, ballpoint pen inks, and gel point inks are fluorescent in nature. In the present article, an attempt has been made to categorize the writing inks of different brands and colours on the basis of their intensity of their fluorescence. A total of 125 inks of different colours of both gel and ballpoint variety were characterized using various emission cut-off filters of Fluorescence Microscope. In second part of the study, 18 ink samples were aged under a set of storage conditions comprising-inside a notebook, in air condition room, in normal room and in outside environment conditions.
Material and Methods
Sample Preparation
A total of 125 ink samples were prepared in a similar method by drawing an ink stroke of 4 cm on a standard A4 paper with the sample ink pen and a ruler. The ink strokes were analyzed under Fluorescence Microscope of Nikon make, Model- E- 200 to determine their respective fluorescence.
Methodology
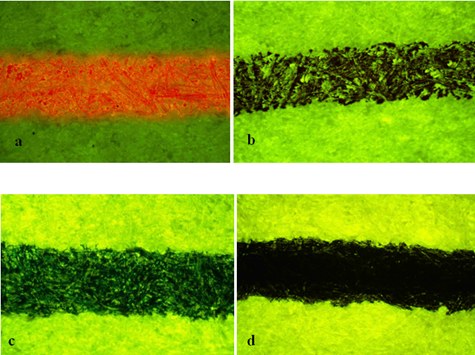
125 ink samples stored in normal room condition were analyzed simultaneously under the various emission cut- off filters of respective wavelengths: a) B2A filter- 450- 490 nm b) G2A filter- 510- 560 nm c) TX Red filter- 540- 580 nm. The ink samples were analyzed under a magnification of 10X. All the images were observed using NIS Elements Imaging Software Version 4.50 and the specimen images were captured using Nikon DS- Fi1c camera attached to the Fluorescence Microscope.
In second part of the study, 18 ink samples were subjected to different storage conditions i.e. a) inside a notebook, b) in an air conditioned room (20°C to 25°C), c) in normal room conditions (37°C to 40°C), d) in outside environment conditions (10°C to 49°C) for a period of 30 days. The variations in the fluorescence of the ink samples were observed after the passage of 30 days using Fluorescence Microscope.
Usage of ImageJ Software (IJ 1.46r) for Measuring The Intensity Of Fluorescence Of 125 Ink Samples
ImageJ (IJ 1.46r) is public domain free application software accessible from NIH. ImageJ supports 8-bit, 16-bit, and 32-bit grayscale as well as 8-bit and 24-bit color images for viewing, editing, analyzing, processing, saving, and printing. It is possible to import and read image formats such as TIFF, GIF, JPEG, and “raw” as individual pictures or stacks. A wide variety of useful image processing features are included in ImageJ [23]. The easy-to-use background subtraction technique in ImageJ can readily determine areas, pixel value statistics, distances, and angles of user-defined choices. Additionally, it can also produce line profile plots and density histograms. Common image processing operations include edge detection, median filtering, sharpening, smoothing, and contrast enhancement. It is capable of carrying out geometric operations like rotation, flipping, and scaling. ImageJ can easily calculate user defined pixel area and extract the spectrum information from the images recorded using CMOS cameras attached to a Fluorescence Microscope or any other instrument [23]. The procedure utilised to measure the intensity of images using ImageJ software is:
- Open the image in ImageJ.
- Set desired parameters by selecting Analyze> Set Measurements. Select option Area, Integrated Density and Mean Grey Value from the pop-up window.
- Draw a Region of Interest (ROI) around the area of interest that you want to quantify the fluorescence intensity.
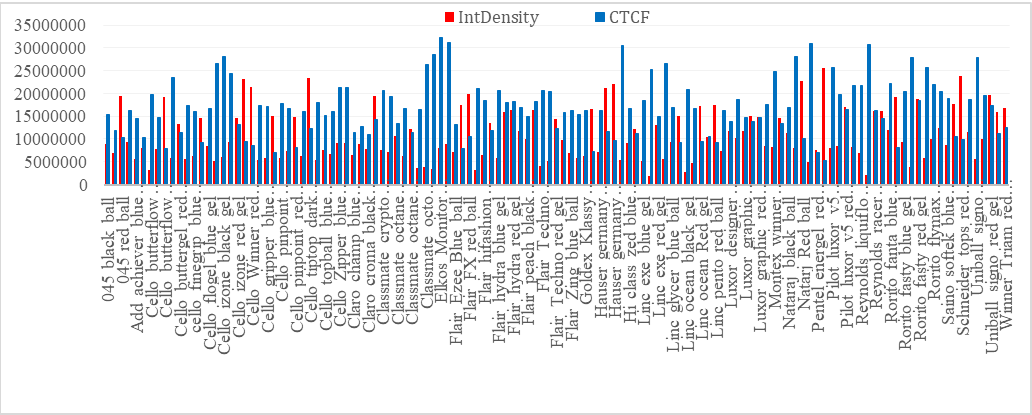
4. The fluorescence image can now be analysed by clicking on Analyze>Measure. A window will pop up with the measurements. This value represents the average fluorescence intensity within the ROI. 5. The data is copied into a spreadsheet. 6. Now, a small area of the image that has no fluorescence is selected. This will serve as background. 7. Click on Analyze>Measure for that region. The data is copied into a spreadsheet. 8. The steps are repeated for 124 fluorescence image and their background regions. 9. The mean fluorescence of background readings is calculated. 10. Now calculate the Corrected Total Cell Fluorescence (CTCF)= Integrated Density- (Area of Selected cell ×Mean Fluorescence of background readings) 11. Calculate CTCF for each cell. 12. Plot a graph with the readings of Integrated Density and CTCF obtained of the samples.
Note: Integrated density is the sum of the contribution of each pixel in the image or selection. It is the product of Area and Mean Gray Value.
CTCF (Corrected Total Cell Fluorescence) -can be defined as Corrected integrated density i.e. the value you want- Total fluorescence per cell.
Results
Statistical Analysis
The values of IntDensity and CTCF of 125 ink samples were compared using Pearson Correlation Coefficient utilizing the software available on the Statistics Kingdom website [24].
Discussion
Result of fluorescence intensity of 125 ink samples after processing through ImageJ software and Correlation Coefficient Table 1 & Figure 3.
| Parameter | Value |
| Pearson correlation coefficient (r) | -0.6347 |
| r² | 0.4028 |
| P-value | 1.90E-15 |
| Covariance | -2.1344E+13 |
| Sample size (n) | 125 |
| Statistic | -9.1089 |
Table 1: Result of Pearson Correlation Coefficient by comparison of IntDensity and CTCF values obtained using ImageJ Software
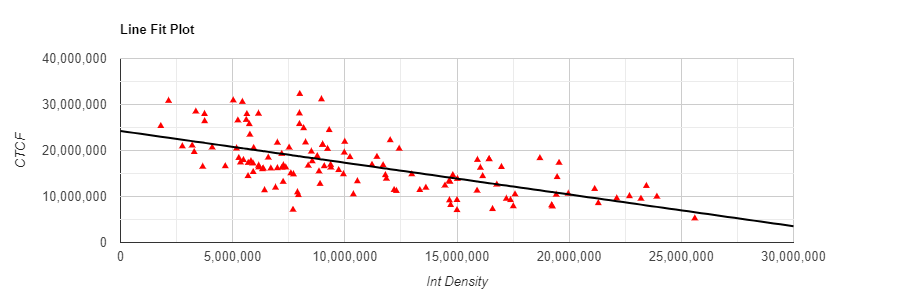
Figure 3: Line Fit Plot of the IntDensity and CTCF (Corrected Total Cell Fluorescence) values of the ink samples Since the null correlation is zero, we use the t-distribution to test the correlation. The correlation’s distribution is not symmetrical when r ≠ 0, hence we use the Z distribution over Fisher transformation to create the confidence interval. 1. Ho hypothesis- Since the p-value < α, H˳ is rejected. The population’s correlation is considered to be not equal to the expected correlation (0). In other words, the difference between the sample correlation and the expected correlation is big enough to be statistically significant. 2. P-value: The p-value equals 1.899e-15, (P (x≤-9.1089) = 9.496e-16). It means that the chance of type I error (rejecting a correct Ho) is small: 1.899e-15 (1.9e-13%). The smaller the p-value the more it supports H1.
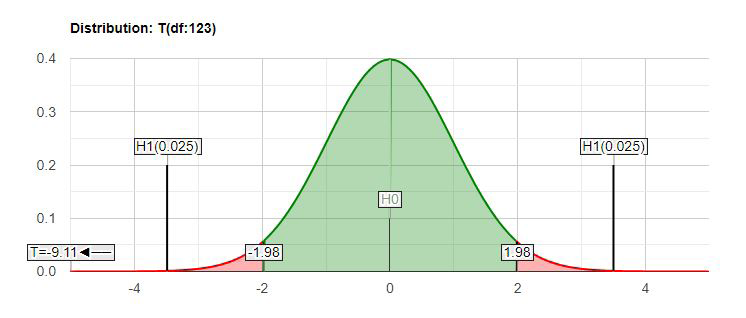
3. Test statistic: The test statistic T equals -9.1089, which is not in the 95% region of acceptance: [-1.9794, 1.9794]. The correlation (-0.6347), is not in the 95% region of acceptance: [-0.1757, 0.1757]. The 95% confidence interval of correlation is: [-0.729, -0.5167].
Therefore, the null hypothesis is rejected; as statistically significant difference was found during the comparison of IntDensity and CTCF values of the sample images (Figure 4).
As seen from the results of Table 1 and Figure 3, we can determine from the results of the Pearson Correlation Coefficient that there is a significant large negative relationship between the Int Density and CTCF values, (r(123) =.635, p < .001). Thus, it can be determined that there is a significant difference in the fluorescence intensities of the Calculated Total Cell Fluorescence(CTCF) after subtracting the background intensity from the Integrated density (Int Density) of the 125 ink samples [23].
Result of variation in Fluorescence of 18 ink samples after being kept in different storage conditions for 30 days (Figures 5-9).
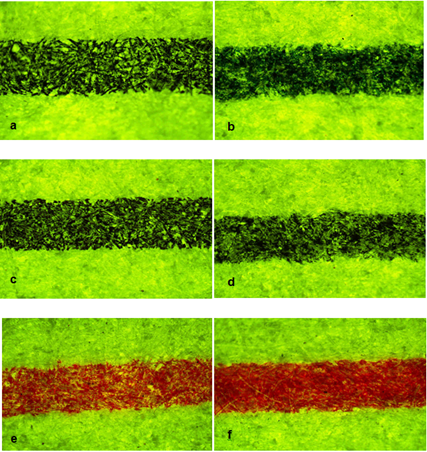
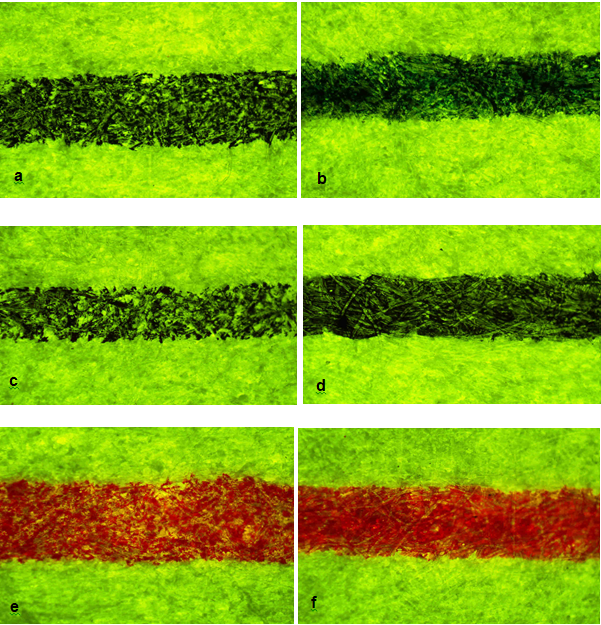
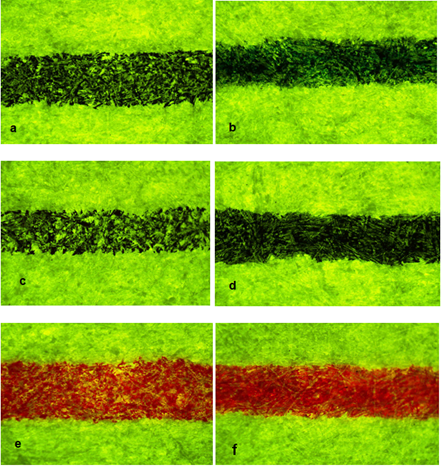
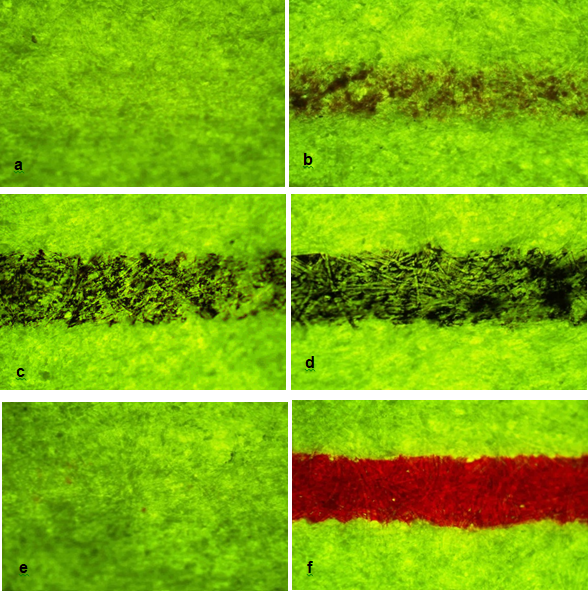
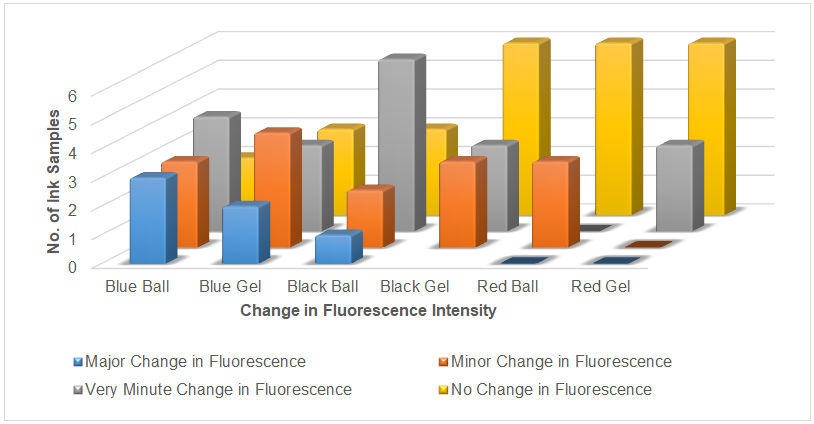
Fluorescence of 18 ink samples in different storage conditions after passage of 30 days
In the second part of the study, eighteen ink samples were characterized on the basis of the change in their fluorescence intensity after being in kept in different storage conditions for a period of thirty days. It was determined from the observations that three blue ball, two blue gel and one black ball out of eighteen ink samples showed major changes in the storage condition of outside environment i.e. they were completely faded off after the time duration of thirty days as seen in some of the samples of Figure 8. Minor changes in the fluorescence intensity were observed in three blue ball, four blue gel, three black gel, three red ball and two black ball ink samples kept in the air conditioned room and outside environment as observed in Figure 7 & 8. Very minute changes in the fluorescence intensity were observed in six black ball, four blue ball, three blue gel, three black gel, three red gel in normal room conditions as observed in Figure 5. No changes in the fluorescence intensity were observed in six black gel, six red ball, six red gel, three black ball, three blue gel and two blue ball inks when the samples were kept in normal room condition and inside a notebook as observed in Figure 5 & 6.
Thus, it can be inferred from the observations of Figure 9, that there is no change in the chemical constituents of the ink when kept in the normal room and inside a notebook as the twenty-six ink samples were observed to show least changes in their fluorescence intensity. In normal room conditions, the nineteen ink samples were less affected as they showed very minute changes in their fluorescence intensity. An air conditioned room and outside environment were determined to have an impact on the chemical composition of the ink samples as the fifteen ink samples were observed to show changes in the said conditions. Major changes in the intensity of fluorescence were observed in the six ink samples kept in the outside environment conditions.
Conclusion
The results from this study highlight the suitability of using Fluorescence Microscope as an appropriate technique for the characterization of writing inks. The various ink samples of different manufacturers were found to have their respective fluorescence due to their distinctive chemical composition. The changes observed in the intensity of fluorescence of ink samples with respect to passage of time and storage conditions indicated that inks age with elapse of time. The inks undergo changes in their physical and chemical characteristics with the passage of time which were indicated in the paper substrate on which the ink was deposited. The results from the analysis offer a significant benefit in that it enables information to be gathered in a non-destructive manner, which is quite ideal for questioned document examination in forensic labs. However, the lack of quantitative data in the Fluorescence Microscope to determine the intensity of fluorescence prove to be a hindrance, thus it can be employed in collaboration with image processing software like ImageJ and FIJI to determine the spectroscopic data.
References
-
Huynh VW, Williams KC, Golden TD, Verbeck GF (2015) Investigation of falsified documents via Direct Analyte- probed Nanoextraction coupled to Nanospray Mass Spectrometry, Fluorescence Microscopy and Raman Spectroscopy. Analyst.
-
Kher A, Mulholland M, Green E, Reedy B (2006) Forensic classification of ballpoint pen inks using High Performance Liquid Chromatography and Infrared Spectroscopy with Principal Component Analysis and Linear Discriminant Analysis. Vibrational Spectroscopy 40(2): 270-277.
-
Wilkinson TJ, Perry DL, Martin MC, McKinney WR, Cantu AA (2002) Use of Synchrotron Reflectance Infrared Spectromicroscopy as a rapid, direct, non-destructive method for the study of inks on paper. Application Spectroscopy 56(6): 800-803.
-
Bell S (2008) Encyclopedia of Forensic Science. New York: InfoBase Publishing.
-
Siegel JM (2010) Fundamentals of Forensic Science 2nd (Edn.), Burlington, M.A.: Academic Press.
-
Pfefferli PW (1984) Application of Microspectrophotometry in document examination. pp: 24.
-
Aginsky VN (1993) Forensic examination of ‘‘slightly soluble’’ ink pigments using TLC, J. Forensic Science International 38(5): 1131-1133.
-
Rautenberg R (1974) Untersuchung der Kugelschreiberschriften. Kriminalistik u. forensische Wissenschaften 16: 77-89.
-
Vog CB, Becker A, Vogt J (1999) Investigation of ballpoint pen inks by Capillary Electrophoresis (CE) with UV/Vis absorbance and Laser Inducted Fluorescence Detection and Particle Inducted X-ray Emission (PIXI). Journal of Forensic Science 44: 819-831.
-
Zlotnick JA, Smith FP (1998) Separation of some black roller ball pen inks by Capillary Electrophoresis. Preliminary Data. Forensic Science International 92(2- 3): 269-280.
-
Xu XK, de Koeijer JA, de Moel JJM (1997) Ink analysis for forensic science applications by Micellar Electrokinetic Capillary Chromatography with Photo-Array Detection. International Journal of Forensic Document Examination 3: 240-260.
-
Thanasoulias NC, Parisis NA, Evmiridis NP (2003) Multivariate Chemometrics for the forensic discrimination of blue ballpoint inks based on their Vis spectra. Forensic Science International. 2003; 138(1-3): 75-84.
-
Adam CD, Sherratt SL, Zholobenko VL (2008) Classification and individualization of black ballpoint pen inks using Principal Component Analysis of UV-Vis absorption spectra. Forensic Sci Int 174(1): 16-25.
-
Causin V, Casamassima R, Marega C, Maida P, Schiavone S, et al. (2008) The discrimination potential of Ultraviolet- Visible Spectrophotometry, Thin Layer Chromatography and Fourier Transform Infrared Spectroscopy for the forensic analysis of black and blue ballpoint inks. Journal of Forensic Science 53(6): 1468-1473.
-
Zieba-Palus J, Kunicki M (2006) Application of Micro-FTIR Spectroscopy, Raman Spectroscopy and XRF method examination of inks. Forensic Science International 158(2-3): 164-172.
-
Senior SH, Hamed E, Masoud M, Shehata E (2012) Characterization and dating of blue ballpoint pen inks using Principal Component Analysis of UV-Vis Absorption Spectra, IR Spectroscopy and HPTLC. J Forensic Sci 57(4): 1087-1093.
-
Adam CD (2008) In-situ Luminescence Spectroscopy with multivariate analysis for the discrimination of black ballpoint pen ink-lines on paper. Forensic Sci Int 182(1- 3): 27-34.
-
Zieba-Palus JB, Borusiewicz R, Kunicki M (2008) PRAXIS-combined µ-Raman and µ-XRF spectrometers in the examination of forensic samples. Forensic Sci Int 175(1): 1-10.
-
Jones RW, Cody RB, McClelland JF (2006) Differentiating writing inks using Direct Analysis in Real Time Mass Spectrometry. J Forensic Sci 158(4): 915-918.
-
Denman JS, Skinner WM, Kirkbride KP, Kempson IM (2010) Organic and inorganic discrimination of ballpoint pen inks by TOF-SIMS and multivariate statistics. Applied Surface Science 256(7): 2155-2163.
-
Feraru DL, Meghea A (2014) Possibilities to differentiate ballpoint pen inks by spectroscopic and chromatographic techniques. U.P.B. Sci Bull Series B 76(1): 114-126.
-
Ferreira T, Rasband WS (2010-2012) ImageJ user Guide- IJ 1: 46.
-
Pearson Coefficient Correlation Calculator.
- Reassessing Baldus Study Data
- Suicide and the Emotions of Men and Women in Uniform
- The Need to Teach Research Methods to Criminal Justice Students
- Combating Cyber VAT Fraud in the EU Member States: A Comparative Study of Criminal and Criminal Procedure Law
- Cyber VAT Fraud in the EU: A Criminological Analysis
- Advancing Compassionate Justice: Redefining Victim and Offender Rights in Victimology and Penology