Antimicrobial Potentials of Bacillus Subtilis Isolated from Soil and Water
In this study, an attempt was made to extract antimicrobial substance from the soil isolate of Bacillus subtilis and explore its antimicrobial activity on some selected bacteria. The bacteria were typed using RAPD-PCR method to identify organism to strain level, using 16sr RNA A1A13 specific primers. Results revealed bands of different sizes identical in both strains of Bacillus subtilis. The antimicrobial potential of the soil isolate was determined by disc diffusion assay. The production of antimicrobial compound was recorded maximum at the late exponential growth phase. The filtered concentrate of the crude extract was used to determine antimicrobial activity on some selected gram positive and gram – negative bacteria. Partial purification of the crude extract was carried out using High pressure Liquid chromatography (HPLC), Zymogram analysis and TLC were performed to determine the preliminary biochemical nature. The molecular weight of the antimicrobial peptide was determined to be less than 2.5k Da. The presence of antibiotic Bacilysocin was discovered from the extract. The minimum inhibitory concentration MIC of the purified fraction showed (MIC) ranging from 0.5 to 10μg/ml for Staphylococcus aureus and Streptococcus pyogenes. The MIC for the gram–negative was 0ug/ml. The crude extracts showed antimicrobial activity only on gram positive selected bacteria strains, while the purified extract showed antimicrobial activity on both the gram-positive and gram-negative with more activity on the gram-positive. The zones of inhibition for crude extract 1 on Staphylococcus auerus were 8.0mm, 5.0mm, 3.0mm, 1.0mm; extract 2: 15.0mm, 10.0mm, 9.0mm, 7.0mm, and 6.0mm, 4.0mm, 3.0mm, 1.0mm respectively for extract 3. for Streptococcus pyogenes the zones of inhibition range from 2.0mm to 9.0mm, for extracts 1 and 2:10.0mm to 3.0m and10.0mm to 1.0mm for extract 3.for the gram negative test organisms, the zones of inhibition were 0.0mm for all the extracts tested against it.
Introduction
Antibiotics are low molecular – weight (non-protein) molecules produced as secondary metabolites, mainly by micro-organisms that live in the soil. Bacillus subtilis is a gram-positive aerobic, sporulating rod shaped bacterium that are capable of secreting antibiotics in great numbers to the exterior of the cell [1]. This antibiotics secreted by Bacillus strains, regardless of their toxicity to the cells of mammals (e.g. Polymyxins, Bacitracin, etc) have continued to be the focus of scientist. Bacillus subtilis, is an important specie among micro-organisms that live in the soil and widely spread in nature that produces large number of antibiotics which are classified as ribosomal or non-ribosomal [2]. The ribosomal peptide antibiotics are synthesized during active growth, while non-ribosomal ones are synthesized after growth has ceazed [3]. Surfactin represents an example of non-ribosomally synthesized circular oligopeptide that contains a fatty acid chain that exhibits potent antibacterial activity. Other non-ribosomally synthesized antimicrobial produced by this specie include: itrucin and fengycin [4]. It is generally assumed that these antibiotics are mainly polypeptides [5]. Most of the peptide antibiotic produced by Bacillus is active against Gram Positive bacteria [6]. However, compounds such as polycolistin, and Circulin exhibit activity almost exclusively upon Gram – Negative forms, whereas bacillomycin, mycobacillin are effective against moulds. Bacitracin produced by Bacillus subtilis is very effective topically and its action may be found especially on Gram-positive cell-walls. Since Bacillus subtilis species are especially known for their ability to produce a wide variety of bioactive compounds and polypeptides which are antimicrobial in nature therefore, this study is an attempt to isolate the organism from their natural habitat, identify Bacillus subtilis species with potential antibiotic production, extract the antibiotics and check their potentials against some known bacteria strains. Bacillus subtilis has been used for genetic and biochemical studies for several decades [7] and is regarded as model of Gram – positive endospore forming bacteria [8]. Several hundred wild type Bacillus subtilis strains have been connected with the potential to produce more than two dozen antibiotics with an amazing variety of structures. All of the genus specifying antibiotic biosynthesis combined amount to 350 kb. However, just as no strain possesses them all, an average of about 4 – 5% of Bacillus subtilis genome is particularly devoted to antibiotic production [9].
The potentials of Bacillus subtilis to produce antibiotics have been recognized for 50 years. Peptide antibiotics represent the predominant class. They exhibit highly rigid hydrophobic and or cyclic structures with unusual constituents like D-amino class and are generally resistant to hydrolysis by peptidases and proteases [10]. A new antibiotics bacitracin has been recovered from a strain of Bacillus subtilis. It is neutral, water – soluble non-toxic and relatively heat stable. In vitro it is chiefly active against Gram- positive microorganisms. Even gonococcus and meningococcal are also susceptible to its action. Antibiotic activity was found to depend on the pH and nutrient concentration in the assay medium. Some other researchers found that antibiotics production of Bacillus subtilis strains depended on the growth substrate and highest antibiotic production was found on media based on homogenized cabbage tissue. However, antibiotic productions have been recognized as the only means of effective microbial growth control after the discovery of penicillin and other antimicrobial agents by Alexander flaming [5]. Production of antibiotics, mainly allows the organism to flourish in every of its environment and compete favorably with other competing organisms within its environment because this special attribute exhibited by Bacillus species makes the organism most successful among other bacteria species by producing antibiotic they use it to gain advantage over their competitors [11].
Materials and Method
Microbial Strains, Media and Growth
The isolate Bacillus subtilis was grown in 100ml modified tryptic soy broth (MTSB) with additional 0.5% yeast extract at 37oC for 48 hrs under shaking condition [12]. The indicator bacterial strains used for sensitivity test of the antimicrobials were grown in Brain heart infusion slants at 37oC and maintained at 4oC. The test organisms used for this investigation were Staphylococcus aureus, Pseudomonas aeuroginosa, E coli and Streptococcus pneumouniae. They were obtained from the microbiology department of Federal Medical Centre Owerri (FMC), Imo State.
Sources of Chemical, Reagents and Culture Media
All reagents, chemicals used for the biochemical analysis, preparation of media, were purchased commercially. Culture media like Nutrient agar used for the major culturing and sub culturing of the test isolates was ISO13485 model with lot M3EIHPOI prepared by TITAN BIOTECH LTD, Rajasthan, India. The tryptic soy broth used in this study was from (St. Louis/USA) Oxford (Hermshire/England) and Merck (Damstadt/Germany) Brain Heart Infusion Agar (BHI) was Sigma – Aldrich St Louis, Mo prepared by Bio – Rad Laboratories Inc, Hercules. Antibiotics used for antibiotic control, was ciprofloxacin (400mg) purchased commercially.
Supply of A1AB Primers for RAPD Typing of Isolates
X2 quick load master mix Taq polymerase dNTPs, mgcl2, and Buffer, a prime A1AB for the amplification of genomic DNA of Bacillus subtilis for typing Bacillus to reveal related strains, were supplied by Inquaba South Africa.
Preparation of Inoculum
Using a sterile inoculating loop or needle, touch four isolate colonies of the organism to be tested, suspended in 2ml of sterile saline, it was vortexed this was to create a smooth suspension. Turbidity of suspension was adjusted to 0.5.McFarland standard by adding more organisms when the suspension was too light or diluting with sterile saline if the suspension was too heavy. Care was taken under preparation of inoculum of test organisms that the organisms were to be in the log phase of their growth in order for results to be valid. The subcultures of the test organisms were made the previous day i.e. 24 hours prior to use. Extremes of inocula for inoculating plates were also avoided if organisms were difficult to suspend directly into a smooth suspension, the growth method of preparing the inoculums should be used. However, the recommended organisms listed for this procedure produced smooth Suspensions with little difficulty [13].
Disc Preparation
Filter paper (Whatman No 1.) was used to prepare discs of about 6mm diameter. The discs were put in screw capped bijou bottles and sterilized using autoclave at 1210C for 15 minutes. After serial dilution of extracts the disc were impregnated with about 100 discs with 1ml of antibiotic extract, making ensure that the whole 1ml was completely absorbed by the discs. The discs were stored in air dried and tight screw-capped bottles to retain moisture and potency.
Random Amplified Polymorphic DNA (RAPD)
PCR amplification was carried out in 25µl volume containing 12.5µl of X2 Quick load Master mix (Taq polymerase, dnTps, mgcl and buffer), a primer AIAI3: CAGGCCCTTCCAGCACCCAC and 2µl of the extracted genomic DNA on a 9700AB, thermal cycler. The PCR condition were as follows: initial denaturation at 950C for 5minutes, denaturation at 950C for 1minute, annealing at 420C for 1minute, extension for 720C for 1minute, for 30 cycles and final extension at 720C for 3 minutes. The PCR products were resolved on agarose gel electrophoresis at 130v for 30minutes and visualized on a UV transilluminator for characteristics pattern.
Antibiotic Production and Extraction of Antimicrobial
The production of antimicrobial agent in the genus Bacillus is always recorded at the late exponential growth phase. A crude extract of the antimicrobial, was prepared as described by Hrafnsdottir and Menon Method [14]. Aliquots of cultures (0.1ml) using macfarland standard were inoculated into Tryptic Soy plates incubated at 37oC. From there, single discret colonies were picked and screened for the production of anti-microbial/antimicrobial activity. After confirmation of their identity to be pure strains of Bacillus subtilis, then the antimicrobial producing strains were grown in 100mls of modified tryptic soy broth (MTSB) at pH 7.4 and 37oC for 48 hrs. After 48hrs, the supernatant was collected by centrifuging grown cultures at 12000rpm for 30 minutes and filtered through 0.45µm polysulphonate. Membrane filtered cell – free supernatant, was concentrated by ultrafiltration using Millipore membrane. After concentration, it was used as a crude extract.
Serial Dilution of Crude Antibiotic Extract
Double fouled dilution of the crude antibiotic extract was carried out in tubes arranged serially on a rack and properly labeled. 1ml of sterile distilled water was added to each tube on the rack. 1ml of extract was transferred with a new sterile pipette from the neat into the tube I mixed and 1ml was taken from tube 1 to tube 2 in a serial manner. The operation was repeated until the last tube and 1ml was discarded. As the dilution progressed, the concentration decreases. The different diluted concentration of the extracts was tested against different bacteria test strains.
Determination of MIC by Tube Dilution Method
Determination of MIC of crude extract by tubes dilution method determination of minimum inhibitory concretion (MIC) for the different test bacteria was determined using tube dilution method in modified tryptic soybroth using 8 tubes as follows: the neat, 3 different serial dilutions, the standard; broth alone, broth and extract organism and broth as controls Using McFarland Standards (0.5) Cfu/ml of each of the test organism was prepared and subjected to varing concentration of the crude extract in the range of 8.4 – 0.06µ/ml and 2.0µg/ml – 0.25µg/ml, respectively, by two fold dilution methods. The tubes were incubated at incubator for 24hrs at 270C and the lowest concentration that inhibited growth of test organisms was recorded [13].
Determination of Antimicrobial Potential of the Crude Extract by Agar Diffusion Disc Method
The crude extract was tested for antimicrobial activity
against test bacteria using Agar disc diffusion method. The antimicrobial was performed according to Ramachandran, et al. [15] with modifications and Kirby- Baurer method respectively. A Mueller hinton agar plate was swabbed with 100µl of appropriately diluted freshly grown test organism. Care was taken to swab properly over the whole surface of the plate completely. The plate was allowed to dry for about 5 minutes. Then disc of about 6mm which was previously autoclaved was impregnated with a known estimated concentration (0.01µg) of the crude supernatant of the extracts of Bacillus subtilis. This was placed on the agar plates carefully with the help a sterile forceps. The discs were pressed lightly to make sure of good contact with the agar. It was incubated at 37oC. The zone of inhibition were measured and recorded after incubation at 37oC for 24 hrs for antimicrobial activity. Antimicrobial activity was expressed as the diameter of the zones of inhibition around the disc which was measured and reported in millimeters to confirm antimicrobial activity [16].
Bioassay of Antimicrobial Extract
Cultured cells (cultured in about 2 liters) were collected, and the cellular contents were extracted three times with 50mls of 50% n – butanol. The organic layer was collected and concentrated in vacuo. The resulting crude extract (12.9g) was suspended in 1.6 liters of 10% Me0H adjusted to PH 7 with NaoH, and extracted three times with an equal volume of ethyl acetate. The aqueous layer was then adjusted to PH 2.0 and was again extracted three times with ethyl acetate. The solvent of the acidic organic layer was evaporated, resulting in 1.7g of crude extract. Silica gel (400ml) was equilibrated with the development solution (CHCl3 – MeoH – H20 (20/5/1) and the extract dissolved in 20ml of the same solution, was applied to a chromatography column.
development solution. The active fraction was collected and dried in vacuo, and then the resulting crude sample was redissolved in 4ml of CHCl2 – MeoH (4/1). This mixture was applied to a DEAE sepharose column (200ml Pharmacia) equilibrated with CHCl3 – MeoH (4/1). After the column was washed, development was performed with 600ml of CHcl3 – MeoH (4/1) containing 2% aqueous NH300H and 0.02m ammonium acetate. The active fraction was collected and vacuum evaporated resulting in a crude substance that weighed 2.5g. Finally, this crude fraction was purified by high pressure liquid chromatography (HPLC) with a sephasil peptide G8 Column (Pharamacia) with 62% MeoH in 1mm Phosphate buffer (PH 7.5) and an elution solvent. (Figure 1) Eventually 20mg/ml of pure antimicrobial substance was obtained.
Statistical Analysis
Statistical analysis of the data obtained was done using ANOVA and student T test was used to calculate mean from the results of the zones of inhibition from the different plate readings.
- Results
- Purification of the
- Crude
- Antimicrobial
- Compound Produced by Bacillus subtilis by
- Chromatography (HPLC)
- Chromatography was carried out with 1.2 liters of
- Zones of Inhibition in Diameter (MM)
- Concentration of extract 1 in mg/ml
- Staphylococcus aureus
- Strep pyogenes
- Pseudonomonas aureginosa
- E. coli
- Plate 1
- Plate 2
- Plate 1
- Plate 2
- Plate 1
- Plate 2
- Plate 1
- Plate 2
- 0.78mg/ml
- 8.0
- 7.0
- 9.0
- 8.0
- 0.0
- 0.0
- 0.0
- 0.0
- 0.39mg/ml
- 5.0
- 5.0
- 7.0
- 7.0
- 0.0
- 0.0
- 0.0
- 0.0
- 0.19mg/ml
- 3.0
- 2.0
- 4.0
- 3.0
- 0.0
- 0.0
- 0.0
- 0.0
- 0.09mg/ml
- 1.0
- 1.0
- 2.0
- 1.0
- 1.0
- 0.0
- 0.0
- 0.0
- Control: Ciprofloxacin
- 10mg/ml
- 30.0
- 33.0
- 18.0
- 18.0
- 5.0
- 7.0
- 20.0
- 15.0
Table 1: Antimicrobial potential of crude extract I against test organisms.
Table 2 shows the result of Antimicrobial potential of crude extract II against test organisms. Crude extract II in different concentrations of 8.4mg/ml 4.20mg/ml, 2.10mg/ ml and 1.05mg/ml exhibited antimicrobial activity and potency only on the gram positive test organisms ranging from 2.0mm diameter to 10.0mm for streptococcus pyogenes,
7.0mm to 15.0mm for staphylococcus aureus. While on the gram negative test organisms, no potency was exhibited with the crude extract II and therefore zone of inhibition was zero. The antibiotic control/standard in 10mg/ml showed potency on the test organisms ranging from 7.0mm to 22.0mm respectively.
- Zone of Inhibition in Diameter (Mm)
- Concentration of extract 1 in mg/ml
- Staphylococcus aureus
- Strep pyogenes
- Pseudonomonas aureginosa
- E. coli
- Plate 1
- Plate 2
- Plate 1
- Plate 2
- Plate 1
- Plate 2
- Plate 1
- Plate 2
- 8.40mg/ml
- 15
- 13.0
- 10
- 7.0
- 0
- 0.0
- 0
- 0.0
- 4.20mg/ml
- 10
- 11.0
- 8
- 5.0
- 0
- 0.0
- 0
- 0.0
- 2.10mg/ml
- 9
- 7.0
- 7
- 4.0
- 0
- 0.0
- 0
- 0.0
- 1.05mg/ml
- 7
- 7.0
- 3
- 2.0
- 1
- 0.0
- 0
- 0.0
- Control: Ciprofloxacin 10mg/ ml
- 22
- 21.0
- 18
- 14.0
- 8
- 7.0
- 28
- 22.0
Table 2: Antimicrobial potential of crude extract II against test organisms.
Antimicrobial potential of crude extract III against test organisms is shown in Table 3. The crude III extract are in concentrations of 0.52mg/ml 0.26mg/ml, 0.13mg/ml and 0.06mg/ml respectively Antimicrobial activity was observed in the gram positive test organism also. Potency was exhibited in form of zones of inhibition ranging from 1.0mm diameter to 10.0mm diameter for strept pyogenes and 1.0mm to 6.0mm diameter for staph aureus. Crude III extract had no potency on gram negative test organisms. Also standard antibiotics control ciprofloxacin, in 10mg/ml concentration showed zone of inhibition from 9.0mm to 21.0mm.
- Zone of Inhibition in Diameter (MM)
- Concentration of extract 1 in mg/ml
- Staphylococcus aureus
- Strep pyogenes
- Pseudonomonas aureginosa
- E. coli
- Plate 1
- Plate 2
- Plate 1
- Plate 2
- 1.0
- Plate 2
- Plate 1
- Plate 2
- 0.52mg/ml
- 6.0,
- 6.0
- 10.0,
- 8.0
- 0.0
- 0.0
- 0.0
- 0.0
- 0.26mg/ml
- 4.0,
- 3.0
- 4.0
- 3.0
- 0.0
- 0.0
- 0.0
- 0.0
- 0.13mg/ml
- 3.0
- 2.0
- 2.0
- 2.0
- 0.0
- 0.0
- 0.0
- 0.0
- 0.06mg/ml
- 1.0
- 1.0
- 1.0
- 1.0
- 0.0
- 0.0
- 0.0
- 0.0
- Control: Ciprofloxacin 10mg/ml
- 21.0
- 20.0
- 18.0
- 18.0
- 10.0
- 9.0
- 15.0
- 18.0
Table 3: Antimicrobial potential of crude extract III against test organisms.
From Table 4 there was significant difference in the mean zone of inhibition by the different concentrations of crude extract I against staphylococcus aureus. The control ciprofloxacin at 10mg/ml gave mean zone of inhibition of 31.50mm which was significantly different from the mean zone of inhibition of the crude extract I concentrations. However, the crude extract concentrations exhibited some level of potency in the control of staphylococcus aureus as observed in the concentration of 0.78mg/ml, which gave a mean zone of inhibition of 7.50mm while 0.39mg/ml gave a mean zone of inhibition of 5.0mm which were significantly different from the zone of inhibition observed in the other crude concentrations of 0.19mg/ml with mean zone of inhibition of 2.50mm and 0.09mg/ml which gave 1.0mm mean zone of inhibition. In the table 4.5 also crude extract I exhibited some level of potency in the control of streptococcus pyogenes. It was able at the concentration of 0.78mg/ml, gave a mean zone of inhibition of 8.50mm and at 0.39mg/ ml concentration a mean zone of inhibition 7.00mm. These were also significantly different from the zones of inhibition observed in the other crude concentration of 0.19mg/ml with mean zone of 3.50mm zone of inhibition and 0.09mg/
ml with 1.50mm mean zone of inhibition. The crude extract concentration from 0.09mg/ml to 0.78mg/ml did not show any potency on the other organism’s pseudomonas aureginosa and Escherichia coli since their mean zone of inhibition were 0.00mm respectively and therefore had zero mean zone of inhibition and no significant values.
| Concentration of extract 1in mg/ml | Staphylococcus aureus | Streptococcus pyogenes | Pseudomonas aeuroginosa | E. coli |
|---|---|---|---|---|
| 0.78mg/ml | 7.50b | 8.50b | 0.00b | 0.00b |
| 0.39mg/ml | 5.00c | 7.00c | 0.00b | 0.00b |
| 0.19mg/ml | 2.50d | 3.50d | 0.00b | 0.00b |
| 0.09mg/ml | 1.00d | 1.50e | 0.00b | 0.00b |
| Control: Ciprofloxacin 10mg/ml | 31.50a | 18.00a | 6.00a | 17.50a |
| LSD:0.05 | 1.54 | 0.51 | 0.84 | 2.1 |
Table 4: Mean + SD Zone of inhibition of crude extract I for all test Organisms.
LSD Least Significant Difference Mean in the same columns having the same letters are not significantly different from each other at P < 0.05. Table 4: Mean + SD Zone of inhibition of crude extract I for all test Organisms.
From Table 5, the control ciprofloxacin at concentration of 10mg/ml, gave a mean zone of inhibition of 21.50mm against staphylococcus aureus for the crude extract II which was significantly different from the mean zone of inhibition of the crude extract II concentrations though the crude extract II concentration exhibited some level of potency in the control of staphylococcus aureus as shown in the Table 4.6 from column I. The crude extract II at the different concentrations of 8.40mg/ml gave a mean zone of inhibition of 14.00mm and 4.20mg/ml gave a mean zone of inhibition of 2.16mm. These mean zone of inhibition, were significantly different from the mean zone of inhibition in the other concentrations. For instance 2.10mg/ml with 8.00 mean zone of inhibition and 1.05mg/ml with 7.00 mean zone of inhibition. Though they also exhibited potency. From the second column with the same concentration of the control and the test organism streptococcus pyogenes, the crude extract, exhibited potency against the test organism. There is a significant difference between the mean zones of inhibition of the control antibiotics from the mean zone of inhibition of other crude extract II concentrations. For instance, the control gave 16.00mm mean zone of inhibition at 10mg/ml while others at 8.40mg/ml gave 8.50mm, 4.20mg/ml gave 6.50mm, while 2.10mg/ml and 1.05mg/ml gave 5.50mm and 2.50mm mean zones respectively. For the other two test organism’s pseudomonas aureginosa and E. coli, there were no significant difference between the mean zones which showed zero and therefore no potency against test organisms with the crude extract.
| Concentration of extract in mg/ml | Staphylococcus aureus | Streptococcus pyogenes | Pseudomonas aeuroginosa | E. coli |
|---|---|---|---|---|
| 8.40mg/ml | 14.00b | 8.50b | 0.00b | 0.00b |
| 4.20mg/ml | 12.16b | 6.50c | 0.00b | 0.00b |
| 2.10mg/ml | 8.00c | 5.50c | 0.00b | 0.00b |
| 1.05mg/ml | 7.00c | 2.50d | 0.00b | 0.00b |
| Control: Ciprofloxacin 10mg/ml | 21.50a | 16.00a | 7.50a | 25.00a |
| LSD:0.05 | 2.72 | 1.03 | 0.42 | 2.52 |
Table 5: Mean + SD Zone of inhibition of crude extract II for all test organisms.
Note – Mean in the same column having the same letters are not significantly different from each other at P < 0.05. Table 5: Mean + SD Zone of inhibition of crude extract II for all test organisms.
Table 6 shows the activity of crude extract III against test organisms. From the table 6, antibiotic control ciprofloxacin at 10mg/ml gave a mean zone of inhibition of 20.50mm with the test organism staphylococcus aureus. This value showed significant difference from other crude III extract concentrations. The crude III extract concentrations, exhibited some levels of potency in the control of staphylococcus aureus as observed from the table in column I the crude extract III at 0.52mg/ml and 0.26mg/ml, gave mean zones of inhibition of 6.00mm and 3.50mm respectively from here you can observe the significant difference. Also 0.13mg/ml and 0.06mg/ml showed mean zone of inhibition of 2.50mm and 1.00mm
respectively. From the second column with test organism streptococcs pyogenes there is exhibition of potency of the crude III extract against the test organism. Also significant difference was observed from the control ciprofloxacin at 10mg/ml which gave 18.00mm and the other concentrations of 0.52mg/ml and 0.26mg.ml which gave mean zone of inhibition of 9.16mm and 3.33mm and 0.13mg/ml and 0.06mg/ml at 2.00mm and 1.00mm mean zones of inhibition respectively. There is significant difference among the mean zone of inhibition of the different concentrations.
With the test organism pseudomonas auregniosa and E. coli there was no zone of inhibition and significant difference among the mean zone of inhibition therefore no potency was observed by the crude extract III against these test organisms. Only mean zone of inhibition of the control antibiotics was observed as 9.50mm against pseudomonas and 6.50mm against E. coli respectively.
| Concentration of extract in mg/ml | Staphylococcus aureus | Streptococcus pyogenes | Pseudomonas aeurognosa | E. coli |
|---|---|---|---|---|
| 0.52mg/ml | 6.00b | 9.16b | 0.00b | 0.00b |
| 0.26mg/ml | 3.50c | 3.33c | 0.00b | 0.00b |
| 0.13mg/ml | 2.50d | 2.00c | 0.00b | 0.00b |
| 0.06mg/ml | 1.00e | 1.00e | 0.00b | 0.00b |
| Control: Ciprofloxacin 10mg/ml | 20.50a | 18.00a | 9.50a | 6.50a |
| LSD:0.05 | 0.51 | 0.92 | 0.42 | 1.26 |
Table 6: Mean + SD Zone of inhibition of crude extract III for all test organisms.
Means in the same column having the same letters are not significantly different from each other at P < 0.05. Table 6: Mean + SD Zone of inhibition of crude extract III for all test organisms.
Table 7 shows determination of Antibiotic potential of the purified extract on the three different test organisms. S. aureus, E. coli, P. aeroginosa and S. pyogenes. Now after the crude extracts were purified by high performance liquid chromatography, the extract was free from artifacts and dirt and therefore antimicrobial activity was now high, higher than when the extract was crude. This was revealed in the antimicrobial activity against the test organisms. It was observed that the purified extract showed zones of inhibition higher with the various test organisms then when they were crude. Also antimicrobial activity was shown both in the gram-negative and gram-positive test organisms.
| Test Organism | Purified extract | Concentration in mg/ ml (10mg/ml) | Zone of inhibition of purified extract in mm diameter | Total of zone of inhibition in mm diater of the plate I & II | Mean + STD | |
|---|---|---|---|---|---|---|
| Plate 1 | Plate II | |||||
| E. coli | Purified extract | 10.0mg/ml | 9 | 7 | 35 | 17.5 |
| Pseudomonas | Purified extract | 10.0mg/ml | 6 | 5 | 21 | 10.5 |
| Aeruginosa | ||||||
| S. aureus | Purified extract | 10.0mg/ml | 15 | 16 | 42 | 21 |
| S. pyogenes | Purified extract | 10.0mg/ml | 18 | 16 | 34 | 12 |
Table 7: Antibiotic potential of purified extract on test organisms.
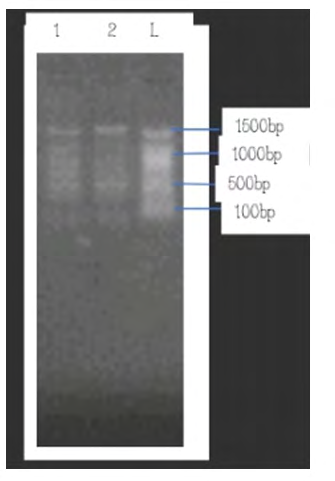
Figure 1 Agarose gel electrophoresis showing RAPD – PCR bands of the 2 strains of Bacillus subtilis. Lane I and 2 shows similar base pair band pattern. Lane L represents the 100bp DNA ladder. The uniformity of DNA bands and the similarity in the base pair pattern, confirms specie relatedness and specificity of test species when compared with the 100bp DNA molecular ladder which is a ready- to-load molecular weight marker that is suitable for DNA fragment size determination used on gel electrophoresis. When observed, it contains one reference band (500bp) for easy location.
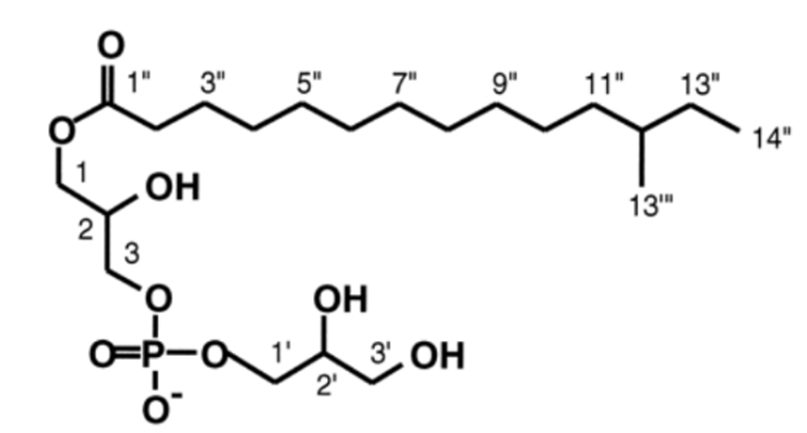
Next, attempt was made to isolate the antimicrobial substance. Cultured cells (about 5 liters) were collected, and the cellular contents were extracted three times with about 4 liters of 50% n – brotanol. The resulting Crude extract (2.5g) was suspended in 1.6 litres of 10% MeoH adjusted to PH 7 with NaoH and extracted three times with equal volume of ethyl acetate. The extract was applied to a chromatography column. Chromatography was carried out. The active fraction was then collected and evaporated by vacuum, resulting in a crude substance that weighed about 0.15g. This crude fraction was purified by high pressure liquid chromatography (HPLC). The antimicrobial substance was isolated and the active fraction collected and vacuum evaporated resulting in a crude substance that weighed 2.5g. The crude fraction was purified by High pressure liquid chromatography (HPLC). The antibiotics recovered from the purified extract were named Bacilysocin as shown in Figure 2.
The antibiotic accumulates within the cells of bacillus subtilis intracellularly. The activity of the antimicrobial compound was detected as a superimposed spot after TLC – bioautograph and the structure determined by nuclear magnetic resonance and mass spectrometry analysis. Production of antibiotic commenced just after the cells entered stationery phase but before formation of heat resistant spores. Later, the activity of the antibiotic decreased rapidly.
Figure 3 shows the Bar chart representing the mean zone of inhibitions in mm of Antibiotic potential of purified extract on test organisms. Here highest is represented by staphylococcus aureus with 21.00mm followed by E. coli with 17.5mm diameter mean zone of inhibition, Streptococcus pyogenes is represented by 12.0mm diameter mean zone of inhibition while the least is pseudomonas aeroginosa with 10.5mm mean zone of inhibition.
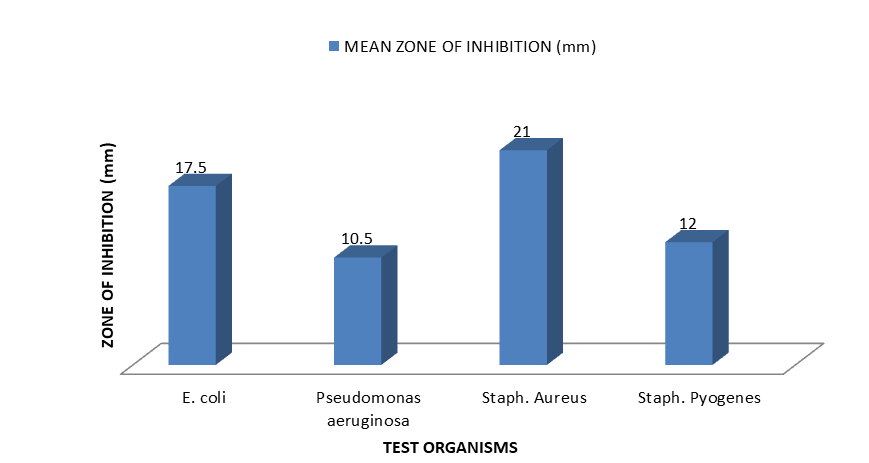
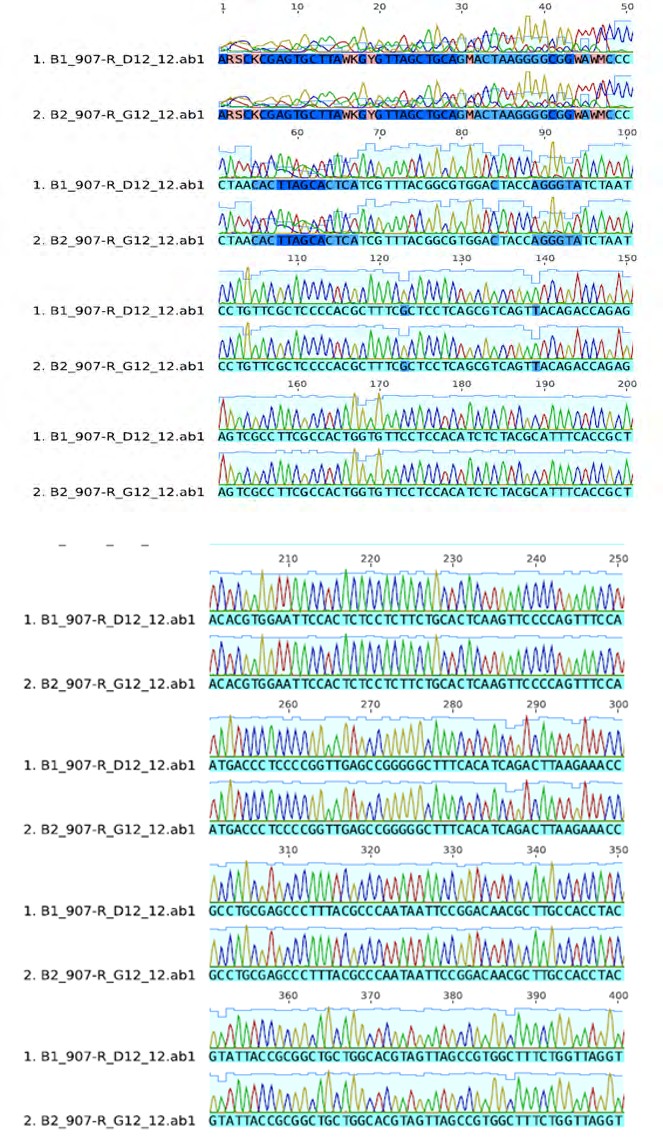
Figure 4 shows the determination of the precise order of the nucleotides within the DNA molecules of the typed bacteria known as DNA sequencing. By sequencing a stretch of DNA of the each Bacillus subtilis which had antimicrobial activities, it was then possible to know the order in which the four nucleotide bases – adenine, guanine, cytosine and thyamine – occur within that nucleic acid molecule. Since every organisms DNA is made up of a unique sequence of nucleotides therefore determining the sequence was of help in comparing DNA between organisms, which can help to show how the organisms are related Figure 4 DNA sequence of bacteria strains.
Discussion
Antibiotics production is a feature of some soil bacteria and may present a survival mechanism whereby organisms can eliminate competition and colonize niche. Also distinct B. subtilis antibiotics and antibiotic-like compounds play crucial roles in communal development and contribute to the survival of B. subtilis in its natural habitat [17]. The present study was carried out to evaluate the production of antibiotics from newly isolated Bacillus subtilis and use antibiotic extracted against same selected test organisms to determine their antimicrobial activity against them. Total of 18 soil and water samples screened, only 3 showed antimicrobial activity. These three strains were typed using RAPD – PCR method to further identify these Bacillus subtilis to strains level. Using RAPD – PCR specific Primers. Results revealed bands pattern of different sizes that were identifical in both strains. The bands and lane pattern display in this work are in line with the work of previous researchers like Adimpong, et al. [17] and Egbulonu et al., [18]. Also the sequence shown in the result of the sequence confirming specific primers and 16sr RNA typing and Gen bank nucleotide sequence database. The Bacillus subtilis strain were identified as Bacillus subtilis subsp_subtilis. A look at the antimicrobial potential of the crude extracts on different test organisms ; gram- positives (_S. aureus and S pyogenes) and gram- negative (P. aeruginosa and E. coli); the crude extracts showed inhibitory effects on gram positives S aureus and S pyogenes with diameter of inhibition ranging from 15.0mm, 13.0mm, 10,0mm, 9.0mm etc. from the different concentration of the crude extracts but the crude extracts had no antimicrobial activity on the gram negative test organisms (E. coli and pseudomonas aeruginosa). This result is in line and conformity with some very good researchers who worked on antimicrobial activities of Bacillus subtilis species strains also isolated from the soil. Ramachandran, et al. [15] from their work,found and reported that then isolates were effective against gram positive and Gram – negative bacteria, yet their extensive inhibition effect is particularly against gram – positive bacteria. However, some other researchers have shown results which are not in agreement with our present study. Some of them in their work showed broad spectrum activity of Bacillus subtilis. In this work, however, the purified extract showed susceptibility to about 8.0mm and 7.0mm for E coli and 6.0mm and 5.0mm for P. aureginosa. But for S aureus and S pyogenes, larger areas were witnessed up to 18.0mm for both S aureus and S pyogenes. The discrepancies in the result of this present study may be due to the method of extraction of antimicrobials and also method of susceptibility testing Haavik, 1975 reported earlier in his work that antibiotic production in his work “Bacitracin production by the species of B linchenformis ATCC 14550 was observed only during the phase of rapid growth. The present study showed also similar observation where maximum production of metabolites was found during 24 to 48hours of incubation the phase of rapid growth for the Bacillus subtilis, whereas according to Egoror, et al., 1986 maximum efficiency of thebacitracin synthesis in case of B. linchenformins coincides with the end of exponential growth phase and the onset of speculation. It is noteworthy that Bacillus subtilis is an endospore forming bacteria and during inoculation from 0 to 48hrs bacterium maximally utilizes the nutrients available in the surrounding synthetic medium and produces amount of antimicrobial metabolites.
Purification of crude extract by chromatography was by three steps HPLC. The active fractions were pooled together and showed maximum activity against S pyogenes and S aureus and minimum of E coli and pseudomonas aeruginosa. The result of the chromatography with arrow indicating the bioactive position (A) and (B) HPLC profile of the crude antimicrobial substance. The minimum inhibitory concentrations of the crude and purified extracts were carried out. The minimum inhibitory concentration (MIC) of the crude extract for gram positive bacteria (S pyogenes) was found to be 1.0µg/ml to 0.4µg/ml, for S. aureus 0.39µg/ ml to 0.26µg/ml, for gram-negative bacteria (E. coli and P. aeruginosa) shows 4.8 and to 2.8µg/ml for extract I, II, III respectively while Pseudomonas aeruginosa showed MIC values of 2.0µg/ml to 1.9µg/ml respectively. The partially purified extracts, Staphylococcus aureus for had MIC values of 0.25µg/ml, S. pyogens, 0.5µg/ml P. aeruginosa, 15µg/ml and E. coli 10µg/ml. The antimicrobial produced by B. subtilis was found to be inhibitory to only gram positive with the crude extract but had inhibitory effect on both gram-positive and gram-negative after it was purified but effectively more on gram positives. Showing that most of the peptide antibiotics produced by Bacillus are active against mainly Gram-Positive bacteria [6].
Conclusion
The findings of the present study, has led us to conclude that the antibiotic producing bacteria. Bacillus subtilis could easily be isolated from the soil. It was the best antibiotic producing strain amongst the tested organisms. It does not produce traits that cause diseases. The antimicrobial compound it produced was identified as Bacilysosin. It has narrow spectrum of antibacterial activity yet it has high antibiotic potential. However, further studies are needed to determine the involve efficacies and cytotoxic effects of their utility in clinical applications. Also since the potential risk associated with use of this bacterium is low it can safely be manipulated genetically to yield large numbers of antibiotic metabolites and used in different fields of medicine, agriculture (like fermentation) Biology and genetic engineering.
References
-
Ara K, Ozaki K, Nakamura K, Yamane K, Sekiguchi J, et al. (2007) _Bacillus_ Minimum genome factory: Effective utilization of microbial genome information. Biotechnol Appl Biochem 46(pt 3): 169-178.
-
Tamehiro N, Hosoya YO, Okamoto S, Ubukata M, Hamada M, et al. (2002) Bacilysocin, a Novel Phospholipid Antibiotics produced by _Bacillus subtilis_ 168. Antimicrob Agents Chemother 46(2): 315- 320.
-
Stein T (2005) _Bacillus subtilis_ antibiotics: Structures, syntheses and specific functions. Mol Microbiol 56(4): 845-857.
-
Zuber P, Nakano MM, Marahiel MA (1993) Peptide Antibiotics. In: Sonenshein AL, Hoch JA, Losick R (Eds.), Bacillus subtilis and Other Gram‐Positive Bacteria: Biochemistry, Physiology, and Molecular Genetics. John Wiley & Sons, Inc., USA.
-
Kuta FA, Nimzing L, Orka’a P (2009) Screening of _Bacillus_ species with Potentials of Antibiotics Production. J App Med Informatics 24(1): 42-46.
-
Epperson JD, Ming LJ (2000) Proton NMR studies of Co (II) complexes of the peptide antibiotic bacitracin and analogues: insight into structure-activity relationship. Biochemistry 39(14): 4037-4045.
-
Yu CS, Yim KY, Tsui SKW, Chan TF (2012) Complete genome Sequence of _Bacillus subtilis_ strain OB928, a strain widely used in _Bacillus subtilis_ genetics studies. J Bacteriol 194(22): 6308-6309.
-
Moszer I, Jones LM, Moreira S, Fabry C, Danchin A (2002) The reference database for the _Bacillus subtilis_ genome. Nucleic Acids Res 30(1): 62- 65.
-
Saito S, Kakeshite H, Nakamura K (2009) Novel Small RNA – encoding genes in the intergenic regions of _Bacillus subtilis_. Gene 428(1-2): 2-8.
-
Sonenshien AL, Hoch JA, Losick R (2001) _Bacillus subtilis_ and its Closet Relative from Gene to Cells. American Society for Microbiology Press, Washington, DC.
-
Earl AM, Losick R, Kolter R (2008) Ecology and Genomics of _Bacillus_ _subtilis_. Trends Microbiol 16(6): 269-275.
-
Jamil B, Hasan F, Hameed A, Ahmed S (2007) Isolation of _Bacillus subtilis_ and mh-4 from soil and its Potential of Polypeptidic Production. Pak J Pharm Sci 20(1): 26-31.
-
Cockerill FR (2012) Methods for dilution Antimicrobial susceptibility tests for Bacteria that grow aerobically; Approved Standard. 9th (Edn.), CLSI 32(2).
-
Nishijima M, Akamatsu Y, Nojima S (1974) Purification and Properties of a Membrane – Bound Phospholipase A1 from _mycobacterium Phlei_. J Biol Chem 249(17): 5658-5667.
-
Ramachandran R, Chalasani AG, Lal R, Roy U (2014) A broad spectrum antimicrobial activity of _Bacillus subtilis_ RLID. Scientific World Journal, pp: 968487.
-
Hudzicki J (2009) Kirby-Baurer Disk Diffusion Susceptibility Test Protocol. Am Soc Microbiol J pp: 1-23.
-
Adimpong DB, Nielsen DS, Sørensen KI, Derkx PMF, Jespersen L (2012) Genotypic characterization and safety assessment of lactic acid bacteria from indigenous African fermented products. BMC Microbiology 12: 75- 89.
-
Chimatara Joyce Egbulonu, Joy Nkeiruka Dike Ndudim, Henry Chidozie Amah and Chizaram Winners Ndubueze. (2022). Molecular Characterization of Bacillus subitlis Isolated from some Environmental Samples in Umuahia, Abia State, Nigeria. Journal of Bio Innovation, 11(3): 665-675.
- Antifungal Activity of New Acetophenone Derivatives
- Interconnected Microbiomes Human Health Within an Environmental Framework
- Silkworm-Based Vaccine Production for H5N1: A One Health Approach to Pandemic Preparedness
- Microbial Diversity and Lipolytic Activity of Bacteria and Fungi from Oil-Contaminated Sites in Makurdi Metroplois
- Antibiotic Resistance Profile of Bacteria Isolated at the Central Laboratory of the National Hospital Center of Nouakchott
- Epidemiology and Sensitivity to Antibiotics of Germs Isolated from Blood Cultures in the Laboratory of the National Hospital Center of Nouakchott-Mauritania