Recreational Seawater Quality of the Northern Region of Gaza Strip Beaches
Fecal indicator bacteria are widely used to determine the quality of water in conjunction with the use of physicochemical parameters. Water sample were collected from five seawater stations along the Gaza city beach were sampled fortnightly for eight months from January to August 2021. Samples were collected at five locations along the sea coastline in the Gaza City and analyzed for the microbiological parameters (total coliform, fecal coliform, and fecal streptococci) as well as the physicochemical parameters (pH, temperature, BOD, O2, nitrate, ammonia, and EC). The results showed statistically significant correlation between microbiological and physiochemical parameters. Furthermore, the result demonstrated that Al-shate (Location 4) is the most polluted Location, as indicated by the highest geometric mean of the fecal indicator bacteria, in which the majority of samples were poor (highly polluted). In conclusion, the current study highlights a significant pollution in most sites investigated along the Gaza city coastline. Further study should be done along Gaza strip beaches to investigate the entire coastline of the Gaza strip as well as to detect the trends in the seawater quality.
Introduction
The overcrowdings of the main urban centers in the Gaza Strip strongly urges people to seek some relaxation in semi natural and picturesque landscape units away from the daily hassle of city life.Marine water recreational activities form an integral part of the tourist industry in Gaza strip making the protection of the marine environment of particular economic concern [1]. The Gaza strip coastline has a length of approximately of 45 km of which an estimated 40 km used for recreational waters is matter of concern. The need for better definition of what should be acceptable microbiological indicators is widely recognized. When fresh water or marine swimming areas are polluted, environmental as well as health issues arise. The lack of operational and efficient waste water treatment plants makes waste water the main source of pollution of the coastal zone of the Gaza Strip. The waste water is discharged untreated or partially treated along this shoreline. In addition to the treatment plants, there are more than 20 individual sewage drains ending either on the beach or short distance away in the surf zone. High percentage of waste water that is generated in Gaza is discharged without treatment into the sea water (5000 cubic meter per day) [2].
The health risks associated with the recreational use of surface waters have been studied extensively by many workers. Coliform and thermo tolerant coliform are known to have external sources. These two indicator groups can grow to very high densities in industrial wastewater such as those discharging by pulp and paper mills [3]. Epidemiological health a study of the risks in bathing waters has been conducted USA and the UK [4] presented strong evidence for disease risk from marine recreational water. Different indicators and different indicator levels identified as standards are used by water quality programs in different states, countries, and regions. Today, the most commonly measured bacterial indicators are total coliforms (TC), fecal coliforms (FC), and enterococci (EC). The threshold limits for each of the three indicators were established using different procedures [5, 6]. The acceptable levels of these fecal indicators have been determined during epidemiological studies [7]. For marine waters designated as swimming areas, the geometric enterococci density mean (in CFU/ 100 ml) should not exceed 35 or 104 when using a single sample maximum (SSM) limit. In areas infrequently used for recreation the limit is 501 (Although no standard for E. coli have been adopted for marine waters, the geometric mean standard for freshwater should be <126 while the SSM fluctuates from 235 to 575 CFU/100 ml [8, 9].
The objectives of the present study were to determine the pollution rate in the selected area and the effect of geographical location on microbiological characteristics of the seawater, and to investigate the physicochemical parameters and their relation to water pollution.
Materials and Methods
Sample Locations
A total of five locations were selected along the sea coastline in northern region of Gaza Strip. The sample locations as follow: Site 1, the border station; Site 2, Abu Baker station; Site 3, Alshikh Radwan station; site 4 Alshate station, and site V Aldafer station.
Sample Collection
Sampling was performed according to the world health organization manual for recreational water and beach quality monitoring and assessment (1995). The sampling frequency was fortnightly (twice per month). Five hundred ml polyethylene bottles were pre-sterilized to be used for water samples collection. The samples were collected below 20-30 cm of the water surface in a special way. Afterward the bottles were placed in ice-bag, transported to laboratory for processing both bacteriologically and Physico-chemically.
Microbiological Analysis
The procedure used in the microbiological analysis was recommended by standard methods according to American Public Health Association APHA [10]. The membrane filter technique was used in the determination of bacteria in the sea water. Water samples were passed through a Millipore filter under negative pressure vacuum. The volume of the samples was 100 ml. The membranes were transferred to the medium surface incubated for 24-48 hrs at 35°C or 45°C. The colonies were counted and identified by specific biochemical tests (API 20E). The medium used for isolation of total coliform was M-endo agar (Difco). M-FC medium agar (Biolife) used for isolation of fecal coliform, and M-Enterococcus agar (Difco) for fecal streptococci.
Physicochemical Analysis
It includes these parameters:
- pH value: pH electrode meter was used
- Temperature (T): a thermometer was used to measure the temperature at place of sample collection.
- Electric conductivity (EC): electric conductivity meter was used.
- Nitrate (NO3-): the procedure used was called Brucine method.
- Ammonia (NH
The Palestinian national authority has no standard for sea water quality assessment [11] The European countries listed below were used Table 1.
| Indicator | Excellent | Satisfactory | Poor |
|---|---|---|---|
| Total coliform | 500 or less | 500-10,000 | >10,000 |
| Fecal coliform | 100 or less | 100-2,000 | >2,000 |
| Fecal Streptococci | 100 or less | 100-2,000 | >2,000 |
Table 1: Seawater qualities by physicochemical analysis were illustrated in Table 3.
Statistical Analysis
Statistical analysis was carried out using SPSS version 15 for Windows (SPSS Inc., Chicago, IL, USA). For continuous data, mean, SD, geometric mean, range, percentiles, correlation and regression coefficient were calculated. A p-value of <0.05 was considered statistically significant.
Results
Microbiological & Physicochemical Analysis
All the tested collected samples obtained from the five locations were examined for microbiological quality for these major pathogens (total coliform, fecal coliform and fecal streptococci) and presented in Table 2. Seawater qualities by physicochemical analysis were illustrated in Table 3.
| Microbial Parameter CFU/ml | Site I | Site 2 | Site 3 | Site 4 | Site 5 |
|---|---|---|---|---|---|
| Total Coli-form | |||||
| Geometric Mean | 217.6 | 253.4 | 413.9 | 5587.3 | 139.6 |
| Range | 300 | 398 | 1030 | 15200 | 140 |
| Max | 400 | 508 | 1100 | 16000 | 210 |
| Min | 100 | 110 | 70 | 800 | 70 |
| No. of Samples | |||||
| Excellent | 40 | 30 | 15 | 0 | 40 |
| Satisfactory | 0 | 10 | 0 | 15 | 0 |
| Poor | 0 | 0 | 25 | 25 | 0 |
| 80th | 400 | 500 | 1000 | 15000 | 200 |
| 95th | 400 | 508 | 1100 | 16000 | 210 |
| Fecal Coli-form | |||||
| Geometric Mean | 120 | 142.5 | 249.7 | 3229 | 77.4 |
| Range | 200 | 370 | 880 | 10600 | 140 |
| Max | 280 | 400 | 900 | 11000 | 160 |
| Min | 80 | 30 | 20 | 400 | 20 |
| No. of Samples | |||||
| Excellent | 10 | 15 | 10 | 0 | 20 |
| Satisfactory | 30 | 25 | 30 | 10 | 20 |
| Poor | 0 | 0 | 0 | 30 | 0 |
| 80th | 150 | 400 | 800 | 10000 | 150 |
| 95th | 280 | 400 | 900 | 11000 | 160 |
| Fecal Strept. | |||||
| Geometric Mean | 129 | 143.3 | 294.17 | 4100 | 67.11 |
| Range | 130 | 364 | 1170 | 13700 | 120 |
| Max | 200 | 400 | 1200 | 14000 | 130 |
| Min | 70 | 36 | 30 | 300 | 10 |
| No. of Samples | |||||
| Excellent | 10 | 10 | 15 | 0 | 15 |
| Satisfactory | 30 | 30 | 25 | 10 | 25 |
| Poor | 0 | 0 | 0 | 30 | 0 |
| 80th | 160 | 390 | 1110 | 12000 | 120 |
| 95th | 200 | 400 | 1200 | 14000 | 130 |
| Physicochemical Quality | Site I | Site II | Site III | Site IV | Site V |
| pH | 7.9-8.2 8.06 ± 0.12 | 8.0-8.3 8.18 ± 0.1 | 7.9-8.3 8.09 ± 0.15 | 8.0-9.7 8.37 ± 0.55 | 8.0-8.3 8.15 ± 0.09 |
| BOD | 1.1-1.6 1.35 ± 0.17 | 0.8-1.8 1.16 ± 0.36 | 0.61-1.52 0.975 ± 0.35 | 0.3-3.3 1.99 ± 1.04 | 0.3-0.9 0.53 ± 0.22 |
| DO | 3.8-4.3 4.14 ±0.19 | 2.2-3.2 2.75 ± 0.37 | 3.2-4.3 3.76 ± 0.33 | 1.8-4.0 2.71 ± 0.70 | 3.8-4.5 4.19 ± 0.7 |
| NH3 | 0.4-0.9 0.72 ± 0.17 | 0.7-1.2 0.92 ± 0.17 | 0.17-0.6 0.35 ± 0.16 | 0.5-1.4 1.0 ± 0.33 | 0.01-0.4 0.29 ± 0.39 |
| NO3- | 0.3-0.9 0.8 ± 0.23 | 2.8-4.3 3.52 ± 0.56 | 0.1-0.7 0.4 ± 0.2 | 0.6-1.5 1.14 ±0.31 | 0.01-0.4 0.21 ± 0.39 |
| T | 14.2-26 19.29 ± 4.5 | 13-26 19.37± 4.66 | 14.7-24.5 18.5 ± 3.49 | 14-26 18.99±4.29 | 14.5-26.4 19.5 ± 4.43 |
| EC | 48-59 54.76± 3.14 | 50-57 54.5 ± 3.82 | 50.7-60.2 54.59 ± 4.2 | 51-59 56.25 ±2.49 | 47.5-55 50.44 ± 2.3 |
Table 2: Seawater quality by physiochemical parameters.
Correlation between Total Coliform and Certain Microbiological Parameters
Statistical analysis of the results presented in (Figures 1 & 2) showed strong correlation between both fecal coliform and fecal streptococci, and total coliform over eight months. There was a strong correlation, where r=0.99 is significant at 0.01 level (2 tailed). The fecal coliform and fecal streptococci increase as the total coliform increase.
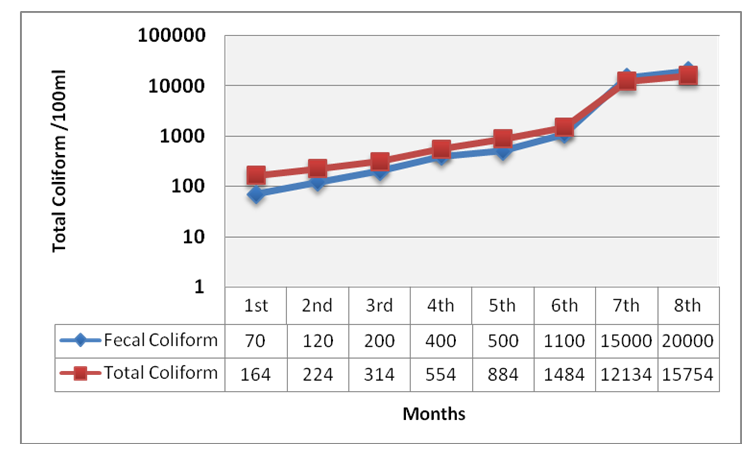
Y= 296.53+0.779X, r=0.999 Figure 1: Correlation between total coliform and fecal coliform.
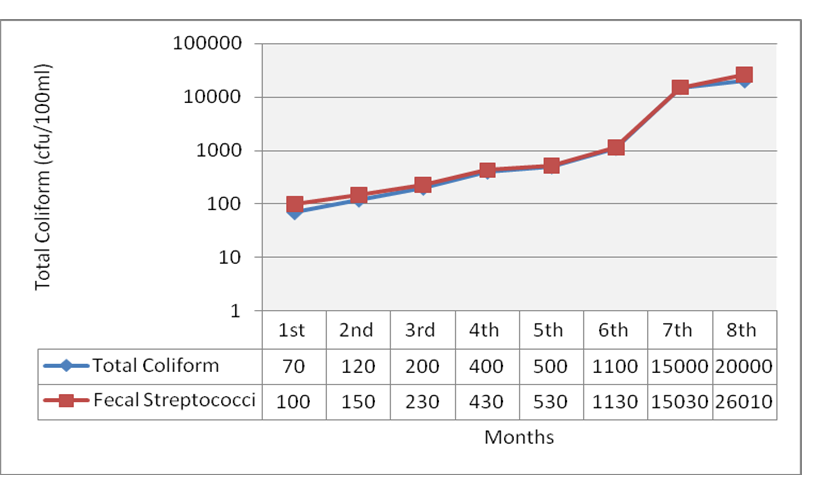
Y= -170.34+1.20X, r= 0.990 Figure 2: Correlation between total coliform and fecal Streptococci (Enterococci).
Correlation between Total Coliform and Certain Physicochemical Analysis
Correlation between total coliform and certain physicochemical parameters was illustrated in Figures 3-5 below:
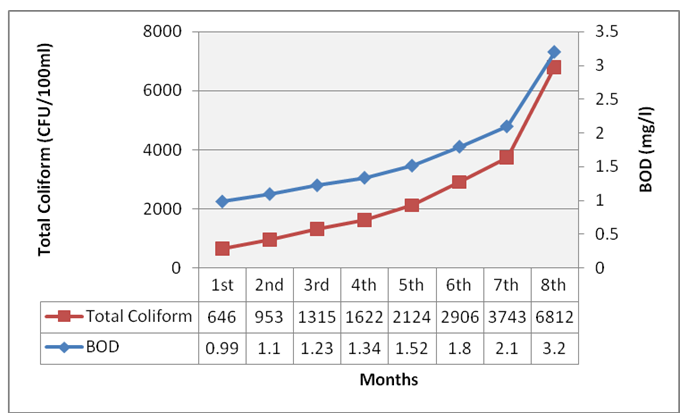
Y=2116.58+2790.812X, r=0.999 Figure 3: Correlation between total coliform and BOD.
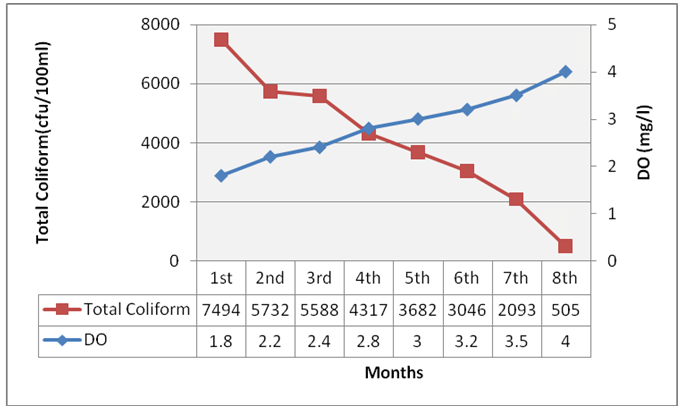
Y=12893.65 -3086.99X, r=-0.997. Figure 4: Correlation between total coliform and DO.
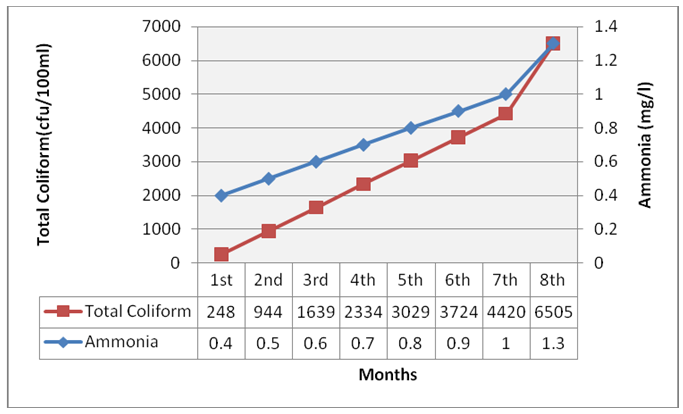
Y=-2532.43+ 6951.89, r = 0.999 Figure 5: Correlation between total coliform Ammonia.
Discussion
Seawater pollution is one of the most important problems in Gaza. Detailed studies should be carried out to determine the extent of microbiological and chemical contamination of the seawater. The coastal zone is very important ecologically and economically. The beach is the only continuous and accessible recreational area for the population in Gaza city. This study focus on the analysis of seawater samples from different locations along the beach of Gaza City, Palestine, over eight months. The Results obtained can be summarized as follow:
The Present study describes the extent of contamination of seawater at the beach of Gaza city. The study was confined on the microbiological and physicochemical parameters that indicate the pollution of seawater. Microbiological studies and physicochemical parameters examined in the present study include: Total coliforms (TC), Fecal Coliforms (FC), and Fecal Streptococci (FS) as well as pH, temperature (T), electrical conductivity (EC), nitrate (NO3 -, NH3, dissolve oxygen (DO) and biochemical oxygen demands (BOD5). The locations included in this way were selected in such way to cover the beach of Gaza Strip northern area. This study was implemented along the selected coastline to assess the hygienic water quality in order to provide an indication about the actual magnitude of the fecal pollution. This type of baseline study is required to develop monitoring strategies and management plan for the coastal area. The microbiological results indicated high and variable bacterial density followed by specific temporal trend at all sampling locations. The standard of safe recreational water differs according to the different environmental agencies not only in the allowed limit, but also in the type of indicator for example in California state, the standard are 1000 CFU/100ml for total Coliform, 400 CFU/100 ml for fecal Coliform and 104 CFU/100ml for fecal streptococci [12]. The WHO depends on fecal streptococci in which the standard is 200 CFU/100ml [13].Total coliform is a good indicator for pollution of seawater, because most enteric bacteria pathogens die off very rapidly outside the human gut whereas indicator bacteria such as E. coli will persist for period of time [14]. The fluctuations of the numbers s of total coliforms in the present study were noted and ranged between (70 to 16x103 CFU/100ml). The maximum number of these bacteria was obtained at location (4) during April while the lowest number was recorded at location (5) during August.
The permissible limit for beach seawater according to (Ministry of health) for total coliform is excellent (500 or less), satisfactory (500-10,000), poor (>10,000). Therefore, some of the results recorded in the current study exceed the permissible limit and proved the water bodies to be polluted spots. Our results in concordance with similar other studies [15]. The fecal coliform organisms when present in the water undoubtedly indicate that the water is mixed with feces. Fecal coliform concentration fluctuation varied from (20 to 11x103 CFU/100ml). The maximum value was recorded at location (4) during April, while the lowest value was recorded at location (3 and 5) during August. The permissible limit for beach according to European countries guidelines (used by Palestinian ministry of health) is as follow: excellent (100 or less), satisfactory (100-200), and poor (>2000/100 ml), [11]. In case of US Environmental Protection Agency [8] recommend standards E. coli value should be 126/100 ml for multiple sample, while for single sample it is 235/100 ml. Therefore, some of the recorded results exceeded the permissible limit for both European countries standard and these proved the water bodies to be polluted with material of fecal origin. Water microbiology quality standards for the recreational water are based on coliforms indicators as predictors of the presence of pathogenic microorganisms * [4, 16].
The fecal streptococci present in water indicate that the water has been polluted with feces (sewage) and has the same indicative power as the fecal coliform. Some environmental; organizations believe that fecal streptococci represent the true evidence for fecal pollution more than that of fecal coliform. This is because the differential die off for enterococci is not as great as that for E. coli. In this work fecal streptococci density ranged from (10 to 14x103 CFU/100ml). The maximum average value was obtained at location (4) during April, while the lowest average value of bacteria was recorded at location (5) during August. Similar results were obtained worldwide. Dabi, et al. [17] stated in their study to evaluate microbial and nutrient pollution of coastal pathing in Mauritins that range of total coliform was (346-2020 CFU/100ml), fecal coliform was (130-2000 CFU/100ml). The ratio of fecal coliform and fecal streptococci was used worldwide to evaluate the contamination of seawater. Generally, the results recorded in this study revealed clearly that there is pollution in the seawater. The high rate of pollution was recorded during April, while during August the pollution has been declined. These may attributed to the disposal of sewage directly into seawater without treatment during February, March, and April which are rainy months, while at July and August months most of the disposal points are closed or redirected into other channel except few disposals points that remain opened. The number of bacteria diminished to very low rate because the municipalities of Gaza City close these disposals and redirect them into the collection area (mainly north Gaza City and Gaza).
Physical and chemical properties of the tested seawater are the second major part of this study. Various parameters such as pH,T, EC, NO3 -, NH3, DO, BOD5 were determined and showed variable results at the selected locations over the eight months. pH is important factor affect the survival of bacteria in seawater. Seawater pH normally range between 7.3-8.5 and is influenced by temperature, pressure, photosynthetic and respiratory activities of microorganisms [18]. In this work the measured pH value of all stations. This may be explained by the algal growth and depletion of CO2 which is conversely related to pH. When all seawater measurements were pooled and statistically analyzed using person correlation coefficient, pH values showed negative correlation with electrical conductivity, temperature, ammonia, and nitrate. These factors are important in the process of algal growth and therefore could be considered as controlling factor for CO2 and consequently affect pH values. This finding is supported by Schulze, et al. [19]. Algal blooms which are often initiated by an overload of nutrients can cause pH to fluctuate dramatically over a few hour periods, generally stressing local organisms. The effect of temperature on microorganisms was documented. The recorded temperature of the surface water found to be not to exceed 28 °C in July and August (summer months). Bacteria can grow well in the region with temperature ranging between 20°C to 30 °C. Low seawater temperature specifically in January, February, and March are obvious shock for microorganisms whose optimal growth occurs around 37°C [20]. However optimal survival temperature is not necessarily the same as for growth and most reports indicate enhanced stability of E. coli at lower temperature. That in part may explain the higher counts obtained in winter months (January to February) than in summer months (July to August).
The chemical analysis of nitrate of seawater samples revealed high concentration. Over the different months, the obtained results exceeded the permissible limit in some locations. The main source of nitrate in the seawater is the disposal of sewage into the seawater. The fluctuation of the nitrate level was ranged between 0.01 to 4.3 mg/dl as a result of activities of different organisms present in the water. The nitrate in the seawater can be decomposed by denitrifying bacteria by a process called denitrification. Algae usually present in the seawater and survived well in the presence of eutrophoid water. The algae uptake of nitrate and the consumption of bacteria for these nitrogenous materials are a process uniformly proceeded in the eutrophoid water. Second important nitrogenous material is the ammonia which is considered one of the metabolic end products of the microbial physiology in order to obtain the energy [21]. The results showed the highest ammonia level was in April at location (4), while during February at location (5) the lowest ammonia level was recorded.
The concentration of ammonia in seawater is connected with the discharge quantities of organic material to the sea. The temperature increase will speed up hydrolysis of amino group to ammonia (ammonification process). Through this process, the ammonia will be oriented from nitrogenous organic material. The oxidation of ammonia will lead to utilize oxygen dissolved in water. In addition, ammonia in solution is highly toxic to most species of fish at low concentration [22]. The Gaza coastline basin is bounded to the south by the Nile delta and to the North by Hifa coast; it is an extension of the river Nile system. It is a geographic location in the course of counter clockwise current, which characterize the eastern parts of the Mediterranean Sea. This situation causes station of enormous of sand particles and suspended solids at the Gaza city. The amount of slit deposition is estimated at 65 0000 tons per year [2]. The dominantly sandy and rockless sea floor of the Gaza coast doesn’t encourage fish to inhabit, because the algal flora of the marine basin is low in number that the algae need the rocks as fixation blocks for their survival cycle. The oxygen available in the water will be in low concentration. The dissolved oxygen concentrations of the tested water samples were noted in the range (1.8-4.5mg/ l). The maximum concentration was obtained at location 5 during April, while the lowest mean value was recorded at location 4 during January.
In the present study a reverse relationship between the number of bacteria and the dissolved oxygen (DO) was noted. This is due to the normal physiological cycle of aerobic bacteria in which exhaust oxygen and also the normal algal flora are low in the seawater. Therefore, low dissolved oxygen was indicator for seawater pollution [19, 23]. In the present investigation, BOD5 concentration varied between different locations and months, the fluctuations of the average values were ranged between (0.3 to 3.3 mg/L). The highest mean value of BOD5 was detected at location 4 and 5 during July. It was noted that there is a parallel relationship between the number of bacteria and the dissolved oxygen demand BOD5. There is increased in the BOD5 concentration when the bacterial density is high. Schulze, et al. [19] reported that unpolluted natural water will have a BOD5 of 5mg/ml or less. In this work, it was found that BOD5 level was correlated well with nutrients (ammonia and nitrate) as well as fecal coliforms. These positive correlations are logical and should be improved by the fact that the presences of nutrients under normal conditions support the growth of bacteria as well as other organisms leading to higher level of BOD5.
Statistical analysis of the interrelationship between the tested microbiological (TC, FC, FS) and physicochemical analysis (pH, Temp, EC, NO3 -, NH3, DO, and BOD5) indicate significant correlation between these parameters. The explanation for this finding may be two folds, first, the pollution of seawater originate from the same source which is believed to be the wastewater and the sewage water disposed without treatment. The second point, the mutual relation between the parameter e.g. an increase in the number of bacteria in water system will increase BOD5 and influence the persistence of bacteria. The relationship between total coliform count and certain microbiological and physicochemical parameters (NO3- , NH3, DO, and BOD5) overall the study period was analyzed, it was found that increase in NH3, NO3 -, and BOD was accompanied by increase in the fecal indicator bacteria, while in case of DO the relation was reversible, the increase in the fecal indicator bacteria was accompanied by decrease in DO level. Once again these showed that total coliform is a good indicator for testing the contamination of the water and must be included in any study concerned with the subject.
Conclusion
In conclusion, the results of the current study revealed a high pollution rate in most sites investigated along the Gaza city coastline with the highest pollution in location (4). This was mainly occurred due to the disposal of sewage and wastewater into the seawater without treatment. As a result, we necessarily recommend developing suitable national policies, rules and actions to improve the recreational area of the Gaza City coastline environment.
References
-
Gaza Environmental Profile (GEP) (1995) Palestinian Authority. Ministry of planning and international Cooperation, Part Two, pp: 10-30.
-
Palestinian Environmental Authority (2001) Assessment of Land Based Pollution Sources. Palestinian National Authority, pp: 40-55.
-
WHO (1999) Health-Based Monitoring of Recreational Water: the Feasibility of a new approach. The Annapolis Protocol outcome of an expert consultation, Annapolis, USA. / co-sponsored by USEPA. World Health organization, Geneva, pp: 1-50.
-
Cabelli VJ, Dufour AP, McCabel LJ, Levin MA (1982) Swimming associated Gastroenteritis and water quality. Am J Epidemiol 115(4): 606-616.
-
Noble RT, Moore DF, Leecaster MK, McGee CD, Weisberg SB (2003) Comparison of total coliform, fecal coliform, and enterococcus bacterial indicator response for ocean recreational water quality testing. Water Res 37(7): 1637-1643.
-
Bachoon DS, Markand S, Otero E, Perry G, Ramsubhag A (2010) Assessment of non-point sources of fecal pollution in coastal waters of Puerto Rico and Trinidad. Mar Pollut Bull 60(7): 1117-1121.
-
EPA (1986) Ambient water quality criteria for bacteria. Washington, D.C., USA, pp: 1-24.
-
US Environmental Protection Agency (2000) Beaches Environmental Assessment, Closure vand health Program.
-
Clesceri LS, Greenberg AE, Eaton AD (1999) Standard Method for the Examination of Water and Wastewater. 20th(Edn.), American Public Health Association, Washington D.C., USA.
-
Ministry of Health (MOH) Palestinian national authority (2000) The Status of Health in Palestine. Annual report, pp: 20-40.
-
California State Water Resources Board (1993) California inland Surface Water Plan. Water Quality Plan for Inland Surface Water of California.
-
World health Organization WHO (1995) Manual for Recreational Water and Beach Quality Monitoring and Assessment. Draft WHO, regional office for Europe, European Center for Environment and Health.
-
Ward NR, Wolf RL, Olson BH (1984) Effect of pH application technique and chalorine to nitrogen ratio on disinfectant activity of inorganic chloramines with pure culture bacteria. Applied and Environmental Microbiology 48(3): 508-514.
-
Banat IM, Hassan ES, Shahawi MSE, Hilal AHA (1998) Post-Gulf-War Assessment of Nutrients, Heavy Metals, Hydrocarbons, and Bacterial Pollution in the United Arab Emirate coastal waters. Environ Intern 24(1-2): 109-116.
-
EEC (European Economic Community) (1976) Council directive of 8 December 1975 concerning the quality of bathing water. Official Journal of the European communities 31: 1-7.
-
Daby D, Turner J, Jayo C (2002) Microbial and Nutrient Pollution of Coastal Bathing Water in Mauritins. Environ Int 27(7): 555-566.
-
Harvery HW (1957) The Chemistry and Fertility of Seawater. 2nd (Edn.), Cambridge University Press, London, pp: 234.
-
Lutz DS (2013) Water Quality Studies Red rock and Saylorville Reservoirs Des Moines River, Iowa. Annual Report. Department of the Army, Rock Island District, Corps of Engineers, Rock Island, Illinois 61201.
-
Neidhardt FC, Curtiss R (1996) Escherichia coli and Salmonella: Cellular and Molecular Biology. 2nd(Edn.), ASM Press, Washington, D.C., USA.
-
Appleyard SJ (1996) Impact of liquid waste disposal on potable ground water resources near Perth, Western, Australia. Environmental Geology 28: 106-110.
-
Horana NJ (1997) Biological wastewater treatment system. Sohnwilly and Sons, UK, pp: 53-78.
-
Bartram J, Rees G (2000) Monitoring Bathing Water: A Practical Guide to the Design and Implementation of Assessments and Monitoring Programmes.
-
Savichtcheva O, Okayama N, Okabe S (2007) Relationships between Bacteroides 16S rRNA genetic markers and presence of bacterial enteric pathogens and conventional fecal indicators. Water Res 41(16): 3615-3628.
- Antifungal Activity of New Acetophenone Derivatives
- Interconnected Microbiomes Human Health Within an Environmental Framework
- Silkworm-Based Vaccine Production for H5N1: A One Health Approach to Pandemic Preparedness
- Microbial Diversity and Lipolytic Activity of Bacteria and Fungi from Oil-Contaminated Sites in Makurdi Metroplois
- Antibiotic Resistance Profile of Bacteria Isolated at the Central Laboratory of the National Hospital Center of Nouakchott
- Epidemiology and Sensitivity to Antibiotics of Germs Isolated from Blood Cultures in the Laboratory of the National Hospital Center of Nouakchott-Mauritania