Assessing the Human Health Risk from Heavy Metal- Contaminated Vegetables Grown Close to the Tannery Industrial Area Using the Hazard Index (HI) and Hazard Quotient (HQ)
To assess the contamination load in vegetables and its possible human health hazards, heavy metals concentration (Cr, Cd, Cu, Pb, Ni, and Zn) in vegetables grown in the vicinity of the studied tannery area were determined. Health risk due to the consumption of vegetables was calculated from the metal concentration of the studied vegetables and the study signifies more potential to cause health hazard (cancer) (Hazard Index>1). The present study indicated that concentrations of Cr in the vegetable species were within the range of 7.5-9.75, 5.38-10.14, 25.5-28.5 and 2.65 mg kg-1 of dry weight (DW), in bottle gourd fruit, bottle gourd shoot, kalmi shoot, and red amaranth, which was above the MPL (1-2 mg/kg). The findings revealed that the mean concentration of the studied heavy metals (Cr, Cd, Pb, Ni, Cu, Zn,) exceeded the MPL in most of the measured vegetables because of higher translocation from the source to edible parts. For the majority of the samples, the ADI values of Cr and Pb were higher than the PMTDI. Open dumping of tannery wastes and effluents, and tanning activities involve serious environmental hazards. Adequate preventive measures should be taken in tannery industrial activities with a view to ensuring a safe, sound, and healthy environment for the greater benefit of Bangladesh.
Introduction
Both industrialization, anthropogenic and geological sources have caused widespread heavy metal and metalloid pollution in Bangladesh, which is now posing substantial threats to the local people. Toxic metals are known to have serious health implications, including carcinogenesis- induced tumor promotion, and hence the growing consciousness about the health risks associated with environmental chemicals has brought a major shift in global concern towards prevention of heavy metal accumulation in soil, water, and vegetables [1].
Hazaribagh tanneries were moved to the Tannery Industrial Estate in Savar, in an effort to save the Buriganga river which has been polluted due to industrial waste dumping from manufacturers and thereby causing environmental pollution especially due to heavy metals and organic toxins [2]. With the advent of industrialization, wastewater from industries or other sources carries appreciable amounts of toxic heavy metals such as Cd, Cu, Zn, Cr, Ni, Pb, and Mn in surface soil which create a problem for safe rational utilization of agricultural soil [3]. Long- term use of industrial or municipal wastewater in irrigation is known to have a significant contribution to the content of trace and heavy elements in surface soil [4]. As a result, excessive accumulation of trace elements in agricultural soils through wastewater irrigation may not only result in soil contamination but also affect food quality and safety [4]. Waste water derived from tannery sludge is extremely colored due to physico-chemical treatments; contain considerable amounts of tannins and their phenolic derivatives [5]. Phenols and hydrocarbons are considered common environmental pollutants even in low concentrations [6]. Very high concentration of heavy metals (Cr, Cu, Cd, Pd, Ni and Zn) in soil, water and plants around tannery industrial area were reported in many researches [7] threating to food security and affects human health very badly.
Heavy Metals - in low doses some of them as copper or nickel are even essential trace elements for animals and humans. A major problem is their bioaccumulation, which leads to toxicity and long term effects which include fatal diseases like cancer [8], Parkinson`s or Alzheimer’s disease [8]. The primary goals of this study were to evaluate the risks to human health associated with eating vegetables contaminated with heavy metals that were grown in close proximity to the recently relocated Savar Tannery areas in Dhaka. Human health risks were assessed in both dry and wet seasons and were calculated using various indices, including Average Daily Intake (ADI), Hazard Quotiont (HQ), and Hazard Index (HI) in accordance with Kacholi and Shahu [9] and Bermudez, et al. [10].
Materials and Methods
Location Description
Savar is located at 23.8583°N 90.2667°E. It has 66,956 units of household and a total area of 280.13 square kilometres (108.16 sq mi). It is bounded by Kaliakair and Gazipur Sadar upazilas on the north, Keraniganj upazila on the south, Mirpur, Mohammadpur, Pallabi and Uttara thanas of Dhaka City on the east, and Dhamrai and Singair upazilas on the west. The land of the upazila is composed of alluvium soil of the Pleistocene period. The height of the land gradually increases from the east to the west. The southern part of the upazila is composed of the alluvium soil of the Bangshi and Dhalashwari rivers. Main rivers are Bangshi, Turag, Buriganga and Karnatali. The Rivers have become polluted due to industrial waste disposal.
Sample Collection Sites
Vegetable samples were collected during dry and wet season, from newly established tanneries at Hemayetpur savar upazila. Sampling sites were selected according to the main sources of wastes and effluent disposal around CETP (Central Effluent Treatment Plant). The GPS location and sample details are presented in Table 1. Three vegetable samples i. e. Bottle gourd (Lagenaria siceraria), Red Amaranth (Amaranthus cruentus ) and Water Spinach/Water Kalmi(Ipomea aquatica) were collected twice (wet and dry season) on the basis of the local environmental conditions and based on assumption of pollution intensity and types of samples around Savar tannery area. The sampling points were geo referenced with GPS (Geographical Positioning System) is presented in Table 1.
| Name of Vegetable | Latitude | Longitude |
|---|---|---|
| Bottle Gourd Fruit 1 | 23˚46΄24.38″N | 90˚14΄19.78″E |
| Bottle Gourd 1 shoot | 23˚46΄24.38″N | 90˚14΄19.78″E |
| Red Amaranth | 23˚46´2.81´´N | 90˚14´18.67´´E |
| Bottle Gourd 2 shoot | 23˚46´2.81´´N | 90˚14´18.67´´E |
| Bottle Gourd Fruit 2 | 23˚46´2.81´´N | 90˚14´18.67´´E |
| Kalmi 1 | 23˚45´28.78´´N | 90˚14´31.59´´E |
| Kalmi 2 | 23˚45’ 35.55’’ N | 90˚14’ 28.76’’ E |
Table 1: GPS Locations of vegetable samples collection.
Plant Samples Collection and Preservation
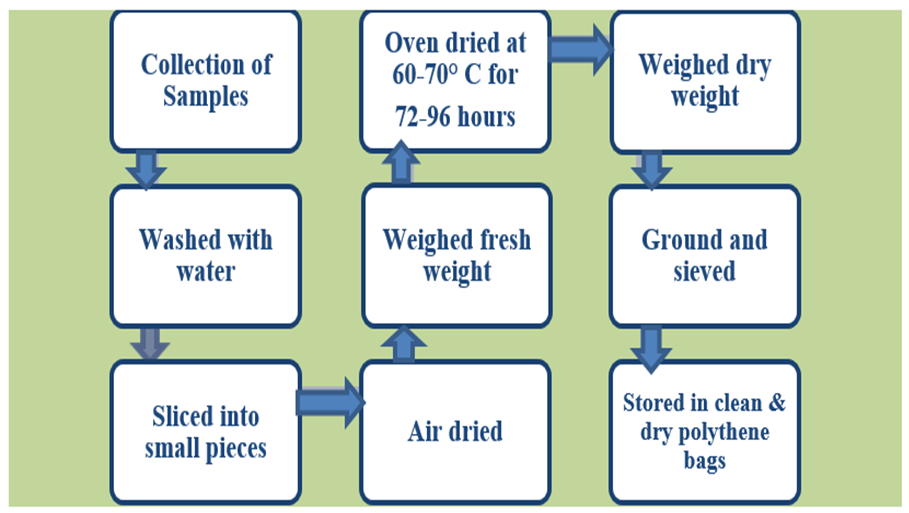
Vegetable samples i.e bottle gourd and red amaranth were collected in dry season and water spinach/water kalmi, collected in wet season, at the vicinity of the savar study area. The collected vegetable samples were washed thoroughly with fresh tap water and rinsed three times with distilled water to remove surface pollutants and any items adhering to the surfaces. Samples were open-air dried on paper for about 2 hours to eliminate excess moisture. The fresh weight of each sample was taken, then dried in an oven at 60-70° C for 72-96 hours depending on the sample size, and reweighed to determine the dry weight. The dried vegetable samples were ground by means of a clean pestle and mortar and passed through a 0.2 mm sieve to obtain homogenized sample. The powdered samples were then preserved in labeled clean dry polythene bags at ambient temperature before analysis. The sample preparation process is shown in Figure 1.
Digestion of Plant Samples
0.2 gram of the oven-dried sample was weighed into 100 ml beaker, followed by the addition of 20 ml conc. HNO3 and 10 ml conc. HClO4. The digestion was carried out on a hot plate at 150-200° C. The digestion procedure is shown in Figure 2.
![Figure 2: Digestion procedure of studied vegetable samples [11].](/fulltextimages/10993/fig_2.png)
Measurement of Heavy Metals Concentration
Concentration of heavy metals i.e. Cr, Cd, Cu, Pb, Ni, and Zn in the extracts of vegetable samples were analyzed by using Varian AA 240 Atomic Absorption Spectrophotometer (AAS) at the department of Soil, Water and Environment, University of Dhaka.
Human Health Risk Assessment
An assessment of the health risks posed in human beings by the consumption of contaminated vegetables was made by comparing the concentration of the contaminants recorded from the analysis with national and international safe limits. Different parameters like average daily intake, hazard quotient and hazard index were estimated to assess the health risk.
Average Daily Intake (ADI)
The ADI of a heavy metal was calculated as a product of average vegetable daily consumption per person, percentage of dry weight of vegetables, and average heavy metal concentration per dry weight vegetable as shown in the following equation [9]:
$$ AD I = A v _ {c o n s u m p t i o n} \times \% D W _ {V e g t a b l e} \times C _ {h e a v y m e n t a l} $$
Where ADI is average daily intake of heavy metal per
person per day (mg/person/day), Avconsumption is average
daily consumption of vegetable per person per day (g/
day), % DWvegetable is percentage of dry weight of vegetable
(%DW = [(100− % moisture)/100]), and Cheavy metal is average
heavy metal concentration of dry weight vegetable (mg/g).
The average daily consumption of vegetables reported
by Household Income and Expenditure Survey (HIES) of
Bangladesh HIES [12] is 166.1 g per person. The value 166.1 g/person/day is used in calculating the ADI values and an average weight of person is considered to be 60 kg [13]. If the ADI is above the Permitted Maximum Tolerable Daily Intake (PMTDI) value it may cause various health hazards.
Hazard Quotient (HQ)
Hazard quotient is a proportion of the probable exposure to an element/chemical and level at which no negative impacts are expected. When the hazard quotient is <1, this means no potential health effects are expected from exposure, but when it is >1, it signifies that there are potential health risks due to exposure [10]. The HQ is calculated as a fraction of determined dose to the reference dose as shown in the following equation:
$$ H Q = A D I / R _ {f} D $$
Where, ADI is the average vegetables intake per day (mg/
kg/day) and 𝑅f𝐷 is the oral reference dose of the metal (mg/
kg/day). 𝑅f𝐷 is an approximation of daily tolerable exposure
to which a person is expected to have without any significant
risk of harmful effects during a lifespan. RfD for Pb, Zn, Cu, Cd,
Cr, Ni, Fe and Mn is 0.004, 0.3, 0.04, 0.0005, 0.003, 0.02, 0.7
and 0.14 mg/kg/day, respectively, endorsed by WHO [14].
Hazard Index (HI)
An exposure to more than one pollutant results in additive effects. Thus, hazard index (HI) is a vital index that assesses overall likely impacts that can be posed by exposure to more than one contaminant. When the HI is >1, this suggests that there are significant health effects from consuming pollutants contained in a foodstuff. The HI is calculated as an arithmetic sum of the Hazard Quotient (HQ) for each pollutant as shown in the following equation [9]:
$$ H I = \sum_ {i = 1} ^ {n} H Q $$
Translocation Factor (TrF)
The Translocation Factor (TrF) of heavy metals in the three nutritionally important crops namely bottle gourd, water spinach (water kalmi) and red amaranth were calculated. The study served its importance due to the dietary importance of the vegetables to humans. The root to the edible part translocation factor was calculated by the following formula [15]: Translocation Factor (TrF) = Metal conc. in shoot or fruit/ metal conc. in root Transfer Factor (TF) The Transfer Factor (TF) of heavy metals in the three nutritionally important crops namely bottle gourd, water spinach (kalmi) and red amaranth were calculated by the following formula [15]: Transfer Factor (TF) = Metal conc. in Plant/metal conc. in soil
Statistical Analysis
The results were statistically evaluated by using ANOVA (Analysis of Variance) and Duncan’s Multiple Range Test in IBM SPSS statistics version 20 as outlined by Gomez and Gomez [16]. The letter was used for testing the significance of differences between mean values. The 0.05 level of probability was chosen for the statistical judgment.
Results and Discussion
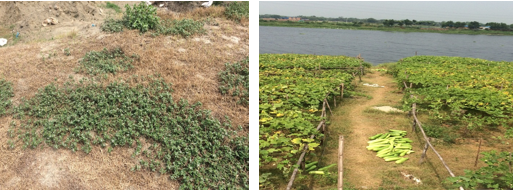
Severe chlorosis and necrosis symptoms were found during dry season sampling in grasses and agricultural crops grown (irrigated with the contaminated water from the Dhaleshwari River) at the vicinity of the Savar Tanneries (Figure 3).
Metal Concentrations in Vegetable Samples
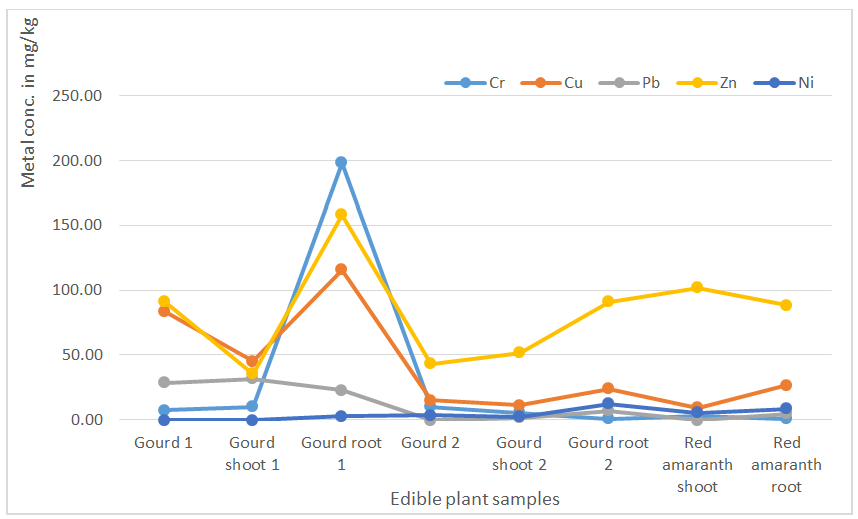
Metal concentrations (Cr, Cu, Cd, Pb, Ni, & Zn) in edible vegetable samples (i.e bottle gourd and red amaranth were collected in dry season and water kalmi, collected in wet season) at the vicinity of the savar study area, were crossed the MAC for plants [17] in most of the samples (Figures 4 & 5). The tests of significance of different sampling point were calculated by DMRT at 5% level. Agricultural crops become contaminated because of aerial deposition and/irrigation with tannery as well as other industrial waste water and effluents or huge amounts of contaminated tannery and city solid wastes are now continuously dumped into the fields. The study indicated that concentrations of Cr in the vegetable species were within the range of 7.5-9.75, 5.38-10.14, 25.5- 28.5 and 2.65 mg kg-1 of dry weight (DW), in bottle gourd fruit, bottle gourd shoot, kalmi shoot, and red amaranth, respectively, which was above the MPL (1-2 mg/kg) (Figures 4 & 5).
Significant differences were found among different sampling spots for the studied metals except Cd. Water kalmi samples collected in wet season from two sampling points exceeded the MAC value (Figure 4). The order of increasing concentration of studied metals in comparison with MPL [17] in (both seasons) edible crops is as follows: Chromium (Cr): Kalmi>Gourd 2> Gourd 1> Red amaranth shoot>MPL (1-2) Chromium (Cr): Gourd shoot 1>Gourd shoot 2>Red amaranth shoot>MPL (1-2) Copper (Cu): Gourd 1> Gourd 2> Red amaranth shoot>MPL (15-20) Copper (Cu): Gourd shoots 1>Gourd shoots 2>Kalmi>Red amaranth shoot>MPL (15-20) Lead (Pb): Gourd shoot 1 and Gourd 1>Kalmi>Gourd 2>Red amaranth shoot>MPL (10-20) Cadmium (Cd), Nickel (Ni) and Zinc (Zn): < MPL (Cd:5-10, Ni: 20-30 and Zn:150-200)
Water Kalmi Shoots Kalmi 1
Kalmi 2
39.01
Similar findings were reported by Mark, et al. [18] for the uptake of heavy metals by crops in Lake Chivers which is fed by the two rivers being considered there. The uptake of heavy metals by crops consists of two processes: a) absorption by roots and b) translocation to the stem and leaves and fruits. The relative concentration of heavy metals in the roots and the tops depends on the relative rates of the two processes. As long as the rate of absorption by the root is higher than the rate of translocation to the stem and leaves, the metal concentration will be higher in the root than the tops [18]. Chromium (Cr) and Pb concentration at the source points (both dry and wet season) crossed the MAC (Maximum allowable concentration) for most of the plant samples [17, 18, 19, 20]. The present study indicated that concentrations of Cr in the vegetable species were within the range of 2.65 (red amaranth) to 39.01(kalmi 2) mg kg-1 of dry weight (DW). The concentration range of Cr is much higher than those recorded by Nriagu and Nieboer [21] who found Cr concentration in vegetables grown in controlled area of Zhuzhou City, Hunan Province, China to be ranged from 0.4 to 2.7 mg kg-1 of DW. Nagajyoti, et al. [19] reported that Cr concentration were within the range of 0.89 to 1.08 mg kg-1 of DW in five leafy vegetables in India, whereas in Bangladesh a study reported by Romana [20] the mean Cr concentration ranged between 1.35 to 6.18 mg kg-1 of DW in five leafy vegetables which was almost six times higher than the MPL.
The reason for higher Cr conc. in the collected samples may be due to irrigation of agricultural fields around CETP with water contaminated with wastes from tannery industries. On a worldwide basis, the disposal of commercial products that contain chromium may be the largest contributor, accounting for 51% of the total chromium released to soil [21]. Other significant sources of chromium release into soil include the disposal of coal fly ash and bottom fly ash from electric utilities and other industries (33.1%), agricultural and food wastes (5.3%), animal wastes (3.9%), and atmospheric fallout (2.4%). Higher concentration of Cr in the surrounding areas of Dhaka was reported by many authors [10]. The main reason of the higher concentration of chromium in the surrounding areas of Dhaka is the tannery industries [10]. Vegetables grown in the soils with high Cr content is the probable reason for higher Cr concentration in vegetables [20]. Chromium concentration in the respective soils is presented in the Table 2.
Transfer (TF) and Translocation Factor (TrF)
Transfer Factor (TF) in Edible crops (bottle gourd1, bottle gourd 2, red amaranth and water kalmi 1 and kalmi 2: The transfer factor (TF) is also called as Bio concentration factor (BCF). This is an index demonstrating the potential of whole plant or its tissues to accumulate metal from soil. High TF value indicates suitability of the plant or its tissue for phyto-extraction [22]. Current study revealed that the TF values varied in the range of 0.06-8.62, 0.30-1.52 and 0.07- 1.57, respectively for bottle gourd1, bottle gourd 2 and red amaranth in dry season (Table 2). On the other hand 54.35- 7412, 000.0 and 0.125-0.032 TF values were found in kalmi 1 and kalmi 2 samples in wet season (Table 2). Most of the values were detected to be greater than 1 indicating that the plant part is hyper accumulating the metals (Table 2). TF value was detected to be the highest in roots for most metals except Cr for Gourd root 2 and Red amaranth root.
| Dry season | Conc. in vegetables (mg/kg) | Conc. in respective Soil (mg/kg) | ||||||||
|---|---|---|---|---|---|---|---|---|---|---|
| Sample | Cr | Cu | Pb | Zn | Ni | Cr | Cu | Pb | Zn | Ni |
| Gourd 1 | 7.50 e | 84.0 g | 28.5 f | 91.63 f | 0.0 a | 91.2 | 28.3 | 128 | 448 | 49.3 |
| Gourd shoot 1 | 10.14 g | 45.0 f | 31.32 g | 35.58 a | 0.0 a | 91.2 | 28.3 | 128 | 448 | 49.3 |
| Gourd root 1 | 198.37 h | 115.16 h | 22.71 e | 157.89 h | 2.77 c | 91.2 | 28.3 | 128 | 448 | 49.3 |
| Gourd 2 | 9.75 f | 15.19 c | 0.0 a | 42.89 b | 3.77 d | 52.5 | 37.6 | 30.3 | 122 | 36.6 |
| Gourd shoot 2 | 5.38 d | 11.58 b | 1.40 b | 51.39 c | 2.17 b | 52.5 | 37.6 | 30.3 | 122 | 36.6 |
| Gourd root 2 | 0.78 a | 23.9 d | 6.94 d | 91.13 e | 11.99 g | 52.5 | 37.6 | 30.3 | 122 | 36.6 |
| Red amaranth shoot | 2.65 c | 9.04 a | 0.0 a | 101.85 g | 5.47 e | 51.5 | 37.2 | 26.2 | 121 | 33.7 |
| Red amaranth root | 0.94 b | 26.9 e | 4.14 c | 88.28 d | 8.02 f | 51.5 | 37.2 | 26.2 | 121 | 33.7 |
| Cr | Cu | Pb | Zn | Ni | ||||||
| TrF for Bottle Gourd 1 fruit | 0.04 | 0.73 | 1.25 | 0.58 | 0 | |||||
| TrF for Bottle Gourd 1 Shoot | 0.05 | 0.39 | 1.38 | 0.23 | 0 | |||||
| TF for Bottle Gourd 1 | 2.37 | 8.62 | 0.64 | 0.64 | 0.06 | |||||
| TrF for Bottle Gourd 2 fruit | 12.5 | 0.64 | 0 | 0.47 | 0.31 |
Table 2: Transfer Factor (TF) and Translocation Factor (TrF) in bottle gourd 1, bottle gourd 2 and red amaranth in dry season.
| TrF for Bottle Gourd 2 Shoot | 6.9 | 0.48 | 0.2 | 0.56 | 0.18 | |||
|---|---|---|---|---|---|---|---|---|
| TF for Bottle Gourd 2 | 0.3 | 1.35 | 0.28 | 1.52 | 0.49 | |||
| TrF for Red amaranth | 0.34 | 0 | 1.15 | 0.68 | 1 | |||
| TF for Red amaranth | 0.07 | 0.97 | 0.16 | 1.57 | 0.4 | |||
| TrF = Conc. in target object/conc. in root | TF = Conc. in target object/conc. in Soil |
Table 3: Transfer Factor (TF) and Translocation Factor (TrF) in bottle gourd 1, bottle gourd 2 and red amaranth in dry season.
Mean values followed by the same letter (s) in a column do not differ significantly from each other at 5% level by DMRT.
Gourd shoot 2 and Gourd 1 showed intermediate TF values and the highest was in Red amaranth shoot. Both Gourd and Red amaranth shoot samples showed significant TF values and the highest was in Gourd 1 & 2, that are of highest dietary importance are absorbing relatively higher concentration of metals. The TF values for Cr and Cu were found to be higher in both bottle gourd 1 & 2 and water kalmi (Tables 2 & 3) indicating that the three plants showed higher affinity towards the respective metals. Overall TF values are thus found to be significant (Tables 2 & 3) and are a great threat to the consumers and will be responsible for cancer.
| Wet Season | Metal Concentration in Kalmi in mg/kg and in water mg/L | |||||||||||
|---|---|---|---|---|---|---|---|---|---|---|---|---|
| Cr (shoot) | Cr (root) | Cd (shoot) | Cd (root) | Cu (shoot) | Cu (root) | Pb (shoot) | Pb (root) | Zn (shoot) | Zn (root) | Ni (shoot) | Ni (root) | |
| Kalmi 1 | 28.5 | 239 | 0.125 | 0.26 | 45 | 22.5 | 0.001 | 20.25 | 22.18 | 74.12 | 9.17 | 55.38 |
| Kalmi 2 | 25.5 | 247 | 0.125 | 0.27 | 9.125 | 23.7 | 22.5 | 46.25 | 39.01 | 135.85 | 7.67 | 61.5 |
| Metal conc. At source For Kalmi 1 | 56.93 | 0.05 | 49.22 | 26.25 | 48.15 | 89.3 | ||||||
| Metal conc. At source For Kalmi 2 | 167.28 | 0.23 | 50.65 | 24.50 | 52.10 | 92.53 | ||||||
| TF (Kalmi 1) | 0.5 | 4.2 | 2.4 | 5 | 0.1 | 0.5 | 0 | 0.8 | 0.5 | 1.5 | 0.1 | 0.6 |
| TrF (Kalmi 1) | 0.12 | - | 0.48 | - | 0.20 | - | 0.00 | - | 0.30 | - | 0.17 | - |
| TF (Kalmi 2) | 0.2 | 1.5 | 0.5 | 1.2 | 0.2 | 0.5 | 0.9 | 1.9 | 0.7 | 2.6 | 0.1 | 0.7 |
| TrF (Kalmi 2) | 0.10 | - | 0.46 | - | 0.39 | - | 0.49 | - | 0.29 | - | 0.12 | - |
Table 4: Transfer Factor (TF) and Translocation Factor (TrF) in Water Kalmi in wet season. Mean values followed by the same lette
Average Daily Intake of Metals
Estimating heavy metal exposure level is indispensable in determining organism health risk. The degree of toxicity of heavy metal to human being depends upon their daily intake [23]. In the present study, the average daily intake of six metals were calculated on the basis of 166.1g edible vegetable part in a person’s daily diet according to Household Income and Expenditure Survey in Bangladesh by HIES [12] considering the mean concentration of each metal in edible vegetable parts, corresponding dry weight of vegetables and average body weight of 60 kg of a person. The average daily intake (ADI) of Cr, Cd, Cu, Pb, Ni and Zn is shown in Table 4, represented significant variation.
Average Daily Intake (ADI) for Chromium
The ADI of Cr in bottle gourd/fruit vegetables and red amaranth shoot ranged from 0.04 to 0.08 mg/person/day which showed that Cr was consumed below the Permitted Maximum Tolerable Daily Intake (PMTDI) endorsed by Recommended Dietary Allowances [24] of 0.2 mg/person/ day, though the ADI for edible bottle gourd shoot ranged from 0.12-0.20 mg/person/day. The ADI of Cr in kalmi (0.42-0.47 mg/person/day) exceeded the Permitted Maximum Tolerable Daily Intake (PMTDI) endorsed by Recommended Dietary Allowances [24] of 0.2 mg/person/ day. The decreasing order of average daily intake of Cr was Kalmil>Gourd shoot 1>Gourd shoot 2>Red amaranth>Gourd 2>Gourd 1 in this study (Table 4). Average daily intake of Cr was also significantly lower in fruit than the PMTDI in the shoots of the vegetables collected in dry and wet season. The mean values of ADI for leafy vegetables collected from Kawran bazar, Dhaka, ranged from 0.016 to 0.152 mg/ person/day, but ADI of Cr found above the PMTDI of 0.2 mg/ person/day suggested by RDA [24] for Mint collected during 3rd sampling phase reported by Romana [20].
The mean estimated daily intake of Cr via dietary consumption of 276.2 g of vegetables grown around battery production area in China was 0.011mg/person/day, levels that were much lower than the PMTDI [25]. The presence of chromium in the diet is of great importance due to its active involvement in lipid metabolism and insulin function [26]. But chronic exposure to Cr may result in liver, kidney and lung damage [27].
| Name of vegetables | % Moisture | % DW | Av. Consumption [12] | Average Daily Intake (ADI) (mg/person/day) | |||||
|---|---|---|---|---|---|---|---|---|---|
| Cr | Cd | Cu | Pb | Ni | Zn | ||||
| B. Gouard Fruit 1 | 96 | 0.04 | 166.1 | 0.05 a | 0.003 c | 0.56 e | 0.19 e | 0.00 a | 0.61 b |
| B. Gouard 1 (Shoot) | 88 | 0.12 | 166.1 | 0.20 d | 0.00002 a | 0.90 f | 0.62 e | 0.00 b | 0.71 d |
| B. gourd Fruit 2 | 95 | 0.05 | 166.1 | 0.08 b | 0.000008 a | 0.13 bc | 0.00 a | 0.03 b | 0.36 a |
| B. Gouard 2 (Shoot) | 87 | 0.13 | 166.1 | 0.12 c | 0.00065 ab | 0.25 d | 0.03 b | 0.05 c | 1.11 e |
| Red Amaranth (shoot) | 92 | 0.08 | 166.1 | 0.04 a | 0.014 d | 0.12 b | 0.00 a | 0.07 d | 1.35 f |
| Water Kalmi 1 | 90 | 0.10 | 166.1 | 0.47 f | 0.002 bc | 0.07 a | 0.00002 a | 0.15 f | 0.37 a |
| Water Kalmi 2 | 90 | 0.10 | 166.1 | 0.42 e | 0.002 bc | 0.15 c | 0.37 d | 0.13 e | 0.65 c |
| PMTDI | 0.2 | 0.046 | 2 | 0.21 | 0.3 | 20 | |||
| Source | [24] | [13] | [14] | [13] | [14] | [14] |
Table 5: Average Daily Intake (ADI) (mg/person/day) of Metals. Mean values followed by the same letter (s) in a column do not dif
The ADI of Cu, Ni, Zn and Pb in collected vegetables ranged from 0.07 to 0.90, 0.00 to 0.15, 0.37 to 1.35 and 0 to 0.62 mg/person/day. The study indicated that the mean ADI values of Pb were above the Permitted Maximum Tolerable Daily Intake endorsed by JECFA [13] (0.21 mg/person/day) in gourd 1 shoot (dry season) and kalmi 2 (wet season), which showed significant variation with other vegetable samples (Table 4). Sultana, et al. [28] also found that ADI of Pb varied between 0.0006 to 0.01 mg/person/day for consumption of 211 g/person/day vegetables collected from the agricultural fields of two locations around the sub-urban Gazipur industrial area of Dhaka, Bangladesh. The ADI of Pb from eating Amaranth grown at Tabata of Dar es Salaam, Tanzania was 0.112 mg/person/day for consumption of 108 g of vegetables [29]. But Kacholi and Sahu [9] reported that Pb was consumed above the PMTDI via the dietary intake of 325 g vegetables collected from Temeke municipality area of Dar es Salaam, Tanzania.
Dietary intake of lead above PMTDI can cause accumulation of in the body organs (i.e., brain), which may lead to poisoning (plumbism) or even death. The gastrointestinal tract, kidneys, and central nervous system are also affected by the presence of lead. Children exposed to lead are at risk for impaired development, lower IQ, shortened attention span, hyperactivity and mental deterioration, with children under the age of six being at a more substantial risk. Adults usually experience decreased reaction time, loss of memory, nausea, insomnia, anorexia, and weakness of the joints when exposed to lead [30].
Hazad Quotient (HQ) and Hazard Index (HI) of Edible Vegetables as an Indicator of Carcenogenecity
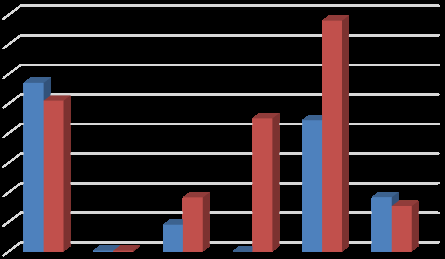
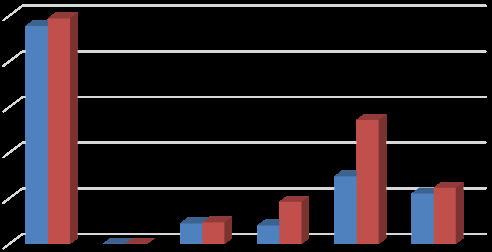
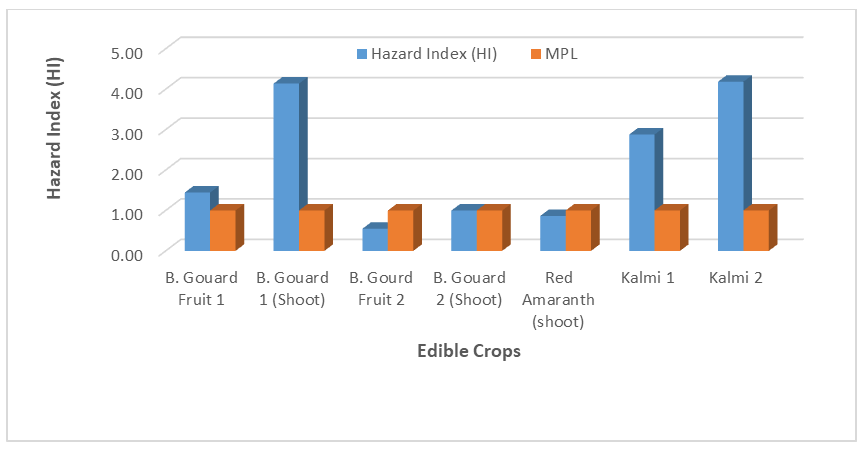
The Hazard Quotient (HQ) has been recognized as a useful parameter for evaluation of risk associated with consumption of metal contaminated food crops [20] and Hazard index (HI) is estimated as the sum of hazard quotients when more than one heavy metal is involved. In the present study, though almost all the HQ values were below 1 except for Cr in bottle gourd 1 (shoot) and water kalmi 1 & 2, Pb in kalmi 2, the hazard index (HI) for consumption of all vegetables were found to be greater than 1 except bottle gourd 2 (fruit) and red amaranth, which indicated that there might be a potential health risk to those consuming these vegetables (Table 5, Figure 5).
| Name of vegetables | Hazard Quotient (HQ) | Hazard Index (HI) | |||||
|---|---|---|---|---|---|---|---|
| Cr | Cd | Cu | Pb | Ni | Zn | MPL for HI= 1 | |
| B. Gouard 1 (Fruit) | 0.28 | 0.11 | 0.23 | 0.79 | 0 | 0.03 | 1.44 |
| B. Gouard 1 (Shoot) | 1.12 | 0 | 0.37 | 2.6 | 0 | 0.04 | 4.14 |
| B. Gourd 2 (Fruit) | 0.45 | 0 | 0.05 | 0 | 0.03 | 0.02 | 0.55 |
| B. Gouard 2 (Shoot) | 0.65 | 0.02 | 0.1 | 0.13 | 0.04 | 0.06 | 1 |
| Red Amaranth (shoot) | 0.2 | 0.48 | 0.05 | 0 | 0.06 | 0.08 | 0.86 |
| Water Kalmi 1 | 2.63 | 0.07 | 0.03 | 0 | 0.13 | 0.02 | 2.88 |
| Water Kalmi 2 | 2.35 | 0.07 | 0.06 | 1.56 | 0.11 | 0.04 | 4.18 |
| Oral Reference dose (RD) [14] f | Body weight | ||||||
| Cr | Cd | Cu | Pb | Ni | Zn | ||
| 0.003 | 0.0005 | 0.04 | 0.004 | 0.02 | 0.3 | 60 | |
| 0.003 | 0.0005 | 0.04 | 0.004 | 0.02 | 0.3 | 60 | |
| 0.003 | 0.0005 | 0.04 | 0.004 | 0.02 | 0.3 | 60 | |
| 0.003 | 0.0005 | 0.04 | 0.004 | 0.02 | 0.3 | 60 | |
| 0.003 | 0.0005 | 0.04 | 0.004 | 0.02 | 0.3 | 60 | |
| 0.003 | 0.0005 | 0.04 | 0.004 | 0.02 | 0.3 | 60 | |
| 0.003 | 0.0005 | 0.04 | 0.004 | 0.02 | 0.3 | 60 |
Table 6: Hazad Quotient and Hazard Index (HI) of vegetables.
The results in Table 5 showed that the highest and the lowest values of Hazard Index (HI) were 4.18 and 0.55 for consumption of all vegetables. The HI values were found in the decreasing order of: water Kalmi 2> Bottle gourd 1(shoot)> water Kalmi 1> Bottle gourd 1> Bottle gourd 2(shoot)> Red amaranth shoot > Bottle gourd 2 (Table 5). When the HI surpasses unity, this implies that consumption of vegetables can cause health effects. For this study, the consumption of the fruit and leafy vegetables poses serious health risks as the HI values for all the vegetables were above 1 except red amaranth and bottle gourd 2 as these sites were 0.5 km downstream from the source point. Romana [20] showed that all the studied stem vegetables except Potato pose potential health risks as their HI values exceeded the unity according to Bermudez, et al. [10]. The highest and lowest value was found to be 4.63 and 0.95 for consumption of Ginger and Potato and the HI value decreased in order of Ginger>Garlic>Onion>Potato [20].
Islam and Hoque [31] reported that HQ for Cr was 1.33, for Cu was 1.18 and for Ni was 1.11 via intake of Pumpkin, Brinjal and Bottle gourd, respectively, which was collected around the industrial area of Dhaka, Bangladesh. Chauhan and Chauhan [32] also reported that HQ was more than 1 for Pb in Spnach (1.12), in Cabbage (1.02) and in Radish (1.01) for consumption of vegetables grown in waste water irrigated area of Rewa, India and Romana [20] reported that HQ was more than 1 for Pb in Spinach (1.104) collected from Kawranbazar, Dhaka, Bangladesh.
The present study also revealed that Hazard Index (HI) exceeded unity mostly in stem and leafy vegetables. HI also found to be above 1 for consumption of different vegetables in many recent research works. Kacholi and Sahu [9] also reported that HI values for intake of Potato leves and African spinach were 7.99 and 2.88, respectively, which were collected from Temeke municipality area of Dar es Salaam, Tanzania. Patrick-Iwuanyanwu and Chioma [33] stated that the highest HI value was recorded 8.871 in African basil collected from Swali market in Bayelsa State, Nigeria. Romana [20] reported that HI was more than 1 for in Mustard (1.663), Spinach (2.113), Coriander (1.925) and Mint (2.834) collected from Kawran bazar, Bangladesh. The highest HI value was 2.83 and the lowest value was 0.38 for consumption of Mint and Cabbage respectively [20]. The HI values were found in decreasing order of Mint>Spinach>Cor iander>Mustard>Cabbage was also reported Romana S [20].
Conclusion
The findings of this study revealed that mean concentration of the studied heavy metals (Cr, Cd, Pb, Ni, Cu, Zn) exceeded the Maximum Permissible Limit in most vegetables. Most of the heavy metals discussed have toxic potential but the detrimental impact become apparent only after decades of exposure. It is therefore, suggested that monitoring and assessment of heavy metal concentrations in different vegetables from the production sites require more extensive studies for assessing the risk of health hazards to the human beings and to prevent excessive buildup of these heavy metals in the human food chain. Environmentalists, administrators and public health workers should come forward to create public awareness to avoid the consumption of vegetables grown in contaminated soils, hence reducing health risks. Finally, extensive research is needed to assess presence of heavy metals in foodstuff in order to avoid extreme accrual (rate of increase) in the food chain and thus elude human health risks.
Acknowledgement
The author owes a debt of indebtedness and gratefulness to the University Grant’s Commission (UGC), Dhaka, Bangladesh for providing her fellowship grant as well as partial financial support for the field studies of the Post- Doctoral study. The author also immensely expressed her gratitude to the Chairman, Department of Soil, Water and Environment, University of Dhaka, Bangladesh for giving laboratory and analytical facilities to conduct the research.
References
-
Rahman SH, Dilara K, Tanveer MA, Shahidul MS, Mohammad AA, et al. (2012) Assessment of heavy metal contamination of Agricultural soil around Dhaka Export Processing Zone (DEPZ), Bangladesh: Implication of seasonal variation and indices. Appl Sci 2(3): 584-601.
-
Tribune D (2018) Tanneries relocation, non-compliance at Savar Leather Park weigh on export earnings. Dhaka Tribune.
-
Luo XS, Yu S, Zhu YG, Li XD (2012) Trace metal contamination in urban soils of China. Sci Total Environ 441-442: 17-30.
-
Sharma RK, Agrawal M, Marshall FM (2008) Heavy metal (Cu, Zn, Cd and Pb) contamination of vegetables in urban India: A case study in Varanasi. Environ Pollut 154(2): 254-263.
-
Vallini G, Pera A, Cecchi F, Brigla M, Perghem F (1989) Compost Detoxification of Vegetable-Tannery Sludge. Waste management and research: The Journal for a Sustainable Circular Economy 7(1): 277-290.
-
Duval RL, Ferris CR, Owen RB, Gibs KE, Finkjr LK, et al. (1980) Effects of a cattleskin tannery on stream quality and benthic macroinvertebrates in central maine. Bull Envoron Contam Toxicol 25: 269-276.
-
Chamon AS, Gerzabek MH, Mondol MN, Ullah SM, Rahman M, et al. (2005) Influence of cereal varieties and site conditions on heavy metal accumulations in cereal crops on polluted soils of Bangladesh. Comm Soil Sci and Plant Analysis 36(7-8): 889-906.
-
Martin S, Griswold W (2009) Human health effects of heavy metals. Environmental Science and Technology Briefs for citizens 15: 1-6.
-
Kacholi DS, Sahu M (2018) Levels and health risk assessment of heavy metals in soil, water and vegetables of Dar es Salam, Tanzania_._ J Chem pp: 1-9.
-
Bermudez GMA, Jasan R, Pl´a R, Pignata ML (2011) Heavy metal and trace element concentrations in wheat grains: Assessment of potential non-carcinogenic health hazard through their consumption. J Hazard Mater 193: 264-271.
-
Blum WEH, Spiegel H, Wenzel WW (1996) Soil condition inventory. Conception, implementation and evaluation, recommendations for standardizing the procedure in Austria. Federal Ministry of Agriculture and Forestry, Vienna.
-
HIES Household Income and Expenditure Survey (2011) Bangladesh Bureau of Statistics, Statistics Division, Ministry of Planning, Dhaka, Bangladesh, pp: 1-40.
-
JECFA (Joint FAO/WHO Expert Committee on Food Additives) (1993) Evaluation of certain food additives and contaminants: 41st report of JECFA. _Technical Reports_ _Series_ no. 837.World Health Organization, Geneva, Switzerland, pp: 10-15.
-
WHO/FAO (2013) Guidelines for the safe use of wastewater and food stuff. Wastewater use in agriculture. World Health Organization and Food and Agriculture Organization (FAO), Geneva, Switzerland 2(1): 988.
-
Rangnekar SS, Sahu SK, Pandit GG, Gaikwad VB (2013) Study of Uptake of Pb and Cd by Three Nutritionally Important Indian Vegetables Grown in Artificially Contaminated Soils of Mumbai, India. International Research Journal of Environment Sciences 2(9): 53-59.
-
Gomez KA, Gomez AA (1984) Statistical procedures for agricultural research. 2nd(Edn.). John wiley and sons, New York, pp: 680.
-
Sauerbeck D (1982) The heavy metal levels in plants must not be exceeded. To avoid growth impairments? Agriculture. Research special issue 39th conference proceedings, pp: 108-129.
-
Mark FZ, Timothy N (1995) Uptake of Ni, Zn, Fe, Co, Cr, Pd, Cu and Cd by water hyachinth in mukuvisi and many AME rivers. J Environ Sci Health A 30(1): 157-169.
-
Nagajyoti PC, Dinakar N, Prasad TNVKV, Suresh C, Damodharam T (2008) Heavy metal toxicity: Industrial effluent effect on groundnut (Arachis hypogaea L.) seedlings. J Appl Sci Res 4(1): 110-121.
-
Romana S, Chamon AS, Mondal MN, Tasnim I (2021) Metal concentration in commonly sold vegetables in Dhaka city market and probable health risk. MS Dhaka Univ J Biol Sci 30(1): 35-47.
-
Nriagu JO, Nieboer E (1988) Chromium in the Natural and Human Environments. Environmental Chemistry, pp: 571.
-
Blaylock MJ, Salt DE, Dushenkov S, Zakharova O, Gussman C, et al. (1997) Enhanced accumulation of Pb in Indian Mustard by soil-applied chelating agents. J Env Sci Tech 31(3): 860-865.
-
Singh A, Sharma RK, Agrawal M, Marshall FM (2010) Risk assessment of heavy metal toxicity through contaminated vegetables from wastewater irrigated area of Varanasi, India. Trop Ecol 51(2S): 375-387.
-
RDA (Recommended Dietary Allowances) (1989) National Research Council (US) Subcommittee on the Tenth Edition of the Recommended Dietary Allowances. 10th (Edn.), Washington (DC): National Academies Press, US, pp: 1-190.
-
Chen Y, Wu P, Shao Y, Ying Y (2013) Health risk assessment of heavy metals in vegetables grown around battery production area. Sci Agric 71(2): 126-132.
-
Ahmed MK, Shaheen N, Islam MS, Habibullah-al-Mamun, Islam S, et al. (2015) Dietary intake of trace elements from highly consumed cultured fish (_Labeo rohita, Pagasius_ _pangasius_ and _Oreochromis mossambicus_) and human health risk implications in Bangladesh. Chemosphere 128: 284-292.
-
Zayed AM, Terry N (2003) Chromium in the Environment: Factors Affecting Biological Remediation. Plant & Soil 249: 139-156**_._**
-
Sultana MS, Rana LS, Yamazaki ST, Yoshida SA (2017) Health risk assessment for carcinogenic and noncarcinogenic heavy metal exposures from vegetables and fruits of Bangladesh. Cogent Environ Sci 3(1): 1291107.
-
Othman OC (2001) Heavy metals in green vegetables and soils from vegetable gardens in Dar es Salaam, Tanzania. Tanz J Sci 29(1): 37-48.
-
NSC (2009) Lead Poisoning. National Safety Council.
-
Islam MS, Hoque MF (2014) Concentration of heavy metals in vegetables around the industrial area of Dhaka city, Bangladesh and health risk assessment. Int Food Res J 21(6): 2121-2126.
-
Chauhan G, Chauhan UK (2014) Human health risk assessment of heavy metals via dietary intake of vegetables grown in wastewater irrigated area of Rewa India. Int J Sci Res 4(9): 1-9.
-
Patrick-Iwuanyanwu K, Chioma NC (2017) Evaluation of heavy metals content and human health risk assessment via consumption of vegetables from selected markets in Bayelsa State, Nigeria. Biochem Anal Biochem 6(3): 332.
- Antifungal Activity of New Acetophenone Derivatives
- Interconnected Microbiomes Human Health Within an Environmental Framework
- Silkworm-Based Vaccine Production for H5N1: A One Health Approach to Pandemic Preparedness
- Microbial Diversity and Lipolytic Activity of Bacteria and Fungi from Oil-Contaminated Sites in Makurdi Metroplois
- Antibiotic Resistance Profile of Bacteria Isolated at the Central Laboratory of the National Hospital Center of Nouakchott
- Epidemiology and Sensitivity to Antibiotics of Germs Isolated from Blood Cultures in the Laboratory of the National Hospital Center of Nouakchott-Mauritania