Impact of Consciousness Energy Healing Treatment on the Isotopic Abundance Ratio of Cefazolin Sodium Using LC-MS and GC-MS Spectrometry
Cefazolin sodium is a broad-spectrum antibiotic useful for the treatment of many Gram-positive and some Gram-negative bacterial infections. This study was designed to investigate the impact of The Trivedi Effect®-Biofield Energy Healing Treatment on the structural properties and the isotopic abundance ratio of cefazolin sodium using LC-MS and GC-MS spectroscopy. Cefazolin sodium sample was divided into two parts, one part of cefazolin sodium was considered as control (no Biofield Energy Treatment was provided), while the second part was treated with The Trivedi Effect®-Consciousness Energy Healing Treatment remotely by a renowned Biofield Energy Healer, Alice Branton and termed as a treated sample. The LC-MS spectra of both the samples of cefazolin sodium at the retention time (Rt) 4.6 minutes exhibited the mass of the protonated molecular ion peak at m/z 455 [M+H]+ (calculated for C14H15N8O4S3 +, 455.05). The LC-MS based isotopic abundance ratio of PM+1/PM (2H/1H or 13C/12C or 15N/14N or 17O/16O or 33S/32S) in the treated cefazolin was significantly increased by 18.90% compared with the control sample. Thus, 13C, 2H, 15N, 17O and 33S contributions from (C14H15N8O4S3)+ to m/z 456 in the treated sample were significantly increased compared with the control sample. In the GC-MS the retention times of the treated sample (15.25 minute) was found to be very close to the control sample (15.24 minutes). The mass peak intensities of the control sample at m/z 56, 132, 219, and 264 were significantly decreased by 33.51%, 44.74%, 66.26%, and 73.77%, respectively compared to the Biofield Energy Treated sample (Table 2). Hence, 13C, 2H, 15N, 17O, and 33S contributions from (C14H15N8O4S3)+ to m/z 456 in the treated sample were significantly increased compared with the control sample. The isotopic abundance ratio of PM+1/PM (2H/1H or 13C/12C or 15N/14N or 17O/16O or 33S/32S) and peak intensities in the treated cefazolin sodium was significantly altered compared to the control sample. The new form of treated cefazolin sodium would be better designing novel pharmaceutical formulations that might offer better therapeutic response against cellulitis, respiratory tract infections, urinary tract infections (UTI), genital infections, joint infection, biliary tract infections, pneumonia, endocarditis, blood infections (sepsis), and also prevent group B streptococcal disease at the time of delivery and before surgery, etc.
Introduction
Cefazolin is a broad-spectrum antibiotic. It is useful for the treatment of a number of both Gram-positive (i.e., Staphylococcus aureus, Staphylococcus epidermidis, Streptococcus pyogenes, Streptococcus pneumonia, Streptococcus agalactiae, and other strains of streptococci) and Gram-negative (i.e., Escherichia coli, Proteus mirabilis, etc.) bacterial infections [1, 2]. Cefazolin act as a bactericidal (kills the bacteria) by inhibiting the bacterial cell wall biosynthesis by binding penicillin binding proteins (bacterial proteins) and stops peptidoglycan synthesis, which is needed to maintain the cell wall [3]. It is used for the treatment of urinary tract infections (UTI), cellulitis, pneumonia, endocarditis, blood infections (sepsis), respiratory tract infections, joint infection, genital infections, biliary tract infections, and also prevent group B streptococcal disease around the time of delivery and before surgery, etc [1, 2, 3]. General safety needs to follow while using cefazolin during pregnancy and breastfeeding as a small amount of cefazolin enters the breast milk [2, 4]. Very common side effects associated with the cefazolin are diarrhoea, stomach pain or stomach upset, vomiting, rash, blood dyscrasias, allergic skin reaction, etc [2, 3]. Chemical structure of cefazolin contains an N-methylthiodiazole (NMTD) side-chain releases free NMTD in the body, which can cause hypoprothrombinemia [5]. Cefazolin sodium is the sodium salt of cefazolin available in various dosage form, i.e., injectable, eye drop, powder for injection, etc [6]. Physicochemical properties aspects, it is white or near white crystalline powder, freely soluble in water, slightly soluble in ethanol and methanol, and practically insoluble in acetone, chloroform, dichloromethane, ethyl acetate, and isopropanol [7].
Since the physicochemical properties of a pharmaceutical compound play a crucial role in its dissolution, absorption, and bioavailability profile in the body [8]. Therefore, many research activities are carrying out throughout the world by the researchers for improving the physicochemical properties of the pharmaceuticals or nutraceuticals compounds. In this scenario, it was observed that The Trivedi Effect®-Biofield Energy Healing Treatment has the significant impact on various properties such as particle size, surface area, and isotopic abundance ratios of pharmaceutical and nutraceutical compounds [9, 10, 11]. The Trivedi Effect® is a natural and only scientifically proven phenomenon in which a person can harness this inherently intelligent energy and transmit it anywhere on the planet through the possible mediation of neutrinos [12]. “Biofield Energy” the electromagnetic energy field which exists surrounding the living beings, which can transmit the electromagnetic energy in the form of bio-photons, generated by the continuous movement of the electrically charged particles (ions, cells, etc.) inside the body.
Biofield Energy Healing specialists have the ability to harness the energy from the environment or the “Universal Energy Field” and can transmit into any living and non-living object(s), this process is called Biofield Energy Healing Treatment [13, 14, 15]. Biofield based Energy Therapies have been reported to with significant outcomes against various disease [16]. National Center of Complementary and Integrative Health (NCCIH) has recognized and accepted Biofield Energy Healing as a Complementary and Alternative Medicine (CAM) health care approach in addition to other therapies, medicines, and practices such as yoga, Qi Gong, Tai Chi, hypnotherapy, Reiki, etc. [17, 18]. These therapies have been accepted by most of the U.S.A. population with several advantages [18]. Similarly, The Trivedi Effect®-Biofield Energy Healing Treatment had been proved with outstanding scientific data in the fields of materials science, agricultural science, microbiology, cancer research, pharmaceuticals and nutraceuticals, etc [10, 19, 20, 21, 22, 23, 24, 25, 26, 27]. The Trivedi Effect®-Biofield Energy Healing Treatment could be an economical approach for the practical challenges faced by cefazolin sodium with respect to the physicochemical properties for designing better pharmaceuticals formulations. The stable isotope ratio analysis has various applications in different scientific fields for understanding the isotope effects resulting from the variation of the isotopic composition of the molecule [28, 29]. Isotope ratio analysis can be performed by using the conventional mass spectrometry (MS) techniques such as gas chromatography - mass spectrometry (GC-MS) and liquid chromatography - mass spectrometry (LC-MS) in low micromolar concentration with sufficient precision [28, 30]. Therefore, LC-MS and GC-MS were used in this study to characterize the structural properties and evaluate the isotopic abundance ratio analysis of PM+1/PM (2H/1H or 13C/12C or 17O/16O or 15N/14N or 33S/32S) in The Trivedi Effect® - Consciousness Energy Healing Treated cefazolin sodium compared to the control sample.
Materials and Methods
Chemicals and Reagents
Cefazolin sodium was purchased from Tokyo Chemical Industry Co., Ltd., Japan. Other chemicals used during the experiments were of analytical grade available in India.
Consciousness Energy Healing Treatment Strategies
The test sample cefazolin sodium powder was divided into two parts. One part of cefazolin sodium powder sample was considered as a control sample (no Biofield
Energy Treatment was provided). However, the other part of cefazolin sodium was treated with The Trivedi Effect®- Consciousness Energy Healing Treatment remotely under standard laboratory conditions for 3 minutes and known as The Trivedi Effect® Treated or Biofield Energy Treated cefazolin sodium sample. The Biofield Energy Treatment was provided through the healer’s unique energy transmission process by the renowned Biofield Energy Healer, Alice Branton, USA, to the test sample. Further, the control sample was treated with “sham” healer for comparison purpose. The sham healer did not have any knowledge about the Biofield Energy Treatment. After that, the Biofield Energy Treated and untreated cefazolin sodium samples were kept in sealed conditions and characterized using LC-MS and GC-MS, analytical techniques.
Characterization
Liquid chromatography-mass spectrometry (LC-MS) analysis and Calculation of Isotopic Abundance Ratio The LC-MS analysis of the control and Biofield Energy Treated cefazolin sodium was carried out with the help of LC- MS/MS Thermo Fisher Scientific, the USA equipped with an ion trap detector connected with a triple-stage quadrupole mass spectrometer. The column used here was a reversed phase Thermo Scientific Synchronis C18 (Length-250 mm X ID 4.6 mm X 5 micron), maintained at 25˚C. 5 µL of cefazolin sodium solution in acetonitrile was injected, and the analyte was eluted using 0.1% formic acid in water (mobile phase A; 15%), and acetonitrile (mobile phase B; 85%) pumped at a constant flow rate of 0.6 mL/min. Chromatographic separation was achieved using gradient condition and the total run time was 10 min. Peaks were monitored at 254 nm using the PDA detector. The mass spectrometric analysis was performed under +ve ESI mode. The total ion chromatogram, peak area% and mass spectrum of the individual peak which was appeared in LC along with the full scan (m/z 50- 500) were recorded. The total ion chromatogram and mass spectrum of the individual peak (appeared in LC-MS) were recorded.
The natural abundance of each isotope (C, O, H, N, and S) can be predicted from the comparison of the height of the isotope peak with respect to the base peak. The values of the natural isotopic abundance of the common elements are obtained from the literature [29, 31, 32, 33]. The LC-MS based isotopic abundance ratios (PM+1/PM ) for the control and Biofield Energy Treated cefazolin sodium was calculated.
Percentage (%) change in isotopic abundance ratio = [(IARTreated – IARControl)/ IARControl) x 100]
Where IARTreated = isotopic abundance ratio in the treated sample and IARControl = isotopic abundance ratio in the control sample.
Gas Chromatography-Mass Spectrometry (GC-MS) Analysis GC-MS of the control and Biofield Energy Treated sample of cefazolin sodium were analyzed with the help of Perkin Elmer Gas chromatograph equipped with a PE-5MS (30M x 250 micros x 0.250 microns) capillary column and coupled to a single quadrupole mass detector was operated with electron impact (EI) ionization in positive mode. Oven temperature was programmed from 75°C (5 min hold) to 280°C (14 min hold) @ 10°C /min (total run time 40 min). The sample was prepared taking 20 mg of the cefazolin sodium is in 4.0 ml Acetone: Water (1:1) as a diluent. Mass spectra were scanned from m/z 20 to 400. The identification of analyte was done by GC retention times and by a comparison of the mass spectra of samples.
The mass peak intensities of the Biofield Energy Treated cefazolin sodium was calculated compared to the control sample.
Percentage (%) change in mass peak intensity = [(ITreated – IControl)/ IControl) x 100]
Where ITreated = mass peak intensity of the treated sample and IARControl = mass peak intensity of the control sample.
Results and Discussion
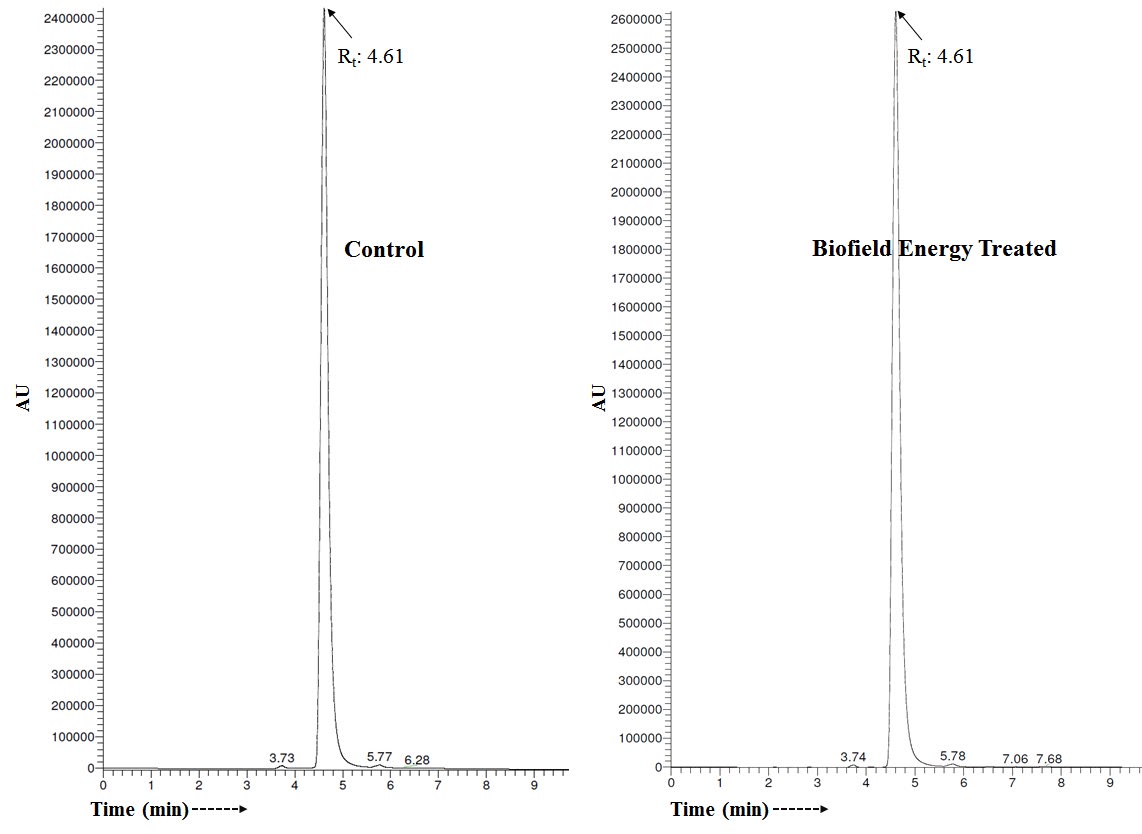
Liquid Chromatography-Mass Spectrometry (LC-MS) The LC chromatograms and mass spectra of both the samples of cefazolin sodium are shown in the Figures 1 and 2, respectively. The LC chromatograms of cefazolin sodium showed the single major chromatographic peak at the retention time (Rt) of 4.6 minutes in both the case (Figure 1). These results indicated that the polarity of both the control and Biofield Energy Treated cefazolin sodium remained same.
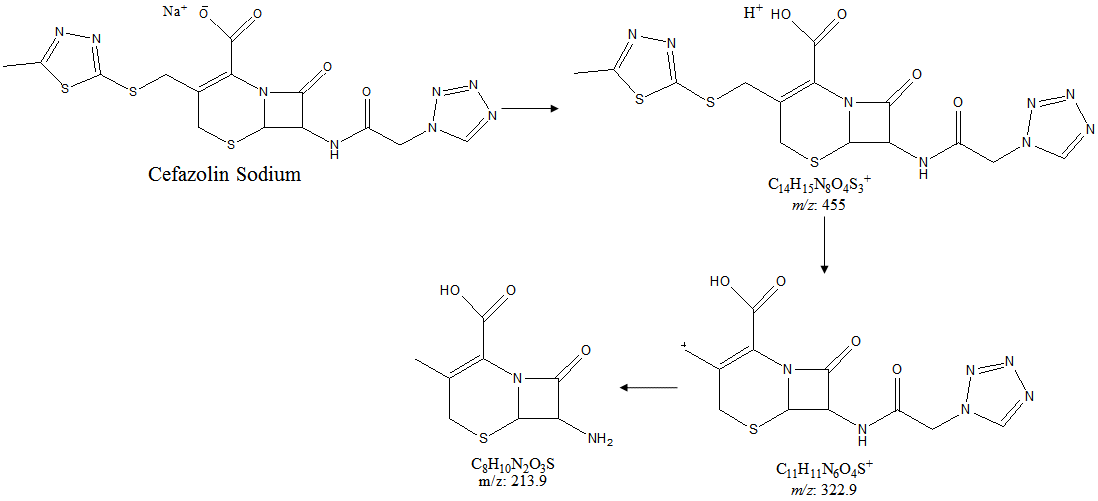
As per the literature, cefazolin was detected with the molecular mass peak [M+H]+ at m/z 455 LC-MS spectrum in positive ion mode [34]. The LC-MS spectra of both the samples of cefazolin (Figure 2) at the retention time 4.6 minutes exhibited the mass of the protonated molecular ion peak at m/z 455 [M+H]+ (calculated for C14H15N8O4S3 +, 455.05) in the control sample and Biofield Energy Treated sample, along with the fragment ion peaks near m/z 322.9 and 213.9 which were corresponded to the molecular formula C11H11N6O4S+ and C8H10N2O3S+, respectively in both the samples (Figure 3).
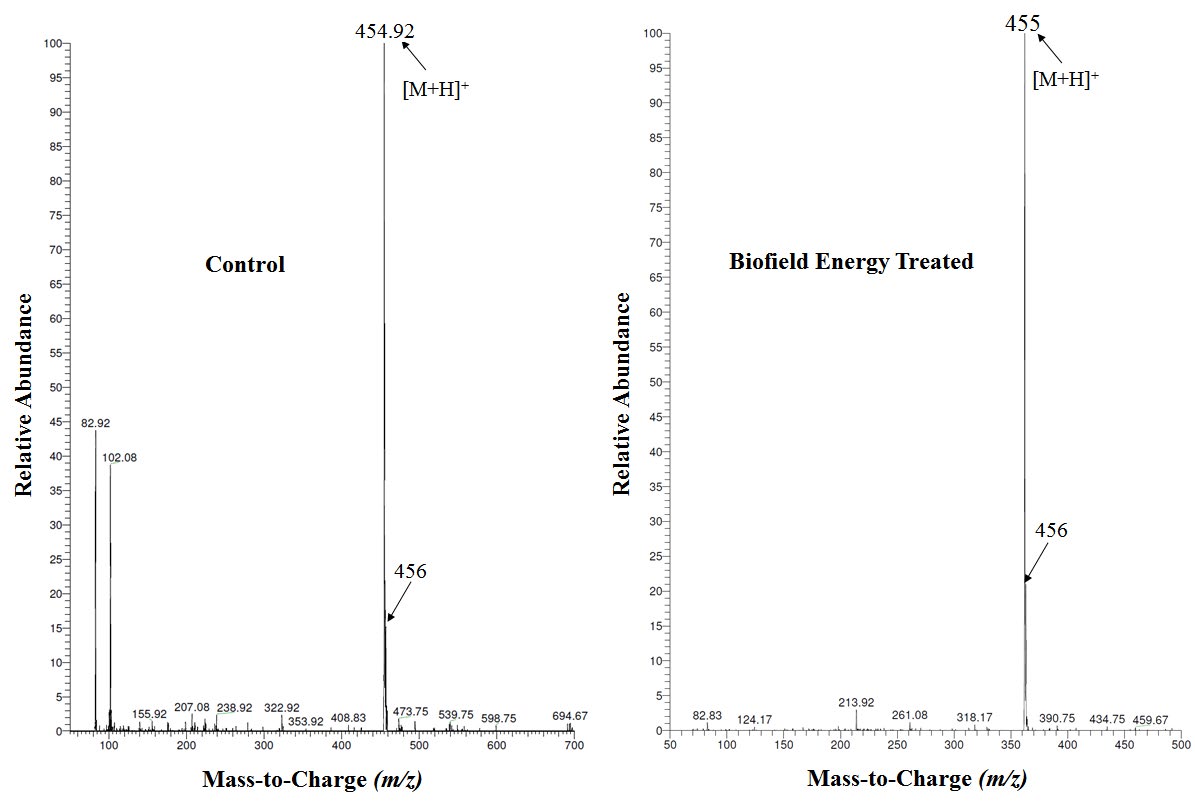
The LC-ESI-MS spectra of both the control and Biofield Energy Treated cefazolin showed the mass of the molecular ion peak [M+H]+ at m/z 455 (calculated for C14H15N8O4S3 +, 455.05) with relative intensity of 100%. The theoretical calculation of PM+1 for cefazolin was presented as below: P (13C) = [(14 x 1.1%) x 100% (the actual size of the M+ peak)] / 100% = 15.4% P (2H) = [(15 x 0.015%) x 100%] / 100%= 0.225% P (15N) = [(8 x 0.4%) x 100%] / 100% = 3.2% P (17O) = [(4 x 0.04%) x 100%] / 100% = 0.16% P (33S) = [(4 x 0.08%) x 100%] / 100% = 0.32% PM+1, i.e. 13C, 2H, 15N, 17O, and 33S contributions from (C14H15N8O4S3)+ to m/z 456 = 19.31% The calculated isotope abundance (19.31%) was close to the experimental value 21.9% (Table 1). From the above calculation, it has been found that 13C and 15N have major contribution to m/z 456.
The LC-MS based isotopic abundance ratio analysis of cefazolin sodium in control and Biofield Energy Treated samples were calculated for its molecular mass at m/z 455. PM and PM+1 for cefazolin sodium near m/z 455 and 456, respectively of the control and Biofield Energy Treated samples, which were obtained from the observed relative peak intensities of [M+] and [(M+1)+] peaks, respectively in the ESI-MS spectra and are presented in Table 1. The percentage change of the isotopic abundance ratio (PM+1/PM) in the Biofield Energy Treated cefazolin sodium compared with the control sample are shown in Table 1. The isotopic abundance ratio of PM+1/PM in the Biofield Energy Treated cefazolin sodium was significantly increased by 18.90% compared with the control sample (Table 1). Hence, 13C, 2H, 15N, 17O, and 33S contributions from (C14H15N8O4S3)+ to m/z 456 in the Biofield Energy Treated sample were significantly increased compared with the control sample.
| Parameter | Control sample | Biofield Energy Treated sample |
|---|---|---|
| P at m/z 455 (%) M | 100 | 100 |
| P at m/z 456 (%) M+1 | 21.9 | 26.04 |
| P /P M+1 M | 0.22 | 0.26 |
| % Change of isotopic abundance ratio (P /P ) with M+1 M respect to the control sample | 18.90 |
Table 1: LC-MS based isotopic abundance analysis results of cefazolin in Biofield Energy Treated sample compared to the control s
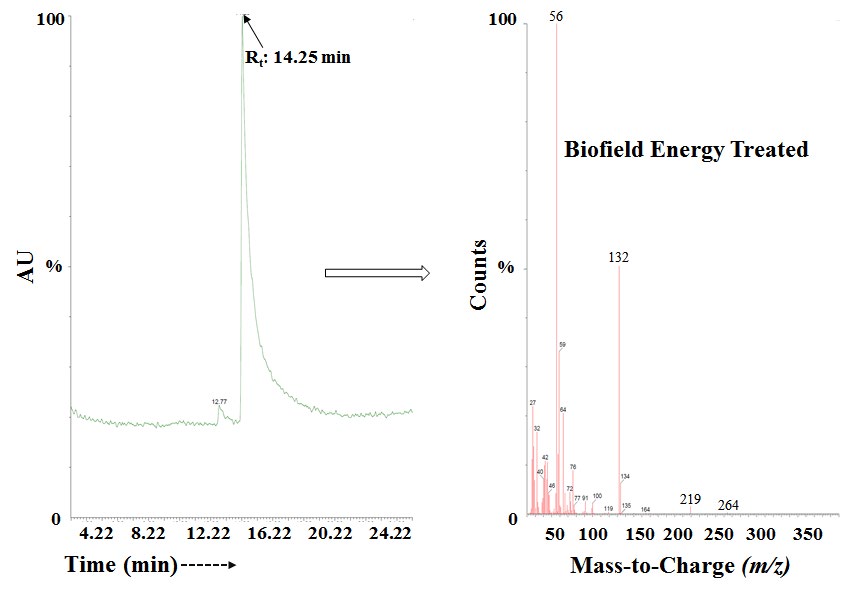
Gas Chromatography-Mass Spectrometry (GC-MS) Analysis The GC of the control and Biofield Energy Treated samples of cefazolin sodium showed the presence of a sharp intense chromatographic peak in the chromatograms (Figures 4 and 5).
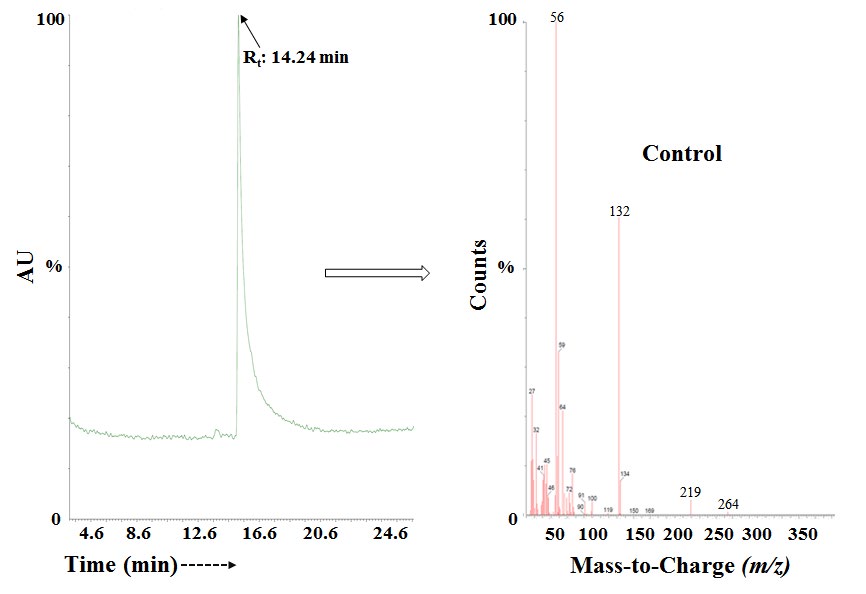
The retention times of the Biofield Energy Treated sample (14.25 minute) was close to those of the control sample (14.24 minutes). The mass spectra did not show the parent molecular ion peak of cefazolin sodium in any of the mass spectra of control and Biofield Energy Treated samples. The fragment peaks at m/z 264, 219, 132, and 56 of the control (Figure 4) and Biofield Energy Treated (Figure 5) cefazolin sodium were observed in both the mass spectra. The mass peak intensities of the control sample were significantly altered compared to the Biofield Energy Treated sample. The mass peak intensities of the control sample at m/z 56, 132, 219, and 264 were significantly decreased by 33.51%, 44.74%, 66.26%, and 73.77%, respectively compared to the Biofield Energy Treated sample (Table 2).
| Control | Biofield Energy Treated | % Change | |
|---|---|---|---|
| $56 | 1.88e^{8}$ | $1.25e^{8}$ | $-33.51 |
| 132 | 1.14e^{8}$ | $0.63e^{8}$ | $-44.74 |
| 219 | 5.78e^{6}$ | $1.95e^{6}$ | $-66.26 |
| 264 | 1.22e^{6}$ | $0.32e^{6}$ | $-73.77 |
Table 2: GC-MS peak intensities of the control and Biofield Energy Treated cefazolin sodium. m/z: mass to charge ratio.
The LC-MS and GC-MS study confirmed the structure of cefazolin sodium. The LC-MS based isotopic abundance ratios of PM+1/PM (2H/1H or 13C/12C or 15N/14N or 17O/16O or 33S/32S) in the Biofield Energy Treated cefazolin sodium were significantly altered compared to the control sample. Modern physics explain that the neutrinos change identities which are only possible if the neutrinos possess mass and have the ability to interchange their phase from one phase to another internally. Therefore, the neutrinos have the ability to interact with protons and neutrons in the nucleus, which indicated a close relation between neutrino and the isotope formation [12, 32, 33]. The altered isotopic composition in molecular level of The Trivedi Effect®-Consciousness Energy Healing Treated cefazolin sodium might be due to the alteration in neutron to proton ratio in the nucleus. It can be hypothesized that the changes in isotopic abundance could be due to changes in nuclei possibly through the interference of neutrino particles via The Trivedi Effect® - Consciousness Energy Healing Treatment. The new form of cefazolin sodium (Biofield Energy Treated) would be better to design better pharmaceutical formulations that might offer better therapeutic response against various diseases.
Conclusions
The experimental results revealed that The Trivedi Effect®-Consciousness Energy Healing Treatment (Biofield Energy Healing Treatment) showed the significant impact on the isotopic abundance ratios and mass peak intensities of cefazolin sodium. The LC-MS spectra of both the control and Biofield Energy Treated samples of cefazolin sodium at the retention time (Rt) 4.6 minutes exhibited the mass of the protonated molecular ion peak at m/z 455 [M+H]+ (calculated for C14H15N8O4S3 +, 455.05). The LC-MS based isotopic abundance ratio of PM+1/PM (2H/1H or 13C/12C or 15N/14N or
17O/16O or 33S/32S) in the Biofield Energy Treated cefazolin was significantly increased by 18.90% compared with the control sample. Thus, 13C, 2H, 15N, 17O and 33S contributions from (C14H15N8O4S3)+ to m/z 456 in the Biofield Energy Treated sample were significantly increased compared with the control sample. In the GC-MS the retention times of the Biofield Energy Treated sample (15.25 minute) was found to be very close to the control sample (15.24 minutes). The mass peak intensities of the control sample at m/z 56, 132, 219, and 264 were significantly decreased by 33.51%, 44.74%, 66.26%, and 73.77%, respectively compared to the Biofield Energy Treated sample (Table 2). Hence, 13C, 2H, 15N, 17O, and 33S contributions from (C14H15N8O4S3)+ to m/z 456 in the Biofield Energy Treated sample were significantly increased compared with the control sample. The isotopic abundance ratio of PM+1/PM (2H/1H or 13C/12C or 15N/14N or 17O/16O or 33S/32S) and peak intensities in the Biofield Energy Treated cefazolin sodium were significantly altered compared to the control sample. The new form of Biofield Energy Treated cefazolin sodium would be better designing novel pharmaceutical formulations that might offer better therapeutic response against cellulitis, respiratory tract infections, urinary tract infections (UTI), genital infections, joint infection, biliary tract infections, pneumonia, endocarditis, blood infections (sepsis), and also prevent group B streptococcal disease at the time of delivery and before surgery_, etc._
Acknowledgements
The authors are grateful to Sophisticated Instrumentation Centre for Applied Research & Testing (SICART) India, Trivedi Science, Trivedi Global, Inc., Trivedi Testimonials, and Trivedi Master Wellness for their assistance and support during this work.
References
-
(2018) DailyMed - Cefazolin - cefazolin sodium injection, powder, for solution.
-
Katzung, Trevor AJ (2015) Basic & Clinical Pharmacology. New York: McGraw Hill Education. pp: 776-778.
-
Cefazolin sodium - Drug Summary.
-
Stork CM (2006) Antibiotics, antifungals, and antivirals. New York: McGraw-Hill, pp: 847.
-
How TH, Loo WY, Yow KL, Lim LY, Chan EW, et al. (1998) Chemical stability of pharmacy-compounded cefazolin sodium eye drops. J Clin Pharm Ther 23: 41-47.
-
Wang J, Qian Y, Zhang M, Wu J, Yang Z (2012) Cefazolin sodium pentahydrate crystal and its molecular assembly preparation method. United States Patent US 8(178): 1-8.
-
Chereson R (2009) Bioavailability, bioequivalence, and drug selection. 1st (Edn.), In: Makoid CM, Vuchetich PJ, Banakar UV (Eds.), Basic pharmacokinetics. Pharmaceutical Press, London.
-
Trivedi MK, Patil S, Shettigar H, Singh R, Jana S (2015) An impact of biofield treatment on spectroscopic characterization of pharmaceutical compounds. Mod Chem appl 3(3): 159.
-
Trivedi MK, Tallapragada RM, Branton A, Trivedi D, Nayak G, et al. (2015) Physicochemical characterization of biofield energy treated calcium carbonate powder. American Journal of Health Research 3(6): 368-375.
-
Trivedi MK, Branton A, Trivedi D, Nayak G, Panda P, et al. (2016) Gas chromatography-mass spectrometric analysis of isotopic abundance of 13C, 2H, and 18O in biofield energy treated _p_-tertiary butylphenol (PTBP). American Journal of Chemical Engineering 4(4): 78-86.
-
Trivedi MK, Mohan TRR (2016) Biofield energy signals, energy transmission and neutrinos. American Journal of Modern Physics 5(6): 172-176.
-
Rubik B (2002) The biofield hypothesis: Its biophysical basis and role in medicine. J Altern Complement Med 8(6): 703-717.
-
Nemeth L (2008) Energy and biofield therapies in practice. Beginnings 28(3): 4-5.
-
Rivera-Ruiz M, Cajavilca C, Varon J (2008) Einthoven’s string galvanometer: The first electrocardiograph. Tex Heart Inst J 35(2): 174-178.
-
Rubik B, Muehsam D, Hammerschlag R, Jain S (2015) Biofield science and healing: history, terminology, and concepts. Glob Adv Health Med 4: 8-14.
-
Koithan M (2009) Introducing complementary and alternative therapies. J Nurse Pract 5(1): 18-20.
-
Barnes PM, Bloom B, Nahin RL (2008) Complementary and alternative medicine use among adults and children: United States, 2007. Natl Health Stat Report 12: 1-23.
-
Trivedi MK, Mohan R, Branton A, Trivedi D, Nayak G, et al. (2015) Evaluation of atomic, physical, and thermal properties of bismuth oxide powder: An impact of biofield energy treatment. American Journal of Nano Research and Applications 3(6): 94-98.
-
Trivedi MK, Patil S, Tallapragada RM (2013) Effect of bio field treatment on the physical and thermal characteristics of vanadium pentoxide powders. J Material Sci Eng S 11:1-4.
-
Trivedi MK, Branton A, Trivedi D, Nayak G, Gangwar M, Jana S (2015) Agronomic characteristics, growth analysis, and yield response of biofield treated mustard, cowpea, horse gram, and groundnuts. International Journal of Genetics and Genomics 3(6): 74-80.
-
Trivedi MK, Branton A, Trivedi D, Nayak G, Mondal SC, et al. (2015) Evaluation of plant growth, yield and yield attributes of biofield energy treated Mustard (_Brassica juncea_) and Chick pea (_Cicer Arietinum_) Seeds. Agriculture, Forestry and Fisheries 4(6): 291-295.
-
Trivedi MK, Branton A, Trivedi D, Nayak G, Mondal SC, et al. (2015) Antibiogram, biochemical reactions and biotyping of biofield treated _Providencia rettgeri_. American Journal of Health Research 3(6): 344-351.
-
Trivedi MK, Patil S, Shettigar H, Gangwar M, Jana S (2015) An Evaluation of biofield treatment on susceptibility pattern of multidrug resistant stenotrophomonas maltophilia: An emerging global opportunistic pathogen. Clin Microbiol 4: 211.
-
Trivedi MK, Patil S, Shettigar H, Mondal SC, Jana S (2015) The potential impact of biofield treatment on human brain tumor cells: A time-lapse video microscopy. J Integr Oncol 4(3): 141.
-
Trivedi MK, Patil S, Shettigar H, Gangwar M, Jana S (2015) In vitro evaluation of biofield treatment on cancer biomarkers involved in endometrial and prostate cancer cell lines. J Cancer Sci Ther 7(7): 253-257.
-
Trivedi MK, Branton A, Trivedi D, Shettigar H, Bairwa K, et al. (2015) Fourier transform infrared and ultraviolet- visible spectroscopic characterization of biofield treated salicylic acid and sparfloxacin. Nat Prod Chem Res 3(5): 186.
-
Schellekens RC, Stellaard F, Woerdenbag HJ, Frijlink HW, Kosterink JG (2011) Applications of stable isotopes in clinical pharmacology. Br J Clin Pharmacol 72(6): 879- 897.
-
Weisel CP, Park S, Pyo H, Mohan K, Witz G (2003) Use of stable isotopically labeled benzene to evaluate environmental exposures. J Expo Anal Environ Epidemiol 13(5): 393-402.
-
Muccio Z, Jackson GP (2009) Isotope ratio mass spectrometry. Analyst 134: 213-222.
-
Rosman KJR, Taylor PDP (1998) Isotopic compositions of the elements 1997 (Technical Report). Pure Appl Chem 70(1): 217-235.
-
Smith RM (2004) Understanding Mass Spectra: A Basic Approach, Second Edition, John Wiley & Sons, Inc.
-
Jürgen H (2004) Gross Mass Spectrometry: A Textbook. 2nd (Edn), Springer: Berlin.
-
Zhang M, Moore GA, Everts R, Begg EJ (2014) Determination of Total and Free Concentrations of Flucloxacillin and Cefazolin in Human Plasma by Liquid Chromatography/Tandem Mass Spectrometry. J Anal Bioanal Tech 5: 1-9.
- Acido Labile or Gastro Irritant Apis and Enteric Release in Galenic Practice: An Overview
- A Study on Knowledge, Attitude and Practice of Hand Hygiene among Healthcare Professionals at a Tertiary Care Hospital, India
- Influence of Inoculum Concentration on In Vivo Incubation Period of Emmia lacerata, Pathogenesis and Management of Wilt in Pepper (Capsicum annuum L.)
- Vanilla’s Chemistry
- Marine Anti-Cancer Compounds and Adverse Effects of Global Warming on Oceans: An Overview
- Serological Investigation of Chikungunya Virus Antibody among Malaria-Suspected Febrile Patients in Some Healthcare Facilities in Rivers State