Stability Indicating Method Development and Validation of Empagliflozin in Bulk and Pharmaceutical Dosage form by using RPHPLC
An easy reverse stage HPLC approach was created for the determination of Empagliflozin existing wholesale as well as pharmaceutical dosage forms. A Kromasil 100-C18 (250 X 4.6 mm, loaded with 5μ) column in an isocratic mode with mobile stage Acetonitrile: Phosphate barrier [Pot.dihydrogen Orthophosphate 2.725 gm + Dipottasium hydrogen orthophosphate 0.525 gm, 50:50% V/V] effluent was monitored at 301nm. The retention times were 3.333 minutes (±0.5). The flow rate was 1ml\min and also injection quantity was 20μl. The run time offered was 10 mins. The recommended technique was likewise verified. Conclusion: The proposed method was straightforward, delicate as well as dependable with excellent precision and accuracy. The recommended approach specifies while estimating the industrial formulations without disturbance of excipients and also other additives. Thus, this method can be used for the regular determination of Empagliflozin in pure examples and pharmaceutical formulas.
Introduction
High Performance Liquid Chromatography
HPLC is a form of liquid chromatography used to separate compounds that are dissolved in solution. HPLC instruments consist of a reservoir of mobile phase, a pump, an injector, a separation column, and a detector.
Compounds are separated by injecting a sample mixture onto the column. The different component in the mixture pass through the column at differentiates due to differences in their partition behavior between the mobile phase and the stationary phase.
High performance liquid chromatography (HPLC) is basically a highly improved form of column liquid chromatography. Instead of a solvent being allowed to drip through a column under gravity, it is forced through under high pressures of up to 400 atmospheres. That makes it much faster.
All chromatographic separations, including HPLC operate under the same basic principle; separation of a sample into its constituent parts because of the difference in the relative affinities of different molecules for the mobile phase and the stationary phase used in the separation [1, 2, 3]. Types of HPLC In general there are five techniques of HPLC. They are as follows:
Based on Polarity
Normal Phase HPLC: NP-HPLC uses polar stationary
phase and non-polar mobile phase. Reverse Phase HPPLC: The stationary phase is nonpolar (hydrophobic), while the mobile phase is a polar.
Based on Principle of Separation
- Adsorption chromatography
- Ion exchange chromatography
- Ion pair chromatography
- Size exclusion chromatography
- Chiral chromatography
Based on Elution Technique
- Isocratic
- Gradient
Based on Scale of Preparation
- Analytical HPLC
- Preparative HPLC
Based on Type of Analysis
- Qualitative
- Quantitative.
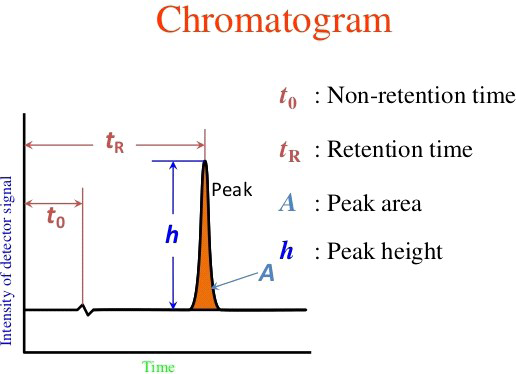
Retention Time
The time difference between the point of injection and appearance of peak maxima is called retention time. It is the time required for 50% of component to be eluted, measured in minutes or seconds.
Retention Volume
The volume of a carrier gas required to elute 50% of the component from the column is called retention volume.
Retention volume = Retention time X Flow rate
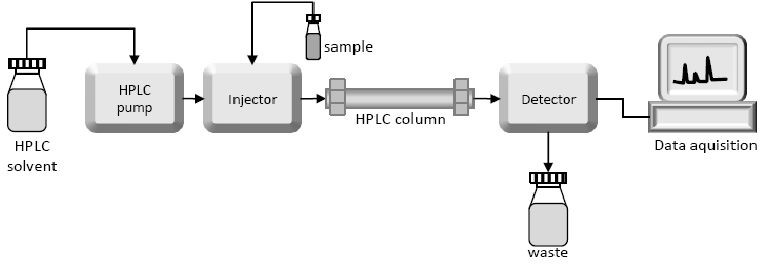
The specific components HPLC and their working roles are reported below. Mobile phase and reservoir Solvent degassing system Pump Injector Column Detector
Principal involved in HPLC
HPLC principle is based on both Adsorption as well as Partition, depending upon the nature of stationary phase. If stationary phase is solid then it is adsorption and if stationary phase is liquid then it is partition. When a mixture of components are introduced into a HPLC Column, they travel according to their relative affinities towards the stationary phase. The component which has more affinity towards the adsorbent, travels slower. The component which has less affinity towards the stationary phase travels faster. Since no two components have the same affinity towards the stationary phase, the components are separated [4, 5].
Materials and Methods
Determination of λmax by UV spectrophotometer
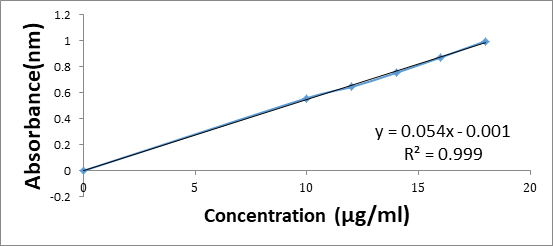
Preparation of Primary stock solution: Stock solution is prepared by transferring accurately weighed 10 mg of Empagliflozin in 10 ml volumetric flask and dissolved in 5 ml acetonitrile and sonicate it for 15 min by using ultrasonicator. Then volume was make up to the 10 ml with acetonitrile to get the concentration of 1000 μg/ml. Preparation of Secondary stock solution: Stock solution is prepared by transferring accurately 1ml of primary stock solution of Empagliflozin into 10 ml volumetric flask and dissolved in 5 ml acetonitrile and sonicate it for 15 min by using ultrasonicator. Then volume was make up to the 10 ml to get the concentration of 100 μg/ml. Preparation of working standard: The standard solution of 10 μg/ ml was prepared by taking 1ml of solution from 100 μg/ ml stock solution and diluted up to the 10 ml. This solution was scanned between the range 200-400 nm in uv spectrophotometer against the acetonitrile as blank after base line correction. The optimum wavelength for Empagliflozin was found to be 301nm. Preparation of calibration curve: Working solution was prepared from stock solution by further dilution with acetonitrile to obtained a concentration range 10, 12, 14, 16, 18, 20 μg/ml, respectively. These solutions were scanned from the range 301nm and calibration curve was obtained between concentrations of 10-20 μg/ml.
| S.No | Concentration | Absorbance |
|---|---|---|
| 1 | 0 | 0 |
| 2 | 10 | 0.559 |
| 3 | 12 | 0.645 |
| 4 | 14 | 0.754 |
| 5 | 16 | 0.873 |
| 6 | 18 | 0.998 |
Table 1: Calibration curve values for Empagliflozin.
Preparation of Mobile Phase
Accurately measured 700 ml (70%) of acetonitrile and 300 ml of potassium dihydrogen ortho phosphate (30%) were mixed and degassed in a digital ultrasonicater for 10 minutes and then filtered through 0.45 µm filter under vacuum filtration. Diluent Preparation: The Mobile phase was used as the diluent. Mobile Phase Optimization: Initially the mobile phase tried was Methanol: Water and Acetonitrile and water with varying proportions. Finally, the mobile phase was optimized to Acetonitrile and potassium dihydrogen ortho phosphate in proportion of 70:30 v/v respectively.
Optimization of Column
The method was performed with various C18 columns like ODS column, Xterra and kromasil column.) Kromasil 100-C18 (250 X 4.6 mm, loaded with 5µ) column was found to be ideal as it gave good peak shape and resolution at 1.0ml/min flow.
Method Optimization
Preliminary chromatographic conditions: Stationary stage: Kromasil 100-C18 (250 X 4.6 mm, loaded with 5µ) column Mobile stage: Acetonitrile: Potassium dihydrogen orthophoshate (70:30 v/v). Flow rate: 1 ml/ minutes. Detector wavelength: 301 nm. Column temperature: Ambient Sample Blank

System Suitability
Selecting a proper system suitability testing mixture is essential to check the specifications of a chromatographic method. System suitability testing methods are the acceptance criteria that must be met prior to sample analysis. Some parameters that can be checked using system suitability are resolution, retention time , plate number etc.

| S. No | Peak Name | RT | Area (µV*sec) | Height (µV) | USP Plate Count | USP Tailing |
|---|---|---|---|---|---|---|
| 1 | Empagliflozin | 3.398 | 145965 | 32653 | 8475 | 1.78 |
| 2 | Empagliflozin | 3.324 | 146857 | 32785 | 8495 | 1.79 |
| 3 | Empagliflozin | 3.349 | 145985 | 32598 | 8492 | 1.80 |
| 4 | Empagliflozin | 3.388 | 146697 | 32695 | 8463 | 1.76 |
| 5 | Empagliflozin | 3.364 | 145982 | 32675 | 8458 | 1.77 |
| Mean | 146380.25 | |||||
| Std. Dev. | 462.762 | |||||
| % RSD | 0.316137 |
Table 2: Showing values for Empagliflozin AUC.
Assay (Standard)
| S.No | Peak Name | RT | Area (µV*sec) | Height (µV) | USP Plate Count | USP Tailing |
|---|---|---|---|---|---|---|
| 1 | EMPAGLIFLOZIN | 3.379 | 145857 | 32654 | 8546 | 1.76 |
| 2 | EMPAGLIFLOZIN | 3.303 | 145874 | 32587 | 8574 | 1.77 |
| 3 | EMPAGLIFLOZIN | 3.322 | 145685 | 32564 | 8759 | 1.76 |
| 4 | EMPAGLIFLOZIN | 3.327 | 145876 | 32854 | 8598 | 1.76 |
Table 3: Peak results for Assay standard.
| S.No. | Name | RT | Area | Height | USP Tailing | USP Plate Count | Injection |
|---|---|---|---|---|---|---|---|
| 1 | Empagliflozin | 3.310 | 145 | 32658 | 1.78 | 8457 | 1 |
| 2 | Empagliflozin | 3.398 | 146874 | 32547 | 1.77 | 8495 | 2 |
| 3 | Empagliflozin | 3.388 | 146524 | 32658 | 1.78 | 8475 | 3 |
Table 4: Peak results for Assay sample.
The % purity of Empagliflozin pharmaceutical dosage form was found to be 99.57%
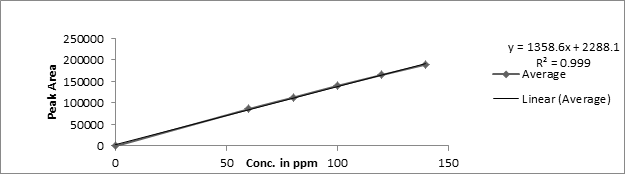
Linearity
| Concentration mg/ml | Average Peak Area |
|---|---|
| 60 | 85784 |
| 80 | 112564 |
| 100 | 139867 |
| 120 | 165248 |
| 140 | 189586 |
Table 5: Linearity values for Empagliflozin.
Linearity Plot
The plot of Concentration (x) versus the Average Peak Area (y) data of DRUG is a straight Line. Y = mx + c (Slope (m) = 1358k, Intercept (c) = 2288, Correlation Coefficient (r) = 0.99)
Precision
The precision of an analytical procedure expresses the closeness of agreement (degree of scatter) between a series of measurements obtained from multiple sampling of the same homogeneous sample under the prescribed conditions.
Repeatability
Obtained Five (5) replicates of 100% accuracy solution as per experimental conditions. Recorded the peak areas and calculated % RSD
| S. No. | Peak name | Retention time | Area(µV*sec) | Height (µV) | USP Plate Count | USP Tailing |
|---|---|---|---|---|---|---|
| 1 | Empagliflozin | 3.397 | 145865 | 32652 | 8547 | 1.78 |
| 2 | Empagliflozin | 3.390 | 145874 | 32541 | 8498 | 1.78 |
| 3 | Empagliflozin | 3.384 | 145842 | 32564 | 8547 | 1.77 |
| 4 | Empagliflozin | 3.378 | 145869 | 32548 | 8572 | 1.77 |
| 5 | Empagliflozin | 3.364 | 145265 | 32569 | 8569 | 1.78 |
| Mean | 145743 | |||||
| Std.dev | 267.4911 | |||||
| %RSD | 0.183536 |
Table 6: Precision values for Empagliflozin.
Limit of Detection for Empagliflozin
The detection limit of an individual analytical procedure is the lowest amount of analyte In a sample which can be detected but not necessarily quantitated as an exact value. LOD= 3.3 × σ / s Where σ = Standard deviation of the response S = Slope of the calibration curve
Result
LOD =1.5µg/ml
Quantitation limit The quantitation limit of an individual analytical procedure is the lowest amount of analyte in a sample which can be quantitatively determined. LOQ=10×σ/S Where σ = Standard deviation of the response S = Slope of the calibration curve
Result
LOQ = 4.5µg/ml
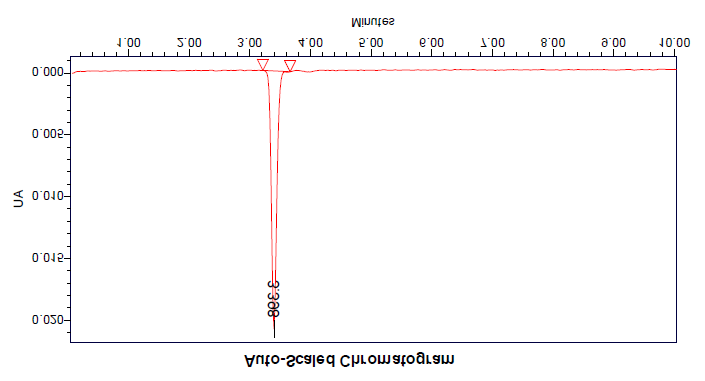
Stability Studies
Acid Degradation Studies
To 1 ml of Empagliflozin stock, 1 ml of 2N HCl was added and refluxed for 30 min at 60 ºC. The resultant solution was neutralized with 1 ml 2N NaOH and makeup to final volume to obtain (100μg/mL) solution. Cool the solution to room temperature and filtered with 0.45μm membrane filter. A sample of 10μl was injected into the HPLC system, and the chromatograms were recorded to assess the stability of the sample.
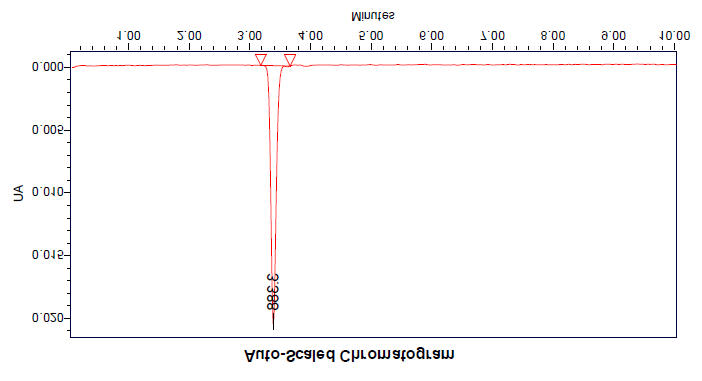
Alkali Degradation Studies
To 1 ml of stock solution of Empagliflozin 1 ml of 2N sodium hydroxide was added and refluxed for 30 min at 60 ºC. The resultant solution was neutralized with 1 ml 2N HCl and makeup to final volume to obtain (100μg/mL) solution. Cool the solution to room temperature and filtered with 0.45μm membrane filter. The sample of 10μl was injected into the system, and the chromatograms were recorded to an assessment of sample stability.
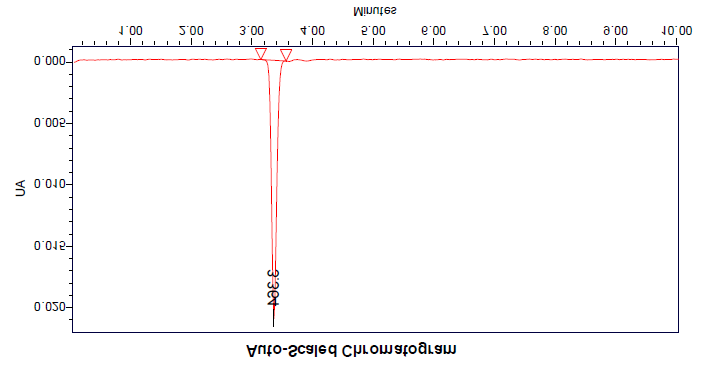
Oxidation Degradation Studies
To 1 ml of stock solution of Empagliflozin 1 ml of 20% hydrogen peroxide (H2O2) was added separately. The solution was kept for 30 min at 60ºC. For HPLC study, the resultant solution was diluted to obtain (100μg/mL) solution. Cool the solution to room temperature and filtered with 0.45μm membrane filter. A sample of 10μl solution was injected into the system, and the chromatograms were recorded to assess the stability of the sample [6, 7, 8, 9, 10]. Photo Degradation Studies The photo stability of the empagliflozin was studied by exposing the stock solution to UV light for 1day or 200Watt- hours/m2 in photo stability chamber [11, 12, 13, 14, 15, 16, 17, 18]. For HPLC study, the resultant solution was diluted to obtain (100μg/ mL) solution and filtered with 0.45μm membrane filter. A sample of 10μl solution was injected into the system, and the chromatograms were recorded for the assessment of sample stability.
% 100 Sample Area Degradation Standard Area = ×
| S.No. | Stress Condition | Peak Area | % of Degraded Amount | % of Active Amount | Total % of Amount |
|---|---|---|---|---|---|
| 1 | Standard | 145867.00 | 0 | 100% | 100% |
| 2 | Acidic | 112259.24 | 0.345 | 99.65 | 100% |
| 3 | Basic | 124687.11 | 0.684 | 99.31 | 100% |
| 4 | Oxidative | 133803.79 | 0.489 | 99.51 | 100% |
| 5 | Thermal | 136341.88 | 0.765 | 99.23 | 100% |
| 6 | Photolytic | 134956.14 | 0.233 | 99.76 | 100% |
Table 7: Consolidate values for Stability studies of Empagliflozin.
Conclusion
In the present investigation, a simple, sensitive, precise and accurate RP-HPLC method was developed for the quantitative estimation of Empagliflozin in bulk drug and pharmaceutical dosage forms. This method was simple, since diluted samples are directly used without any preliminary chemical derivatisation or purification steps. Empagliflozin was found to be soluble in organic solvents such as ethanol, DMSO, and acetonitrile, dimethyl formaldehyde and soluble in water and it is freely soluble in dichloromethane, sparingly soluble in ethyl alcohol. Acetonitrile and potassium dihydrogen ortho phosphate (70:30 v/v) was chosen as the mobile phase. The solvent system used in this method was economical. The %RSD values were within 2 and the method was found to be precise. The results expressed in Tables for RP-HPLC method was promising. The RP-HPLC method is more sensitive, accurate and precise compared to the Spectrophotometric methods. This method can be used for the routine determination of empagliflozin in bulk drug and in Pharmaceutical dosage forms
References
-
Rezk Naser L, Brown Kevin C, Kashuba Angela DM (2006) A simple and sensitive bioanalytical assay for simultaneous determination of omeprazole and its three major metabolites in human blood plasma using RP- HPLC after a simple liquid–liquid extraction procedure. Journal of chromatography 844(2): 314-321.
-
Lima VV, Oliveira RV, Cassiano NM, Degania LG (2003) Journal of chromatography 798(2): 275-281.
-
Satoskar RS, Bhandarkar SD, Ainapure SS (2003) Pharmacology and also Pharmacotherapeutics. 18th (Edn.), pp: 723, 763, 345, 639.
-
Katzung BG (2001) Standard and Clinical Pharmacology. 8th (Edn.), pp: 832-835, 883, 884.
-
Hardman JG, Limbird LE (2001) Goodman as well as Gilman’s. The medicinal basis of Therapies 10th (Edn.), pp: 1354-1357.
-
Lakshmana Prabhu S, Shirwaikar A, Shirwaikar A, Dinesh Kumar C, Joseph A, et al. (2008) Simultaneous Estimation of Esomeprazole and Domperidone by UV Spectrophotometric Method. Indian J Pharm Sci 70(1): 128-131.
-
Syed AA, Syeda A (2008) Spectrophotometric Determination of Certain Benzimidazole Proton Pump Inhibitors. Indian Journal of Pharmaceutical Science 7(4): 507-510.
-
Rahman N, Bano Z, Hejaz Azmi SN (2008) Spectrophotometric Determination of Esomeprazole Magnesium in Commercial Tablets Using 5‐Sulfosalicylic Acid and N‐Bromosuccinimide. Journal of Chinese Chemical Society 55(3): 557-566.
-
Onal A, Oztunc A (2006) Journal of Chinese Chemical Culture 14a: 12- 18
-
Patel BH, Suhagia BN, Patel MM, Patel JR (2007) Determination of Pantoprazole, Rabeprazole, Esomeprazole, Domperidone and Ito. Chramatographia 65: 11-12, 743-748.
-
Roosewelt AR, Mangesh A, Ravisundar P, Shanmuga Pandiyan P, Muthuprasanna, Gunasekaran V (2007) Asian Journal of Chemistry 19(5): 3959-3962.
-
Garcia-encina G, Farran R, Puig S, Martinez L, Journal of pharmaceutical and also biomedical evaluation,
-
Hultman L, Stenhoff H, Liljeblad M (2007) Determination of esomeprazole and its two main metabolites in human, rat and dog plasma by liquid chromatography with tandem mass spectrometry. Journal of Chromatography B. Analytical-Technologies-in-- the-Biomedical-and-Life- Sciences 848(2): 317-322.
-
Hofmann U, Schwab M, Treiber G, Ulrich K (2006) Sensitive quantification of omeprazole and its metabolites in human plasma by liquid chromatography- mass spectrometry. J Chromatogr B Analyt Technol Biomed Life Sci 831(1-2): 85-90.
-
Goodman Gilman’s A, Rall TW, Nies AS (1990) The pharmacological basis of Therapies”. 8th (Edn.), Pergamon Press, New York, pp: 674-683.
-
Williams AD, Lemke LT, Lippincott W (2003) Foye’s Concepts of Medical Chemistry. 5th (Edn.), pp: 968, 969-
-
Budavari S (2001) The Merck Index, An Encyclopedia of Chemicals, Medicines as well as Biologicals. 13th (Edn.), White House Station NJ, pp: 827, 8881.
-
Tripathi KD (2003) Esssentials of Medical Pharmacology. 15th (Edn.), pp: 737-738, 725-729.
- Acido Labile or Gastro Irritant Apis and Enteric Release in Galenic Practice: An Overview
- A Study on Knowledge, Attitude and Practice of Hand Hygiene among Healthcare Professionals at a Tertiary Care Hospital, India
- Influence of Inoculum Concentration on In Vivo Incubation Period of Emmia lacerata, Pathogenesis and Management of Wilt in Pepper (Capsicum annuum L.)
- Vanilla’s Chemistry
- Marine Anti-Cancer Compounds and Adverse Effects of Global Warming on Oceans: An Overview
- Serological Investigation of Chikungunya Virus Antibody among Malaria-Suspected Febrile Patients in Some Healthcare Facilities in Rivers State