Analytical Method Development and Validation of Tramadol Hydrochloride by Pharmaceutical Dosage Form by Ultraviolet Spectroscopy
Tramadol could be a painkiller just like an opioid. It acts within the central system (CNS) to alleviate pain. Tramadol is employed to treat moderate to severe pain in adults widely used for clinical purposes. During this respect, we aimed to develop an easy and economic UV spectrophotometric method for estimation of Tramadol Hydrochloride in bulk, injection, and tablet dosage form and validate as per ICH guidelines. Analytical research and development may be a process that assures quality attributes and internal control of the products. Tramadol shows the most absorbance at wavelength 270nm. Tramadol showed the linearity range 20-160µg per ml for this procedure with correlation (R2) was 0.9998. The current methods were found to be simple, linear, precise, accurate, and sensitive and may be used for routine internal control analysis for the estimation of Tramadol Hydrochloride bulk and tablet dosage form.
Introduction
Tramadol hydrochloride first time was discovered and synthesized in 1962 by German company (Grunenthal GmbH) for the treatment of pain. After a protracted gap this drug was introduced into the market with the Tramadol name in 1977 [1]. Tramadol is 2-(dimethyl amino)- methyl)-1-(3ʹ-methoxyphenyl) cyclohexanol hydrochloride. Its formula is C16H25NO2 with a relative molecular mass of 299.8 and contains a pKa of 9.41 [2]. It’s 4-phenyl-piperidine analogue of opioid drug codeine. In US it absolutely was made available after 1995 [3]. It’s available under brand name ULTRAM® [4].
It is a centrally acting synthetic analgesic accustomed treat moderate to moderately severe pain. The drug incorporates a wide selection of applications, including treatment of arthritis, syndrome syndrome, motor neurone disease and fibromyalgia [5, 6]. Tramadol hydrochloride may be a centrally acting synthetic opioid analgesic binding to specific opioid receptors. It’s a non-selective, pure opioid agonist at µ, delta and kappa opioid receptors with a better affinity for µreceptors [7, 8].
There are different analytical procedures for the determination of Tramadol hydrochloride are stated into the literature supported UV spectrophotometry, RP-UPLC and LC-MS alone or together with other drugs [9, 10, 11, 12, 13, 14, 15, 16, 17, 18, 19, 20]. Hence the most objective of this work is to present most accurate, precise and sensitive analytical method and its validation is also further used for determination of Tramadol during routine pilot manufacturing in bulk and pharmaceutical dosage form as per ICH guidelines. The chemical structure of Tramadol hydrochloride is shown in figure 1.
Materials and Methods
Materials
Tramadol Active Pharmaceutical Ingredient was provided as gift tester by Windlass Biotech Dehradun Uttarakhand. Tramadol (Marketed formulation) by Consern Pharma limited.
Instruments
The Ultra Violet-Spectroscopy was conceded out with a Cary 60 Single Beam UV spectrometer manufacturer by Agilent Tech, Digital Weight Balance: TX323L, Shimadzu was used.
Preparation of Standard Stock Solution of Tramadol
Accurately weigh about 50mg of the drug and transferred to 50ml of volumetric flask and dissolved it in 50ml of 0.1N Hcl. Then volume was made up to the mark with 0.1N Hcl. The 10ml of previously set solution was diluted with 50ml of Hcl. This standard solution contained 100µg of drug per ml.
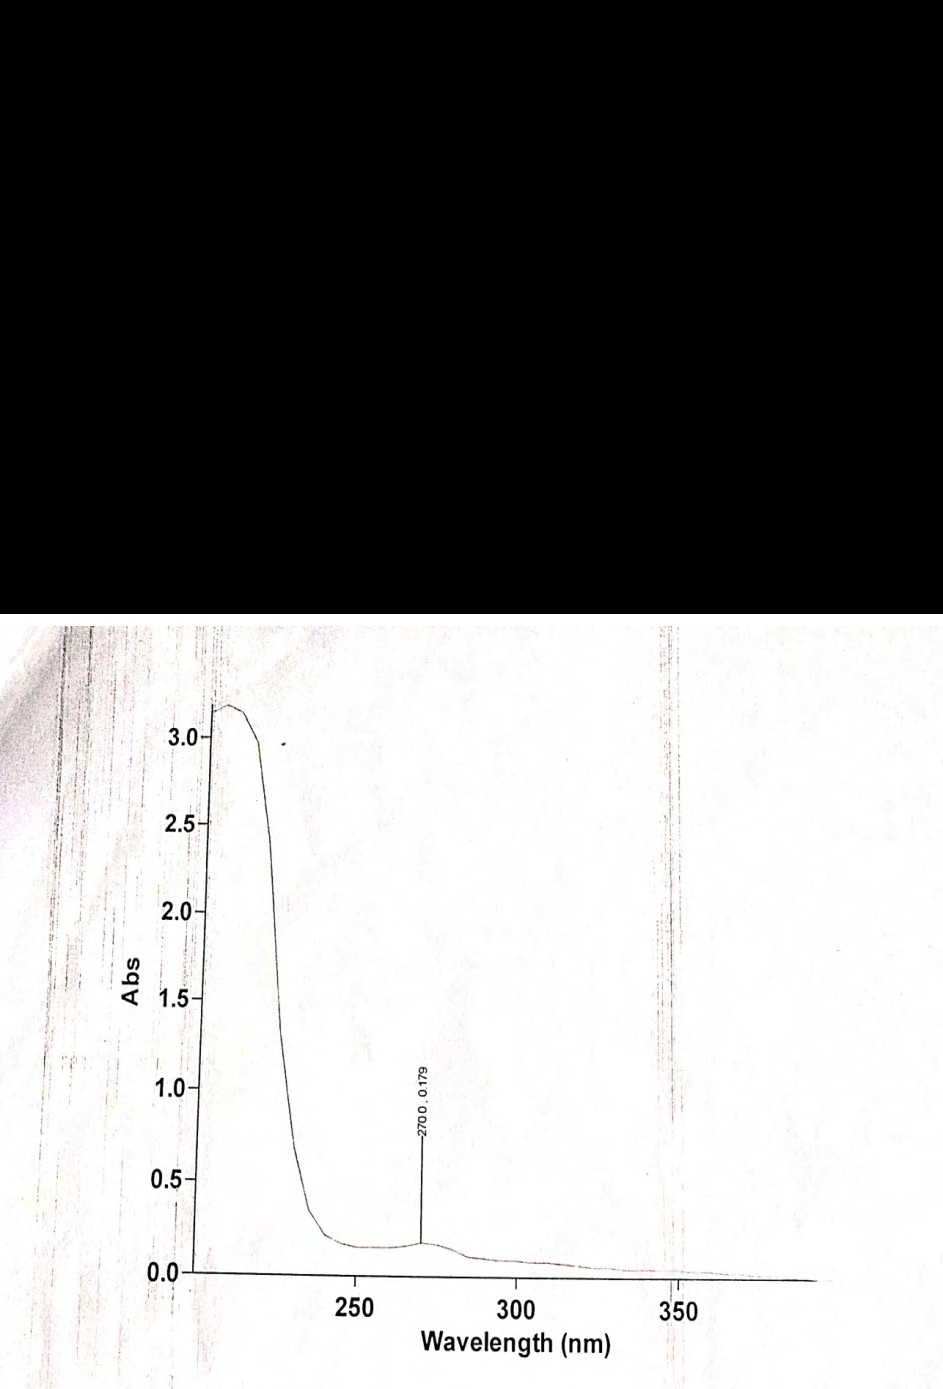
Determination of wavelength of maximum absorbance (λ max)
1ml of standard stock solution was pipette out and transferred to a 10ml of volumetric flask. The volume was made up to the mark with 0.1N HCl. The solution contained 100μg/ml of the drug. Then 1ml of the solution is taken in a 10ml volumetric flask was added to it then volume was made up to the mark with 0.1N HCl. This solution contains 10μg/ ml of the drug. The absorbance of this solution was scanned in the range of 200-400nm against 0.1N HCl as a blank.
Graph 1: Wavelength Of Maximum Absorbance.
Preparation of calibration curve for Tramadol at 270nm
1,2,3,4,5,6,7 and 8ml standard stock solution (200μg/ ml) was pipette out into a series of 10ml volumetric flask. Then the volumes were made up to the mark with 0.1N Hcl and mixed to obtain the solutions in the concentration range of 20, 40, 60, 80, 100, 120, 140, 160μg/ml of drug.
The absorbance of these resultant solutions were measured at 270nm against 0.1N Hcl as a blank and graph was plotted between absorbance obtained and the concentration of the solution. (Table1).
| Concentration (µg/ml) | Absorption | Mean | E1% | Absorptivity | Molar Absorptivity | ||
|---|---|---|---|---|---|---|---|
| A1 | A2 | A3 | |||||
| 0 | 0 | 0 | 0 | 0 | |||
| 20 | 0.1152 | 0.1150 | 0.1151 | 0.1151 | 57.55 | 5.755 | 1515.867 |
| 40 | 0.2340 | 0.2328 | 0.2362 | 0.2340 | 58.5 | 5.85 | 1540.89 |
| 60 | 0.3545 | 0.3545 | 0.3548 | 0.3546 | 59.1 | 5.91 | 1556.694 |
| 80 | 0.4718 | 0.4721 | 0.4716 | 0.4718 | 58.97 | 5.897 | 1553.2698 |
| 100 | 0.5862 | 0.5857 | 0.5863 | 0.5861 | 58.61 | 5.861 | 1543.7874 |
| 120 | 0.7036 | 0.7038 | 0.7028 | 0.7032 | 58.6 | 5.86 | 1543.524 |
| 140 | 0.8081 | 0.8074 | 0.8076 | 0.8077 | 57.69 | 5.769 | 1519.5546 |
| 160 | 0.9241 | 0.9246 | 0.9254 | 0.9247 | 57.79 | 5.779 | 1522.1886 |
Table 1: Study of Repeatability.
Table1: Linearity, Range, E 1% 1CM, Absorptivity (L gm1 cm1), and Molar Absorptivity (L mol-1cm-1).
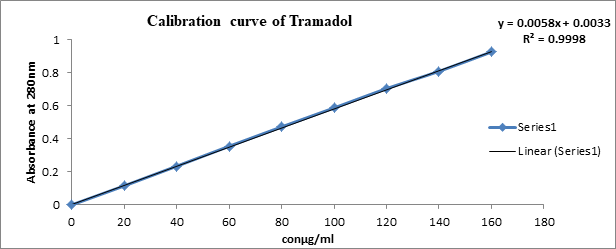
Graph 2: Calibration curve of Tramadol.
Repeatability
Pipetted out 1ml of standard solution shifted into a series of nine 10ml analytical flask and diluted with 0.1N HCl to get the concentration of 20μg/ml. Optical density of the resultant solutions was dignified at 270nm 0.1N HCl used as a blank. The results were obtained and concise in the (Table 2).
| Repeatability | |||||
|---|---|---|---|---|---|
| Nominal Con µg/ml | Absorbance | Observed Con (µg/ml | Mean Con µg/ml | SD | % RSD |
| 20 | 0.1111 | 17.2 | 17.2 | 0.00288 | 0.01676 |
| 20 | 0.1156 | 18.0 | |||
| 20 | 0.1097 | 17.0 | |||
| 20 | 0.1113 | 17.3 | |||
| 20 | 0.1067 | 16.4 | |||
| 20 | 0.1112 | 17.2 |
Table 2: Study of Repeatability.
Intra-Day Precision
Pipette outs 2.5, 5, 7.5ml working solutions were transferred into separate 10ml analytical flasks and diluted with 0.1N HCl to get the concentration 50,100,150μg/ml.
Absorbance of the subsequent solutions was measured at 270nm 0.1N HCl used as a blank. Such six repetitions were performed with in a day 0, 3 and 6 hrs interval. The result was summarized in the (Table3). The % RSD was less than 2%.
| Intra-Day Precision | |||||||||
|---|---|---|---|---|---|---|---|---|---|
| Nominal Conµg/ml | Absorbance | Observed Conc. (µg/ml) | Mean Conc. (µg/ml) | SD | %RSD | ||||
| 0 hr | 3hr | 6hr | 0hr | 3hr | 6hr | ||||
| 50 | 0.2710 | 0.2693 | 0.2642 | 45.5 | 45.2 | 44.3 | 45.0 | 0.624500 | 1.387777 |
| 100 | 0.5324 | 0.5431 | 0.5403 | 91.8 | 93.7 | 93.2 | 92.9 | 0.984886 | 1.060157 |
| 150 | 0.8124 | 0.8135 | 0.812 | 141.3 | 141.5 | 141.3 | 141.4 | 0.115470 | 0.081681 |
| Mean | 0.843205 |
Table 3: Study of Intra-Day Precision.
Inter- Day Precision
Pipette outs 2.5, 5, 7.5ml working solutions were transferred into separate 10ml analytical flasks and diluted with 0.1N HCl to get the concentration 50,100,150μg/ml. Absorbance of the subsequent solutions was measured at 270nm 0.1N HCl used as a blank. Such six studies were performed for day one two day three intervals. The result was summarized in the (Table4).The % RSD was less than 2%.
| Inter-Day Precision | |||||||||
|---|---|---|---|---|---|---|---|---|---|
| Nominal Conµg/ml | Absorbance | Observed Conc. (µg/ml) | Mean Conc. (µg/ml) | SD | %RSD | ||||
| 0 hr | 24hr | 48hr | 0hr | 24hr | 48hr | ||||
| 50 | 0.2898 | 0.2843 | 0.2735 | 48.5 | 48.3 | 47.7 | 48.2 | 0.416333 | 0.86436 |
| 100 | 0.5693 | 0.5745 | 0.5533 | 99.6 | 99.2 | 98.8 | 99.2 | 0.400000 | 0.403226 |
| 150 | 0.8560 | 0.8572 | 0.8463 | 149.6 | 149.3 | 148.9 | 149.3 | 0.351188 | 0.235276 |
| Mean | 0.500954 |
Table 4: Study of Inter-Day Precision.
Accuracy
The accuracy was assessed by the standard addition method of three replicate determinations of three different solutions containing 80,100,120µg/ml of Tramadol Hydrochloride. The average % recoveries for three different concentrations was found to be 99.79 using proposed UV spectrophotometric method. The higher values indicated that the proposed UV spectrophotometric method was accurate for the determination of Tramadol Hydrochloride in pharmaceutical dosage form. Results of recovery studies are summarized in (Table 5).
| Accuracy | ||||
|---|---|---|---|---|
| Recovery | Nominal Conc. (µg/ml) | Absorbance | Observed conc. (µg/ml) | % Recovery |
| 80% | 90=50+40 | 0.5043 | 89.8 | 99.78 |
| 80% | 90=50+40 | 0.5203 | 89.9 | 99.89 |
| 80% | 90=50+40 | 0.5248 | 90.0 | 100.00 |
| 100% | 100=50+50 | 0.6096 | 99.7 | 99.70 |
| 100% | 100=50+50 | 0.5866 | 99.9 | 99.90 |
| 100% | 100=50+50 | 0.5868 | 99.9 | 99.90 |
| 120% | 110=50+60 | 0.6450 | 109.2 | 99.27 |
| 120% | 110=50+60 | 0.6523 | 109.7 | 99.73 |
| 120% | 110=50+60 | 0.6449 | 109.9 | 99.91 |
| Mean | 99.79 |
Table 5: Accuracy.
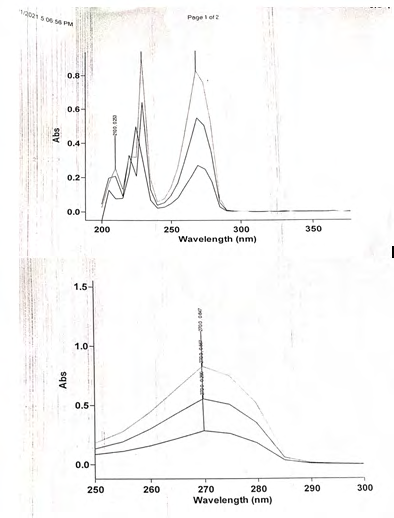
Specificity
Specificity study was carried out by observing any interference in absorbance of drug in the existence of conjoint excipients like Starch, Talc, Lactose, Magnesium Stearate etc. Absorbance of 100μg/ml drug solution with and without excipients was measured at 270nm. The results obtained were summarized in the (Table 6).
| Specificity | |||||
|---|---|---|---|---|---|
| Nominal con(µg/ml) | Without Excipients | With Excipients | % Interference | ||
| Absorbance | Observed Conc. (µg/ml) | Absorbance | Observed Conc. (µg/ml) | ||
| 100 | 0.5855 | 101.2 | 0.5568 | 96.1 | 0.95 |
| 100 | 0.5822 | 100.6 | 0.5796 | 100.1 | 1.00 |
| 100 | 0.5815 | 100.5 | 0.5721 | 98.8 | 0.98 |
| 100 | 0.5600 | 96.7 | 0.5562 | 96.0 | 0.99 |
| 100 | 0.5612 | 96.9 | 0.5717 | 98.7 | 1.02 |
| Mean | 0.987811 |
Table 6: Brand A (TRD-Contin 100mg).
% Assay of Tramadol tablets two different brands (TRD-contin 100mg, Tramacon-TM SR- 100mg)
Taken 5 tablets and weighed accurately for calculated the average weight. The tablets were powdered and amount of powdered containing 100 mg of Tramadol was transferred into 100ml of volumetric analytical flasks and dissolve in 50ml of 0.1N HCl and then sonicate the solution after 20minutes make up the volume up to the mark with 0.1N HCl and then filter the solution. Then take 10ml of filtered solution in 100ml of volumetric analytical flasks and make up the volume up to the mark with 0.1N HCl. The absorbance of this resultant solution was estimated at 270nm (Table 7 and Table 8).
| Sr. No | Absorbance | Conc.(µg/ml) | Dil. Factor | Content (mg) | Label claim(mg) | %Assay |
|---|---|---|---|---|---|---|
| 1 | 0.5669 | 97.9 | 1000 | 97.9 | 100 | 97.9 |
| 2 | 0.5672 | 97.9 | 1000 | 97.7 | 100 | 97.7 |
| 3 | 0.5661 | 97.9 | 1000 | 97.6 | 100 | 97.6 |
| Mean | 97.73 |
Table 7: Brand A (TRD-Contin 100mg).
| Sr. No | Absorbance | Conc.(µg/ml) | Dil. Factor | Content (mg) | Label claim(mg) | %Assay |
|---|---|---|---|---|---|---|
| 1 | 0.6346 | 102.6 | 1000 | 102.60 | 100 | 102.6 |
| 2 | 0.6233 | 101.6 | 1000 | 101.90 | 100 | 101.9 |
| 3 | 0.6239 | 101.7 | 1000 | 101.70 | 100 | 101.7 |
| Mean | 102.06 |
Table 8: Brand B (Tramacon-TM SR-100mg.
Results and Discussion
The present study describes development and validation of simple and economic UV spectrophotometric method for the estimation of Tramadol Hydrochloride in bulk and tablet dosage form using absorbance maxima method. Solubility studies indicated that a Tramadol Hydrochloride shows better solubility in proposed diluents i.e 0.1N HCl solution the λ max of Tramadol Hydrochloride was found to be 270nm. Because of cost effective and minimal maintenance, the present UV spectrophotometric methods can be preferred at small scale industries as compared to other reported methods.
Acknowledgements
We are grateful to the participants, without whom the study would not have been possible. We also express our gratitude to the School of Pharmaceutical Sciences, SGRRU. Patel Nagar, Dehradun, India for kind support providing resources for the study.
References
-
Subedi M, Bajaj S, Kumar MS, Mayur YC (2019) An overview of tramadol and its usage in pain management and future perspective. Biomedicine & Pharmacotherapy 111: 443-451.
-
Thomas SP, Poomali A (2016) Development and validation of RP-HPLC method for simultaneous estimation of paracetamol and tramadol Hydrochloride. Indian J of pharmacy and pharmacology 3(4): 169-172.
-
E Patterson: Tramadol Facts, History, and Statistics,
-
(2014) WHO Update Review Report on Tramadol 36th ECDD, Agenda item 6.1.
-
Sagarbechara, Prabhu PP, Subrahmanyam EVS, Kaneria JJ, Saparia S, et al. (2013) Development of new analytical method and its validation for the determination of tramadol hydrochloride in bulk and marketed formulations Asian J of Biomedical & Pharmaceutical Sciences 3(23): 53-56.
-
Mustafa Sayed, Gauri Bapat (2014) A review on estimation of tramadol hydrochloride in bulk and tablet dosage form by absorbance maxima and area under the curve method. J App Pharm.
-
Tramadol hydrochloride.
-
Jhansi Lakshmi Ch, Ravisankar P, Santosh Kumar KVS, Srinivasa Babu P (2016) Validated UV spectrophotometric method for quantitative analysis of tramadol in bulk and pharmaceutical dosage form. Indian J of Research in Pharmacy and Biotechnology 4(1): 2320-3471.
-
Chaudhari SP, Tawani K, Mahaparale PR (2015) Development and validation of UV spectrophotometric method for simultaneous estimation of Tramadol hydrochloride and Quercetin in niosomes formulation. J Scholar Research Library 7(5): 205-210.
-
Puranik M, Hirudkar A, Wadher SJ, Yeole PG (2006) Development and Validation of spectrophotometric methods for simultaneous estimation of tramadol hydrochloride and chlorzoxazone in tablet dosage form. Indian J of pharmaceutical sciences 68(6): 737-739.
-
J Patel, P Patel (2014) Developed and Validate the RP-HPLC method for the simultaneous estimation of Tramadol Hydrochloride, Chlorzoxazone and Diclofenac sodium from their combined tablet dosage form. International Journal of Pharmacy and Pharmaceutical Sciences pp: 975-1491.
-
Rajendraprasad Y, Rajasekhar KK, Shankarananth V, Keerthisikha P, Ravindra A, et al. (2011) RP-HPLC Method for the Estimation of Tramadol in Bulk and Capsule dosage form. J of Pharmacy Research 4(3): 886-887.
-
Devi BY, Sumanth ks, Raju VB, Gandhi BM, Srinivas K (2017) A new RP-HPLC method development and validation for the simultaneous estimation of ketoroloc tromethamine and tramadol hydrochloride in pharmaceutical dosage forms. J Asian journal pharmaceutical and clinical research 10(5): 186-90.
-
Singh Khushbu (2017) A review on Method Development and Validation of Tramadol Hydrochloride by RP- HPLC Method. International journal of pharmacy and pharmaceutical researchs 10(3): 274-284.
-
Shyamalambica P (2017) Development and Validation of RP-HPLC Method for Estimation of Tramadol Hydrochloride and Paracetamol in Pharmaceutical Formulation. J International Journal of Engineering Research & Technology 6(11): 2278-0181.
-
Donda ST, Baviskar VB, Bari SB, Deshmukh PK, Deore DS, et al. (2016) Development and Validation of RP-HPLC of tramadol hydrochloride and dicyclomine in bulk and pharmaceutical formulation. Journal of the Chilean Chemical Society 61(2): 2852-2855.
-
Tanaka H, Naito T, Mino Y, Kawakami J (2016) Validated determination method of tramadol and its desmethylates in human plasma using an isocratic LC-MS/MS and its clinical application to patients with cancer pain or non- cancer pain. Journal of Pharmaceutical health care and sciences 2: 25.
-
Tambe VS, Deodhar MN, Prakya V (2016) LC and LC- MS study for simultaneous determination of tramadol hydrochloride and ketorolac tromethamine in bulk and formulation with their major degradation products. Bulletin of Faculty of Pharmacy, Cairo University 54(1): 87-97.
- Acido Labile or Gastro Irritant Apis and Enteric Release in Galenic Practice: An Overview
- A Study on Knowledge, Attitude and Practice of Hand Hygiene among Healthcare Professionals at a Tertiary Care Hospital, India
- Influence of Inoculum Concentration on In Vivo Incubation Period of Emmia lacerata, Pathogenesis and Management of Wilt in Pepper (Capsicum annuum L.)
- Vanilla’s Chemistry
- Marine Anti-Cancer Compounds and Adverse Effects of Global Warming on Oceans: An Overview
- Serological Investigation of Chikungunya Virus Antibody among Malaria-Suspected Febrile Patients in Some Healthcare Facilities in Rivers State