Study of Co-Relation between Hepatitis C Viral Load with Clinical Presentations, Laboratory Investigations and Sofosbuvir Combination Therapy
Hepatitis C virus is a causative agent of both acute and chronic liver disease and is associated with varied clinical presentations. Aims & Objectives: The study was undertaken co-relate the various clinical manifestations and derangement of liver and endocrine function with HCV viral replication and to find out the impact of Sofosbuvir combination therapy. Result: Derangement of liver function as indicated by Bilirubin, AST and ALT has significant corelation with active viral replication as indicated by viral load assay. Derangement of Thyroid function is also found in a third of HCV infected patients. The study also found Sofosbuvir combination therapy induces an early virologic response in both Genotype 1 and Genotype 3 infection.
Introduction
Hepatitis C virus, a member of genus Hepacivirus, is a single-stranded positive sense RNA virus recognized first in the year 1989.It is a globally recognised pathogen causing a significant number of both acute and chronic liver disease [1]. Around 80% of individuals exposed to HCV develop chronic infection; 3–11% of those with chronic HCV infection will develop liver cirrhosis within 20 years which could lead to associated risks of liver failure and hepatocellular carcinoma [2].
The high-risk groups of Hepatitis C infection includes those patients who are multi-transfused (e.g. thalassemia major), patients on maintenance haemodialysis, intra- Study of Co-Relation between Hepatitis C Viral Load with Clinical Presentations, Laboratory Investigations and Sofosbuvir Combination Therapy venous drug abusers followed by persons with chronic alcohol intake, tattooing, perinatal transmission, homosexual persons, persons with HIV and unsafe medical procedures (for example needle stick injury) [3, 4].
An understanding of the associated risk factors and natural history of Hepatitis C infection with proper screening would help the clinicians in treatment of such patients and thereby significantly decrease the morbidity and mortality associated with the infection and improves their general life-style. The present study was carried out to determine the co-relation of clinical and laboratory parameters with Hepatitis C viral load which could help in Virol Immunol J
rendering adequate management measures of such patients.
Aims and Objectives
1. To find out the prevalence of active disease among Anti
HCV Antibody positive patients. 2. To find out if there is any relationship between active viral replication as indicated by viral load assay with various clinical presentations, including immune- complex mediated manifestations. 3. To study the relationship between active viral replication and derangement of liver function tests (i.e- bilirubin, AST, ALT, Al. Phosphatase etc.) 4. To study the prognosis of anti-viral therapy by measurement of viral load and comparing the same with patients not treated by anti-viral therapy.
Materials and Methods
Study Type
The study is a descriptive cross- sectional study.
Study Area
The study was done in Department of Microbiology, Medical College, and Kolkata which is a tertiary care hospital in West Bengal.
Study Population
Patients from Kolkata and adjoining districts of West Bengal, of different age groups and both genders who came to Medical College & Hospital, Kolkata with a history of blood transfusion, jaundice, easy fatigue and were clinically suspected to be suffering from liver disorder were included in the study. Sample size was not determined a priori since the study enrolled all patients who had Anti HCV positive by ELISA or Rapid test and were referred to Department of Microbiology for laboratory confirmation.
Study Period
1. Samples were collected from September 2018 to August 2019 2. Result analysis was done in the month of September
2019.
Subject Selection Criteria
Inclusion Criteria
Blood samples from all patients with jaundice, easy fatigue, fever, joint pain with or without rash, ascites receiving blood transfusion, intravenous drug use was taken. Patients with history of needle stick injury, chronic alcohol intake, tattooing, perinatal transmission, high risk sexual behavior were taken. Only those patients who were Anti HCV positive either by ELISA test or Rapid test coming to Department of Microbiology, Medical College and hospital, Kolkata were included in this study. Exclusion Criteria The following patients were excluded from the study: 1. Patients unwilling to give consent or blood. 2. Patients who were serologically negative for Anti-HCV antibody. Patient details Relevant history of patients suffering from jaundice, easy fatigue, joint pain, fever, rashes etc. were taken. History of blood transfusion, intra-venous drug use, unsafe medical practice, needle stick injury, alcohol intake, sexual behaviour, etc. were also taken. Clinical examination was performed. Investigations such as haemoglobin (Hb), the total and the differential leucocyte counts (TLC and DLC), platelet count, haematocrit (Hct), liver function tests (LFT),Urea, Creatinine, Thyroid function tests and Ultrasonography of abdomen were done in all the patients.
Other relevant investigations were performed according to the clinical conditions of the patients. Collection of blood and its processing With aseptic precautions blood was collected from clinically suspected cases and serum was separated by centrifugation. It was stored at -20°C until further testing. HCV Viral load is estimated using Gene Xpert Diagnostic system which manufactured by Cepheid. Following centrifugation of whole blood samples, 1.3mL of plasma can be pipetted directly into the Gene Expert PCR cartridge. Absence of red cells, bubbles, any particulate matter must be ensured. Cartridge barcode is scanned and patient details and identity number is provided. Cartridge is placed in the thermo cycler and is processed. After 1hr 48min of processing, the result is displayed as HCV DETECTED / NOT DETECTED and if detected its viral load. The viral titer was displayed as a log value as well as an E value, whose numerical values were obtained from the online link http://www.healthcare.uiowa.edu/path_handbook/Appe ndix/Calculators/TenExponential.html Data analysis For statistical analysis data were enrolled into a Microsoft Excel spread sheet and then analysed by EpiInfo
7 and Graph Pad Prism version 5. Rate of positivity was estimated by analysing data for the results of Hepatitis viral load by Polymerase chain reaction and any variations in disease reporting by gender, age, clinical features and laboratory parameters were assessed.
Data were summarized as mean and standard deviation for numerical variables and counted and percentages for categorical variables were enumerated. The categorical values were compared by Chi-square test and the non-categorical values were compared by student unpaired T-test. The p-value was calculated wherever required and value ≤0.05 was considered to be statistically significant.
Results
Out of the Anti-HCV antibody positive 53 patients who came to the Department of Microbiology, Medical college and hospital, Kolkata for detection of active Hepatitis C virus infection by Polymerase chain reaction method, 49 patients were both ELISA and Immune chromatographic test positive for Anti-HCV antibody and 4 patients were only ELISA test positive for Anti-HCV antibody. Out of the
49 patients who were both ELISA and ICT positive for Anti-HCV antibody, 29 patients were having active Hepatitis C virus infection which includes 5 patients who were previous HCV PCR positive but became negative after treatment and 20 patients were HCV PCR negative. Also the 4 patients who were ELISA test positive for Anti- HCV antibody were Hepatitis C virus PCR negative.
| PCR Positive | PCR Negative | ||||||
|---|---|---|---|---|---|---|---|
| ELISA and ICT positive | 29 | 20 | |||||
| Only ELISA positive | Nil | 4 | |||||
| Total | 29 | 24 |
Table 1: Distribution of Anti-HCV antibody patients by ELISA and ICT method with regards to HCV PCR testing.
Age-wise distribution table shows that the prevalence of Hepatitis C infection was more in the 11-20 years age group (17 patients- 12 newly diagnosed and 5 previously treated for HCV) followed by 0-10 year’s age group which corresponds to increased demand of blood transfusion in splenomegaly patients.
| 0-10 yrs | 11-20 yrs | 21-30 yrs | 31-40 yrs | 41-50 yrs | >50 yrs | Total number of cases | |||||||||||||||||
|---|---|---|---|---|---|---|---|---|---|---|---|---|---|---|---|---|---|---|---|---|---|---|---|
| PCR + | 6 | 17* | Nil | Nil | 4 | 2 | 29 | ||||||||||||||||
| PCR - | 9 | 10 | Nil | Nil | 1 | 4 | 24 | ||||||||||||||||
| Total number of patients | 15 | 27 | Nil | Nil | 5 | 6 | 53 |
Table 2: Age-wise distribution. *Out of 17 patients belonging in the age group 11-20 yrs who were HCV PCR positive, 5 patients we
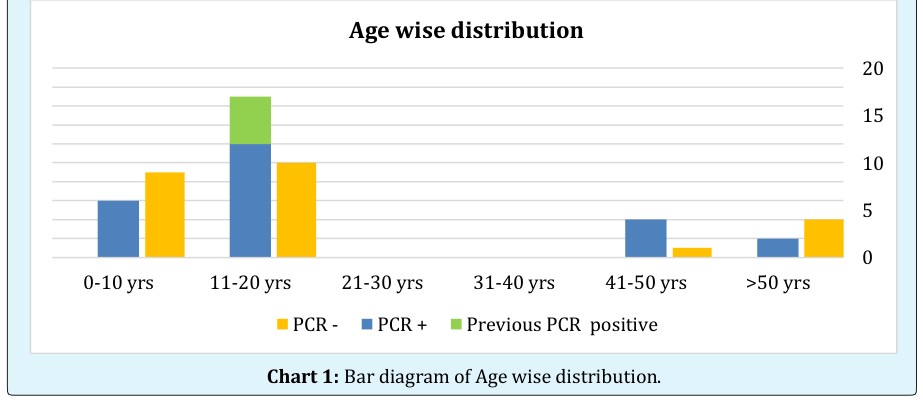
Chart 1: Bar diagram of Age wise distribution.
- Table 3 shows the distribution of Hepatitis C infection among patients with or without jaundice. Hepatitis C virus RNA was detected in only 18 patients with jaundice (14 newly diagnosed and 4 previous HCV PCR positive) and 11 patients (10 newly diagnosed and 1 previous HCV
- PCR positive) who did not have jaundice.
- It was noted that among the 29 patients who were tested positive for Hepatitis C virus, few had the clinical findings like hepatomegaly (10 patients), arthritis (10 patients), vasculitis (3 patients), ascites (5 patients), and splenomegaly (7 patients) and splenectomised (7 patients). No significant co-relation was found between clinical presentations and HCV viral load.
- Total number
- Hepatomegaly
- Hepatomegaly
- Splenomegaly
- Splenomegaly
- Total number
- Total number
- Total number
- Vasculitis
- Vasculitis
- Arthritis
- Arthritis present of cases of cases of cases present
- Ascites
- Ascites of cases present present present
- Absent absent absent absent absent
- PCR + 7+3* 17+ 2*
- 29
- 7 + 3* 17+ 2*
- 29
- 2 + 1* 22+ 4*
- 29
- 3 + 2* 21+ 3*
- 29
- 5 + 2*
- 15
- 4 + 3*
- 29
- PCR -
- 5
- 19
- 24
- 3
- 21
- 24
- 1
- 23
- 24
- 3
- 21
- 24
- 6
- 18
- 0
- 24
Table 3: Distribution of PCR results based on Clinical findings.
| Jaundice present | Jaundice absent | Total number of cases | ||||||
|---|---|---|---|---|---|---|---|---|
| PCR + | 18 | 11 | 29 | |||||
| PCR - | 15 | 9 | 24 | |||||
| Total number of cases | 33 | 20 | 53 |
Table 4: Distribution of PCR results based on Clinical findings. The * marked number of patients were previous HCV positive patie
Splenectomised
Total number
of cases Table 4: Distribution of PCR results based on Clinical findings. The * marked number of patients were previous HCV positive patients who became HCV PCR negative after treatment.
| Total | Conjugated Bilirubin | Unconjugated | AST | ALT | ALP | Prothrombin | APTT | ||||||||||||||||||
|---|---|---|---|---|---|---|---|---|---|---|---|---|---|---|---|---|---|---|---|---|---|---|---|---|---|
| Bilirubin | Bilirubin | Time | |||||||||||||||||||||||
| PCR + | PCR - | PCR + | PCR - | PCR + | PCR - | PCR + | PCR - | PCR P + | CR - | PCR + | PCR - | PCR + | PCR - | PCR + | PCR - | ||||||||||
| 19 + 5 | * 12 | 20 + 5* | 11 | 20 + 5* | 11 | 18 + 4* | 10 | 15 + 4* | 6 | 14 + 3* | 10 | 4 + 2* | 5 | 2 + 1* | 3 | ||||||||||
| Nil | Nil | Nil | Nil | Nil | Nil | Nil | Nil | Nil | Nil | Nil | Nil | Nil | Nil | Nil | 1 | ||||||||||
| Norma | l 3 | 9 | 2 | 10 | 3 | 9 | 3 + 1* | 10 | 6 + 1 1* | 54 | 7 + 2* | 10 | 1 | 2 | 1* | 1 | |||||||||
| NA | 2 | 3 | 2 | 3 | 2 | 3 | 3 | 4 | 3 | 4 | 3 | 4 | 19 + 3* | 17 | 22 + 3* | 19 | |||||||||
| Total no. of cases | 29 | 24 | 29 | 24 | 30 | 23 | 29 | 24 | 29 | 24 | 29 | 24 | 29 | 24 | 29 | 24 |
Table 5: Distribution of PCR results based on Investigations. The * marked number of patients were previous HCV positive patients
| Total Protein (6-8g/dl) | Albumin (3.5-5 g/dl) | A:G (1.2:1 to 2.5:1) | Urea (15-40 mg/dl) | Creatinine | RBS | Thyroid profile | ||||||||||||||
|---|---|---|---|---|---|---|---|---|---|---|---|---|---|---|---|---|---|---|---|---|
| (0.68-1.36 | ||||||||||||||||||||
| mg/dl) | ||||||||||||||||||||
| PCR + | PCR - | PCR + | PCR - | PCR + | PCR - | PCR + | PCR - | PCR + | PCR - | PCR + | PCR - | PCR + | PCR - | |||||||
| 6 + 2* | Nil | 2 | Nil | Nil | Nil | 2 | Nil | Nil | Nil | Nil | Nil | Hypothyroid | 5 + 3* | 1 | ||||||
| Nil | 1 | Nil | 1 | 2 | 5 | Nil | Nil | Nil | Nil | Nil | Nil | Hyperthyroid | Nil | Nil | ||||||
| Normal | 13 + 3* | 17 | 20 + 5* | 16 | 17 + 5* | 13 | 19 + 5* | 18 | 21 + 5* | 18 | 12 + 5* | 13 | Normal | 5 + 2* | 11 | |||||
| NA | 5 | 6 | 4 | 5 | 5 | 6 | 3 | 6 | 3 | 6 | 12 | 11 | NA | 14 | 12 | |||||
| Total no. of cases | 29 | 24 | 31 | 22 | 29 | 24 | 24 | 29 | 29 | 24 | 29 | 24 | 29 | 24 |
Table 6: Distribution of PCR results based on Investigations. The * marked number of patients were previous HCV positive patients
a) Standard Error of Mean of PCR positive and Negative Patients based on Investigations
of PCR Positive and Negative Patients based on Investigations - Cont.
Chart 2: Standard Error of Mean of PCR positive and Negative results based on Investigations.
later, were successfully treated with Sofosbuvir plus Ledipasvir. Among the treated patients, 3 patients reported genotype 3 and 2 patients reported genotype 1 and were treated accordingly.
- S. no.
- Pretreatment viral load
- Genotype
- Treatment
- Duration Viral Load 3 months after therapy
- 1
- 22,07,000IU/ml
- 1
- Sofosbuvir plus Ledipasvir
- 3 mths
- HCV Not Detected
- 2
- 19,74,883 IU/ml
- Initially and 61,65,950IU/ml after 4 years
- 1
- Sofosbuvir plus Ledipasvir
- 3 mths
- HCV Not Detected
- 3
- 54,954 IU/ml
- 3
- Sofosbuvir plus Daclatasvir
- 3 mths
- HCV Not Detected
- 4
- 27,68,488 IU/ml
- 3
- Sofosbuvir plus Daclatasvir
- 3 mths
- HCV Not Detected
- 5
- 2,630 IU/ml
- 3
- Sofosbuvir plus Daclatasvir
- 3 mths
- HCV Not Detected
Table 7: Patient on Anti-HCV treatment- New and Old viral loads.
Discussion
Out of the 53 Anti-HCV antibody positive patients who came to the Department of Microbiology, Medical College and Hospital, Kolkata, and who consented for PCR testing, 92.45% were Anti-HCV reactive by both ELISA and Immuno chromatographic method whereas rest were reactive only by ELISA method.
The risk factors of HCV transmission include blood and blood product transfusion, unsafe sexual practices, Intravenous drug abuse and unsafe injection practices, tattooing and acupuncture [5]. In our study, blood transfusion was found to be the most common mode of HCV transmission.
Age-wise highest prevalence of antibody against Hepatitis C virus was found in the age group 11-20 years with significant number of Hepatitis C virus PCR positive cases owing to higher number of Thalassemia patients in this age group. Older age groups who harboured the infection gave history of blood transfusion following surgery, in blood camps (needle prick / use of faulty needle), alcohol abuse and IV drug abuse [5, 6, 7, 8].
HCV RNA could be detected in only 42.42% patients with jaundice and the mean viral load is 7,89,666 IU/ml in this group. In the non-jaundiced patients HCV RNA could be detected in 50% patients and the mean viral load is 4,04,63,920 IU/ml which is significantly higher than in the jaundiced patients. This may signify immune basis of jaundice which at least partially controls the infection and lowers viral load than those patients who cannot mount immune response with higher viral load.
| No. of Patients | RNA detected | Mean viral load | Standard deviation of viral load | |||||||||||
|---|---|---|---|---|---|---|---|---|---|---|---|---|---|---|
| Jaundice | 33 | 14(42.42%) | 789666.7 | 1724383 | ||||||||||
| Non Jaundice | 20 | 10(50%) | 40463920 | 125669956.1 |
Table 8: HCV transmission.
Many have speculated that the jaundice may be associated with a more robust immune Th1 lymphocyte and cytokine response to the HCV. It is also thought that the cellular immune response contributes to control of the virus and potentially to liver inflammation in chronic disease [9, 10, 11, 12].
No significant co-relation was noted between clinical findings such as hepatomegaly, arthritis, vasculitis etc with HCV viral load in contrast to other studies [13, 14, 15, 16, 17]. Patients who have received blood transfusions may have hepatomegaly or chronic hepatitis due to iron overload [13, 14]. Presence of Splenomegaly may be explained by excessive destruction of RBCs [15].
manifestations such as arthritis, glomerulonephritis, HCV related systemic vasculitis features like kerato conjunctivitis sicca, lichen planus and essential mixed cryoglobulinemia. These are mainly due to HCV and Anti- HCV immune complex deposition [16, 17, 18].
Hepatitis C infectivity showed significant co-relation with liver parameters like AST, ALT, C. bilirubin and U. bilirubin. There was no co-relation with clotting time markers. Similar findings were also noted in other studies [19, 20, 21, 22]. It should be noted that main source of Alkaline Phosphatase is the liver, but some amount of it is also secreted by the bones, intestines, pancreas and the kidneys. Hence P value was not calculated for ALP.
The following are the tables illustrating significant co- relation between few laboratory findings with HCV viral load.
The chi-square statistic is 6.3977. The p-value is .011427. The result is significant at p <.05.
PCR Positive PCR Negative Total AST Elevated 22 (18.09) 10 (13.91) 32 AST Not Elevated 4 (7.91) 10 (6.09) 14 26 20 46 The chi-square statistic is 8.4546. The p-value is .003641. The result is significant at p <.05.
PCR Positive PCR Negative Total ALT Elevated 19 (14.13) 6 (10.87) 25
| ALT Not Elevated | 7 (11.87) | 14 (9.13) | 21 | ||||||||
|---|---|---|---|---|---|---|---|---|---|---|---|
| 26 | 20 | 46 | |||||||||
| The chi-square statistic is 6.075. The p-value is .013711. The result is significant at p< .05. | |||||||||||
| PCR positive | PCR negative | Totals | |||||||||
| Thyroid profile not deranged | 7 (10.00) | 11(8.00) | 18 | ||||||||
| Thyroid profile deranged | 8 (5.00) | 1 (4.00) | 9 | ||||||||
| Total | 15 | 12 | 27 |
Table 9: Significant co-relation between few laboratory findings with HCV viral load.
Iron overload due to blood transfusions may result in endocrine abnormalities like hypothyroidism, hypogonadism etc. increased blood glucose levels [24, 25, 26]. Platelet counts decrease in chronic liver diseases due to decreased Thrombopoietin production and excessive destruction by the enlarged spleen [27]. Our study also co-related with other findings such as anaemia and hypothyroidism, however there was no evidence of increased blood glucose levels and decreased platelet counts.
Five patients have completed treatment with Sofosbuvir combination therapy. Among the treated patients, 3 patients reported genotype 3 and 2 patients reported genotype 1 and were treated accordingly.
Globally, genotype 1 and 3 are the most frequently reported [28, 29, 30]. In India, genotype 3 is more prevalent followed by genotype 1 [31, 32]. The patients were treated as per the new treatment guidelines of Hepatitis C virus [33].
Conclusion
HCV PCR is extremely useful in establishing the diagnosis of acute HCV infection, since RNA is detectable as early as 1 week after exposure via needle-stick or blood transfusion and at least 4-6 weeks prior to seroconversion as demonstrated in a number of transmission settings. The diagnosis of HCV infection must be established with antibody screening followed by PCR for HCV RNA for confirmation as well as for follow-up of patients on treatment. Viral load assessment at baseline is very important for monitering therapy.
Proper clinical evaluation to look for hepatic as well as non-hepatic manifestations as protocol must be
References
-
Knipe DM, Howley PM, Lamb RA, Griffin DE, Martin MA (2014) Fields Virology. Clinical Infectious Diseases 59(4): 991-1125.
-
Te HS, Jensen DM (2010) Epidemiology of hepatitis B and C virus: a global overview. Clinics in Liver Disease 14(1): 1-21.
-
Dhiman RK, Satsangi S, Grover GS, Puri P (2016) Tackling the Hepatitis C Disease Burden in Punjab, India. J Clin Exp Hepatol 6(3): 224-232.
-
Goel A, Seguy N, Aggarwal R (2019) Burden of hepatitis C virus infection in India: A systematic review and meta-analysis. J Gastroenterol Hepatol 34(2): 321-329.
-
Namasopo SO, Ndugwa C, Tumwine JK (2013) Hepatitis C and blood transfusion among children attending the Sickle Cell Clinic at Mulago Hospital, Uganda. Afr Health Sc 13(2): 255-260.
-
Jhaveri R (2011) Diagnosis and management of hepatitis C virus-infected children. Pediatr Infect Dis J 30(11): 983-985.
-
Ataei B, Hashemipour M, Kassaian N, Hassannejad R, Nokhodian R, et al. (2013) Prevalence of Anti HCV Infection in Patients with Beta-Thalassemia in Isfahan-Iran. Int J Prev Med 3(1): 118-123.
-
El Shabrawi MH, Kamal NM (2013) Burden of pediatric hepatitis C World J Gastroenterol 19(44): 7880-7888.
-
Gruner NH, Gerlach TJ, Jung MC, Diepolder HM, Schirren CA, et al. (2000) Association of hepatitis C virus-specific CD8+ T cells with viral clearance in acute hepatitis C. J Infect Dis 181(5): 1528-1536.
-
Lechner F, Wong DK, Dunbar PR, Chapman R, Chung RT, et al. (2000) Analysis of successful immune responses in persons infected with hepatitis C virus. J Exp Med 191(9): 1499-512.
-
Thomas DL, Astemborski J, Rai RM, Anania FA, Schaeffer M, et al. (2000) The natural history of hepatitis C virus infection: host, viral, and environmental factors. Jama 284(4): 450-456.
-
Valiante N, D Andrea A, Crotta S, Nuti S, Wack A, et al. (2000) Life, activation and death of intra-hepatic lymphocytes in chronic viral hepatitis. Immunol Rev 174: 77-89.
-
Papakonstantinou O, Maris TG, Kostaridou S, Ladis V, Vasiliadou A, et al. (2005) Abdominal lymphadenopathy in beta-thalassemia: MRI features and correlation with liver iron overload and posttransfusion chronic hepatitis C. AJR Am J Roentgenol 185(1): 219-224.
-
Vezozzo DC, Mendes Correa MC, Cunha Silva M, Alvarado Mora MV, França JÍ, (2013) Strong correlation by ultrasonography of hepatomegaly and the presence of co-infection in HIV/HCV cirrhotic patients. Braz J Infect DisMar 17(2): 150-155.
-
Singh RK (2012) The enlarged spleen-a blood bank. Tropical gastroenterology Journal 33(1): 1-3.
-
Jay HHoofnagle (1997) Hepatitis C: The Clinical Spectrum of Disease. NIH Consensus Development conference on Management of Hepatitis C 26(3S1): S15-S20.
-
Alberti A, Morsica G, Chemello L, Cavalletto D, Noventa F, et al. (1992) Hepatitis C viraemia and liver disease in symptom-free individuals with anti-HCV. Lancet 340: 697-698.
-
Johnson RJ, Gretch DR, Yamabe H, Jaime H, Carlos E, et al. (1993) Membranoproliferative glomerulonephritis associated with hepatitis C virus infection. N Engl J Med 328: 465-470.
-
Zechini B, Pasquazzi C, Aceti A (2004) Correlation of serum aminotransferases with HCV RNA levels and histological findings in patients with chronic hepatitis C: the role of serum aspartate transaminase in the evaluation of disease progression. Eur J Gastroenterol Hepato 16(9): 891-896.
-
Luo JC, Hwang SJ, Lai CR, Lu CL, Li CP, et al. (1998) Relationships between serum aminotransferase levels, liver histologies and virological status in patients with chronic hepatitis C in Taiwan. J Gastroenterol Hepatol 13(7): 685-690.
-
Kim WR, Flamm SL, Bisceglie AM, Bodenheimer HC (2008) Serum activity of alanine aminotransferase (ALT) as an indicator of health and disease. Hepatology Journal 47(4): 1363-1370.
-
Shahid M, Idrees M, Nasir B, Raja AJ, Raza SM, et al. (2014) Correlation of biochemical markers and HCV RNA titers with fibrosis stages and grades in chronic HCV-3a patients. Eur J Gastroenterol Hepatol 26(7): 788-794.
-
Gupta E, Bajpai M, Choudhary A (2014) Hepatitis C virus: Screening, diagnosis, and interpretation of laboratory assays. Asian J Transfus Sci 8(1): 19-25.
-
Saka N, Sükür M, Bundak R, Anak S, Neyzi O, et al. (1995) Growth and puberty in thalassemia major. J Pediatr Endocrinol Metab 8(3): 181-186.
-
Vullo C, De Sanctis V, Katz M, Wonke B, Hoffbrand AV, et al. (1990) Endocrine abnormalities in thalassemia. Ann N Y Acad Sci 612: 293-310.
-
Levinthal GN, Tavil AS (1999) Liver Disease and Diabetes Mellitus. J Clin Diabetes 17(2).
-
Kurokawa T, Ohkohchi N (2017) Platelets in liver disease, cancer and regeneration. World J Gastroenterol 23(18): 3228-3239.
-
Messina JP, Humphreys I, Flaxman A, Brown A, Cooke GS, et al. (2015) Global distribution and prevalence of hepatitis C virus genotypes. Hepatology J 61(1): 77- 87.
-
Petruzziello A, Marigliano S, Loquercio G, Cozzolino A, Cacciapuoti C (2016) Global epidemiology of hepatitis C virus infection: An up-date of the distribution and circulation of hepatitis C virus genotypes. World J Gastroenterol 22(34): 7824-7840.
-
Gower E, Estes C, Blach S, Razavi Shearer K, Razavi H (2014) Global epidemiology and genotype distribution of the hepatitis C virus infection. J Hepatol 61(S1): 45-57.
-
Hissar SS, Goyal A, Kumar M, Pandey C, Suneetha PV, et al. (2006) Hepatitis C virus genotype 3 predominates in North and Central India and is associated with significant histopathologic liver disease. J Med Virol 78(4): 452-458.
-
Raghuraman S, Shaji RV, Sridharan G, Radhakrishnan S, Chandy G, et al. (2003) Distribution of the different genotypes of HCV among patients attending a tertiary care hospital in south India. J Clin Virol 26(1): 61-69.
-
Shah H, Bilodeau M, Burak KW, Cooper C, Klein M, et al. (2018) The management of chronic hepatitis C: 2018 guideline update from the Canadian Association for the Study of the Liver. Canadian Medical Association Journal 190(22): 677-687.
- hMPV: Is It Another Covid-19 Like Situation?
- Streptomyces: Sources of Novel Discoveries in Antibiotic Research to Combat Antimicrobial Resistance
- A Review of Mosquitoes (Diptera: Culicidae) and Their Biodiversity, Medical and Veterinary Importance
- Past and Current Immunotherapy in Cancer
- Hematological Cancer and Viral Infection
- The Growing Threat of Antimicrobial Resistance in India: Challenges and Solutions