Pianura Padana Geomorphology, Climate Condition and Diffusion of COVID -19 Hypotesys of Work
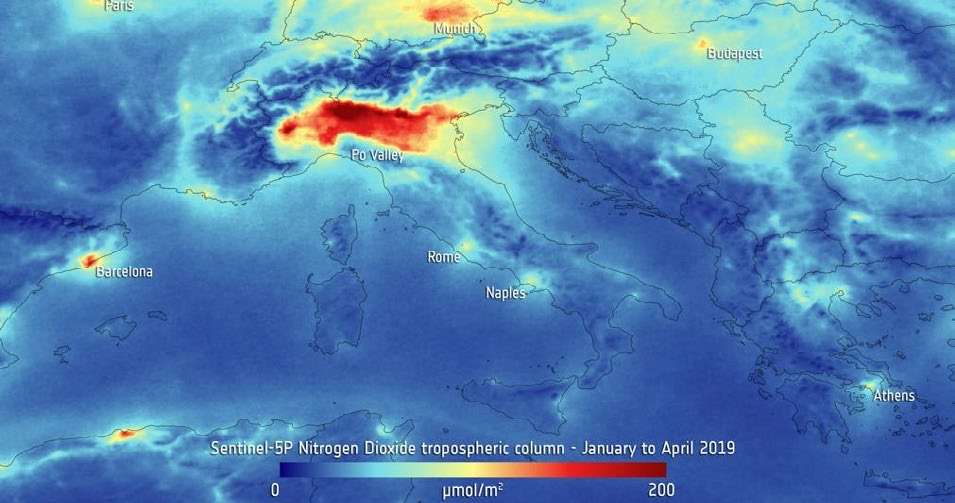
In recent study was verified the statistical hypothesis of diffusion of COVID 19 related some relevant high way of itlay (especially north regions). The geomorphological characteristic of PIANURA PADANA, whit at north closed be ALPI mountain and in south by APPENIMI MOUNTAINS have created since ancient time particular climate condition. If we observe diffusion of Covid 19 in italy at today date is possible to verify a sort of different velocity in diffusion between north region vs the other. There are relationship between this “closed environment “and diffusion of some relevant virus? Pianura padana is famous for its kind of climate with lots of fog, but also for air pollution as reported by EPHA and other organization.
Introduction
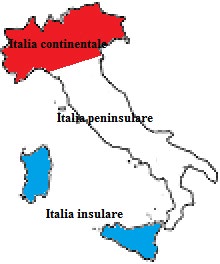
It seem that Italian diffusion of COVID 19 depend be some travelers that comes from Wuhan and other region, but it is interesting to notice that the strange diffusion of virus in north Italy not related with the fact that Chinese from this region not arrive in south cities of Italy using other European airport. Starting from this fact we analyze, with an observational approach (visual methods) some figure related PIANURA PADATA geomorphografic condition and relate climate condition and a recent study the verify as hypothesis of work diffusion of virus according great north high way. Italy is also a PENISULA with high development north south. From 35 grades latitude south (Lampedusa isle) to 47 grades latitudes north (ALPI AURINE).
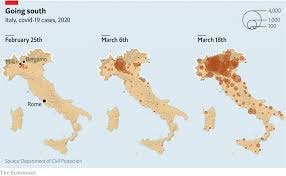
It seems that there is I Italy 2 different velocity in diffusion: with north very fast vs south more slow. Can be related to the famous PIANURA PADANA climate condition and air pollution? As industrial area?
All this must be related to the lockdown Italian measure in March-April 2020, and the red zone of the first phases of virus diffusion in north of Italy.
Material and Methods
Whit an observational approach observing some figure related to the topics of this work and some relevant literature a global conclusion is produced to submit to researcher new research topics.
From literature and on line resource:
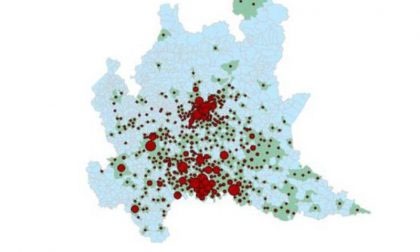
According to Il coronavirus ha viaggiato in autostrada? [1].
An hypotesys of work is related some characteristic of Italian relevant way of travel communication. “La diffusione è maggiore vicino ai grandi nodi autostradali»
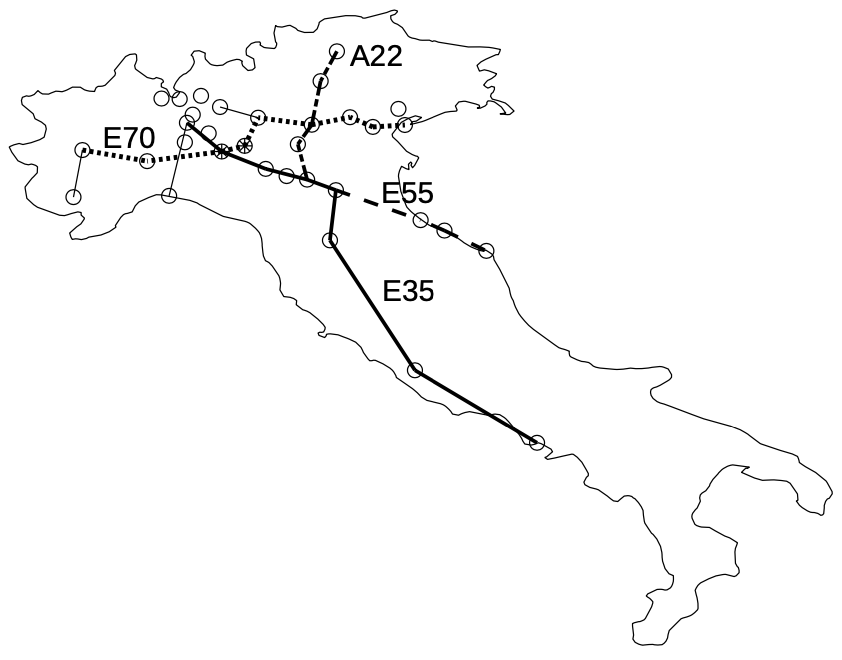
And the diffusion of coronavirus seems to follow great travel communication pathway.
North Italy is a real industrial area high interconnected more than south region.
Connected with other part of Italy but also with other world region.
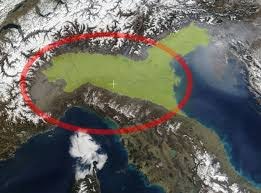
It is a fact that today some north Italian regions are most involved in virus’s diffusion. Other fact is that in this region in north there is ALPI MOUNTAIN and in south part there are APPENNINI MOUNTAINS that create a particular climate condition: PIANURA PADANA. Other fact is that in this AREA there are great level of air pollution as easily see in many scientific publication.
The mortalit- letality rate it is variable in all italia region but Lombardia presented about 17,9% (in 7 april 2020).
While medium data in Italy is 12,5%, but if escluded lombardia this numer is 9%.
But this data depens on the real number of infected people (this data present some problems to be correctly detected related to the laboratory diagnostic).
Results
As reported in SEBASTIANI work it is interesting to observe that APPENIMI MOUNTAIN seem to be a Kind of natural limit to the diffusion of COVID 19 in high rate (until today). These not mean that the diffusion not will go in south of Italy: now various cases are present but what Relevant is the velocity in this process. In various publication relationship related diffusion of some relevant virus and air pollution are showed and the same the influence of latitude and humidity rate. In recent POSITION PAPER: “Relazione circa l’effetto dell’inquinamento da particolato atmosferico e la diffusione di virus nella popolazione” univ. BARI, BOLOGNA e SIMA[2].
“Si evidenzia come la specificità della velocità di incremento dei casi di contagio che ha interessato in particolare alcune zone del Nord Italia potrebbe essere legata alle condizioni di inquinamento da particolato atmosferico che ha esercitato un’azione di carrier di boost. Come già riportato in casi precedenti di elevata diffusione di infezione virale in relazione ad elevati livelli di contaminazione da particolato atmosferico, si suggerisce di tenere conto di questo contributo sollecitando misure restrittive di contenimento dell’inquinamento.” [3].
According Protezione Civile Italy 12 April 2020
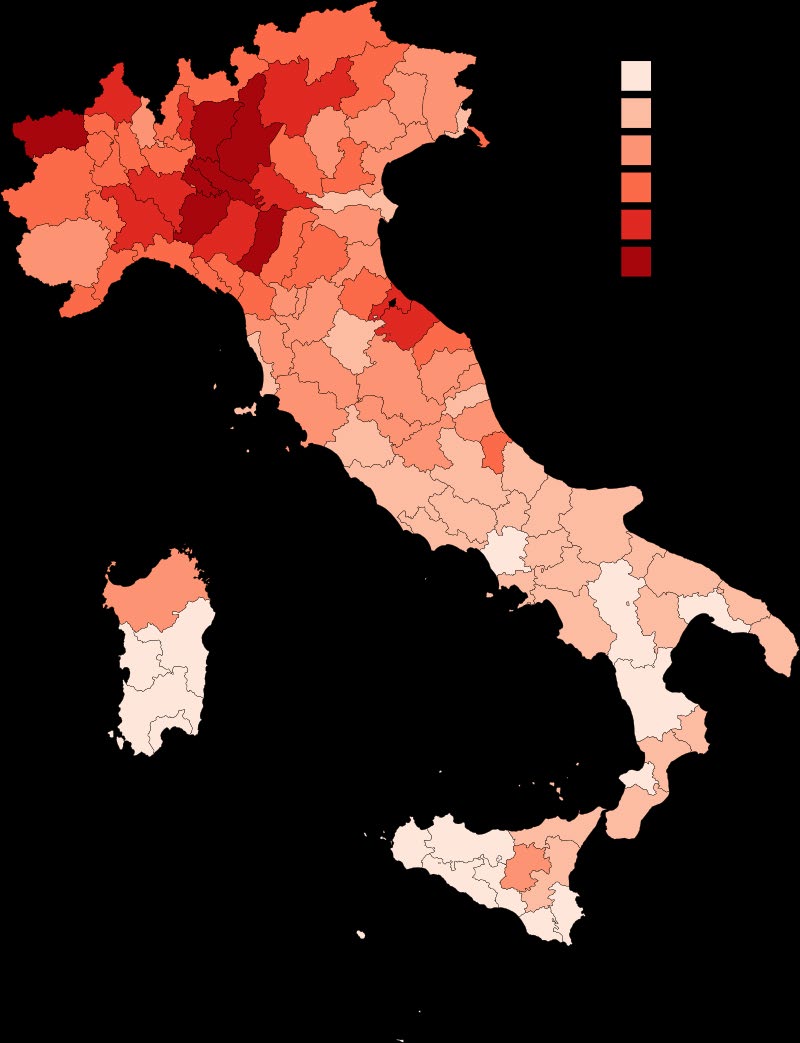
There are currently 31,265 in Lombardy, 13,672 in Emilia-Romagna, 12,505 in Piedmont, 10,729 in Veneto, 6,162 in Tuscany, 3,817 in Lazio, 3,333 in Liguria, 3,114 in the Marche, 3,057 in Campania, 2,452 in Puglia, 2,082 in Puglia. Autonomous Province of Trento, 2,030 in Sicily, 1,742 in Abruzzo, 1,326 in Friuli Venezia Giulia, 1,515 in the Autonomous Province of Bolzano, 903 in Sardinia, 795 in Calabria, 687 in Umbria, 588 in Valle d’Aosta, 277 in Basilicata and 202 in Molise. “ According article published in https://www.lastampa. it/blogs/2017/11/07/news/inquinamento-atmosferico- perche-l-aria-della-pianura-padana-e-tra-le-peggiori-d- europa-1.37181946 [4] “climate Network Inquinamento atmosferico: perché l’aria della Pianura Padana è tra le peggiori d’Europa? La relazione è semplice: più polveri, più malattie. Ogni anno questa realtà si rende evidente, visibile all’occhio e percepibile dai polmoni Inquinamento atmosferico: perché l’aria della Pianura Padana è tra le peggiori d’Europa?
We don’t want to give up the car We can’t give up heating. We cannot give up agriculture, but we are giving up our health.
The relationship is simple: more dust, more disease. Every year this reality becomes evident, visible to the eye and perceptible from the lungs. According to the European Environment Agency (EEA), air pollution today causes 461 thousand premature deaths a year only in Europe, 20 times more than the victims of road accidents. For those who live in the Po Valley, one of the most polluted areas of the continent, it seems an inevitable fate.
But is pollution increasing? What are the main causes? How can we defend ourselves? The Epson Meteo Center answers these questions, engaging in the path towards a quality air. The data is surprising: the main sources of PM10 are extremely diverse, from wood-fired pizzas to bad agricultural practices. The analysis of the President of the Italian Climate Network Serena Giacomin. Is Pollution Really Increasing More and More?
Take Lombardy for example, well representative of the overall concentrations of the Po Valley and whose pollution data (in particular of the fine dust, PM10 we will focus on) are widely available on the ARPA site of the Region. Despite the fluctuations in PM concentrations also caused by weather conditions, the data demonstrate a trend towards improvement in the last decades. The air remains too polluted, but pollution is decreasing. The concentrations measured today are also of orders of magnitude lower than those recorded in the 70s, 80s and 90s of the last century. An admirable effort for the Po Valley, but in any case not sufficient to fall within the limits of the law (Legislative Decree 155/2010 which transposed the EU directive on air quality) abundantly exceeded all the years.
What are the Weather Conditions that Plug the ‘Po Valley
“The orographic and meteorological factors contribute significantly to the high concentrations of atmospheric pollutants that make Val Padana one of the most polluting areas in Europe, despite the emissions being comparable to those of other developed areas” - confirms the meteorologist of the Epson Meteo Center Flavio Galbiati - “this is because the Po Valley basin is surrounded by the Alpine mountain range which influences the wind regime, the intensity of which is generally very weak. Another important factor is the high frequency of meteorological situations characterized by atmospheric stability. These conditions, typical of the winter semester in case of high pressure, originate from the meteorological phenomenon of thermal inversion. In practice, in the atmosphere the temperature does not decrease going up in altitude, as one would expect, but at a height of 800/1000 meters there is a higher temperature than that of the lower layer. This changes the local air circulation: the colder one of the lower layers, being denser and heavier, cannot rise vertically beyond the inversion level. A true ‘plug’ is therefore created which prevents the exchange of air, trapping pollutants near the ground, where their concentration, day after day, will only increase “.
Finally it is interesting to observe that in 8 of March
following some news about a RED ZONE in lombardia by institution produced lots of people in the night to go in south region using train. But it is not possible to verify if in this people there was or not positive one to covid 19.
This fact can be a factor to be taken in consideration in the diffusion of virus in south.
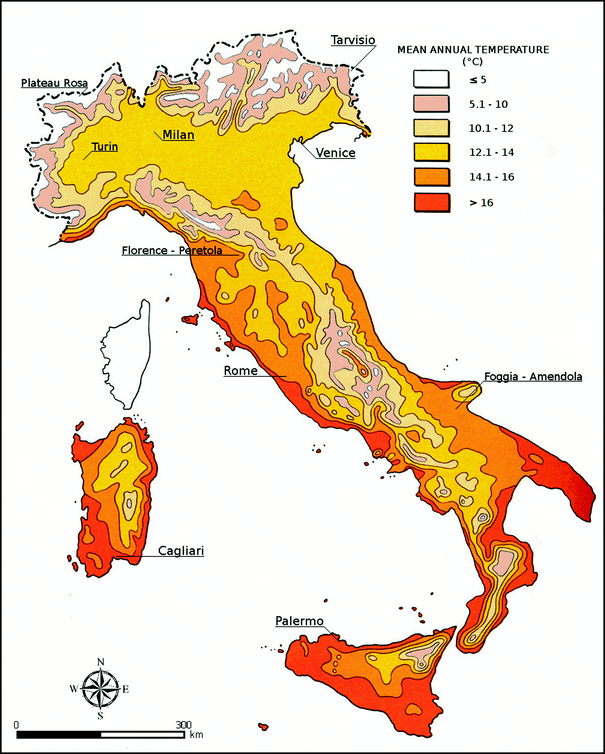
Related climate is possible to verify that, observing fig.8 it seem there are 2 different ZONE in north vs south.
Discussion and Conclusion
As HYPOTESYS of work It is opinion of the authors to verify if the climate condition of PIANURA PADANA and related air pollution level contribute or not in the great diffusion in north of Italy of this severe disease.
A kind of geomorphological environment with specific climate condition and separated by mountains at north and south. The strange velocity in diffusion in north vs south of Italy need new research: observing letality rate of lombardia 17,9 % vs 9 % of the rest of Italy it seem that could be 2 different AREA in Italy related this virus diffusion.
Latitude, climate, air pollution and what other factor acts? Only The lockdown strategies produced this? And the role played by high way diffusion (trucks and other road transport of goods) in cross APPENINI MOUTNAINS is a fact to be taked in consideration? The relationship between air pollution and respiratory disease, acute and chronic are a scientific Proof of relationship.
The authors submit to the researcher the need t verify this HYPOTESYS OF WORK.
Clarifications: Some part of this work is in Italian language in order to follow the original author meaning.
This work is produced without any diagnostic or therapeutic intent, only to produce HYPOTESYS of work to be submitted to the researcher.
All the rules governative and regionals normative, all the measure taken by Italian and World health organization related preventing the diffusion of covid 19 must to be followed and this work not is produced to avoid this .
References
-
Giovanni Sebastiani (2020) Did the coronavirus travel on the highway?
-
Luisetto M, Ahmed Y, Khaled E, Ghulam RM, Farhan A, et al. (2020) Khan5Epidemiology and Diffusion of Some Relevant Virus: Latitude, Air Pollutants and Humidity Role. Hypothesis of Work: COVID 19 Effect on the Air Pollution in Some World Region: What Implications? ECRONICON 9(4): 1.
-
“Report on the effect of air pollution and the spread of viruses in the population” Univ. BARI, BOLOGNA and SIMA.
-
Müller (2020) Buttiglione and the “confusion” of those criticizing the Pope.
- hMPV: Is It Another Covid-19 Like Situation?
- Streptomyces: Sources of Novel Discoveries in Antibiotic Research to Combat Antimicrobial Resistance
- A Review of Mosquitoes (Diptera: Culicidae) and Their Biodiversity, Medical and Veterinary Importance
- Past and Current Immunotherapy in Cancer
- Hematological Cancer and Viral Infection
- The Growing Threat of Antimicrobial Resistance in India: Challenges and Solutions