EBV Serology and Plasma EBV DNA Load as a Combined Tool for Nasopharyngeal Carcinoma (NPC) Diagnosis and Monitoring in Non-Endemic Regions
There is limited information regarding the clinical significance of Epstein-Barr virus (EBV) markers for nasopharyngeal carcinoma (NPC) diagnoses and monitoring in non-endemic areas. Low NPC incidence in non-endemic countries made it difficult to form a representative group of patients for research this issue. Moreover, NPC cases are often characterized into morphologically different tumor types based upon the geographic and ethnic variability. Since viral and serological markers reflect the different biological events accompanying the development of NPC, it is important to compare their clinical value in the context of different disease manifestations. The implementation of such a study in a non-endemic region is of particular interest, allowing the investigation of the potential impact of differences in the genetic and ethnic characteristics of the population, versus those in populations from endemic regions. In present study, we analyzed clinical significance of two EBV markers (serological and molecular) in large group (96 cases) of undifferentiated non-keratinizing carcinoma of nasopharyngeal type (UNPC) Russian patients. It has been shown that IgA/ VCA antibody titers elevated on patient's admission and being valuable markers for primary UNPC diagnosis do not allow to adequately assessing patients’ state after the treatment. In contrast to EBV serology, the plasma EBV DNA load was found to be valuable marker for clinical evaluation of UNPC patient’s state, such as remission and relapse. It was also shown that the concentration of viral DNA correlated with the UNPC patients' overall survival. The proposed study, conducted on UNPC patients from a non-endemic region, for the first time revealed a direct correlation between IgG/IgA antibody titers to EBV virus capsid antigen (VCA) and the levels of plasma EBV DNA load, and the absence of such correlation between plasma EBV DNA burden and serological responses to EBV. It has also been demonstrated that the combined assessment of plasma EBV DNA load and EBV-specific antibody titers provides a reliable approach to UNPC diagnosis, disease monitoring, and therapeutic response assessment.
Introduction
Nasopharyngeal carcinoma (NPC) is diagnosed worldwide, but with different frequencies since the incidence of this tumor is characterized by geographical and ethnic variability [1]. NPC is most common disease in the endemic regions–the southern provinces of China and the countries of Southeast Asia (25–30 cases per 100 000), and also prevalent in the Arabs of North Africa and the indigenous people of Greenland and Alaska. In Russia and the Western European countries, NPC is a rather rare neoplasm, occurring in less than 1 in 100 000 cases (In: “The state of cancer care for the population of Russia in 2017” edited by A.D. Kaprin, V.V. Starinsky, G.V. Petrova, Moscow 2018. Russian Center for Information Technologies and epidemiological research in the field of oncology, Moscow, Russia). The uneven spread of NPC worldwide suggests an influence of different genetic and environmental factors on the development of this pathology [2, 3]. The recent discovery of the Asian Epstein- Barr virus (EBV, Herpesviridae, Lymphocryptovirus, and HHV- 4 ) variants with polymorphisms in the BALF2 and EBER2 gene loci, which are associated with a high risk of NPC, may be attributed to many environmental factors [4, 5]. Whole genome sequencing of EBV DNA from plasma samples of NPC patients and healthy virus carriers revealed the profiles of single nucleotide variants (SNV) of the EBV genome, characteristic of EBV linked to NPCs [6].
NPC cases in endemic regions, as a rule, are characterized by an undifferentiated non-keratinizing variant of the tumor (UNPC), associated with EBV and are found in patients regardless of their geographical origins and ethnicities [7]. In contrast, in non-endemic regions, variants of keratinizing squamous cell carcinoma that are not associated with EBV are predominant [8, 9]. At the same time, in the endemic regions, both the non-keratinizing and keratinizing squamous cell UNPC variants are often associated with the virus [10].
Immunological studies have shown that UNPC is accompanied by high titers of EBV-specific antibodies; the immunoglobulin G (IgG) and in particular immunoglobulin A (IgA) antibody titers against the viral capsid antigen (VCA) can be characteristic for UNPC patients. However, upon further study, it became clear that this serological response could be also detected in patients with some other malignancies and even in healthy individuals, although temporarily and in not high titers. It means that the EBV-specific antibody titers could not be an independent marker of UNPC. However, they are a very useful addition to the traditional diagnostic methods of UNPC [9, 11].
After the detection of EBV in the histological samples and high titers of EBV-specific antibodies in the blood of the UNPC patients a polymerase chain reaction (PCR) was developed to allow a real-time quantitative determination of the concentration of the cell-free EBV DNA in the serum/ plasma samples [12, 13, 14, 15, 16]. Using this method, most of the UNPC patients in the endemic regions were found to have high levels of circulating viral DNA in their blood plasma [17]. In several studies, nonetheless, it was informed, that 15-25% of EBER confirmed UNPC cases had low, undetectable EBV DNA in plasma even in endemic regions [18, 19].
The studies of Lo et al. have shown that the concentration of the viral DNA in the blood plasma of the UNPC patients is a marker of tumor load and can be successfully used for diagnosis, prognosis, and assessment of the effectiveness of therapy [14, 15, 16, 20]. Indeed, further it has been confirmed that the concentration of the plasma EBV DNA in the UNPC patients significantly correlates with the tumor size response to chemo radiation therapy and relapse and remission of the disease [21, 22, 23, 24, 25]. The detection of IgA anti-VCA antibody is associated with an increased risk of UNPC and the patients with high titers of these antibodies usually have a poor prognosis [26, 27, 28]. However, both these markers quite often do not equally and simultaneously respond to the changing state of the tumor processes, and this is most likely due to a different nature of origin.
Since viral and serological markers reflect the different biological events accompanying the development of UNPC, it is undoubtedly important to compare their clinical value in the context of different disease manifestations. Moreover, the implementation of such a study in a non-endemic region is of particular interest, allowing the investigation of the potential impact of differences in the genetic and ethnic characteristics of the population, versus those in populations from endemic regions. Further, our approach may also allow the elucidation of the impact of different environmental factors on non-endemic versus endemic populations, and consequently, on the specific nature of viral replication and immune responses. A limited number of studies conducted in non-endemic regions have generally confirmed the clinical significance of plasma EBV DNA loads in UNPC patients from these regions [29, 30]. However, the combined assessment of both IgA/VCA antibody titers and plasma EBV DNA load, which is of great value for the diagnosis and monitoring of non-endemic UNPC patients, has been analyzed only in a few studies [31, 32]. In this investigation, which is a continuation at a representative level of a previously conducted study in a non-endemic region, Russia, IgA and IgG antibody titers to VCA and plasma viral DNA load were assessed as EBV viral and molecular markers in patients with a confirmed diagnosis of UNPC [33, 34]. It was important to find out whether the clinical significance of the above markers in these patients at different stages of the disease differs from those observed in NPС patients from endemic regions. The data obtained showed that the plasma EBV DNA load in Russian UNPC
patients, as in NPC patients from endemic areas, can be successfully used to track disease manifestations, remission and relapse, and IgA/VCA antibody levels are a useful factor for primary NPC diagnosis. However, the combined use of molecular and viral markers represents the most reliable tool for the diagnosis and monitoring of UNPC in non-endemic regions such as Russia.
Materials and Methods
Patient Information and Sample Collection
Between 2006 and 2018, 140 patients with suspected nasopharyngeal lesions were admitted to the N. N. Blokhin Cancer Research Center, Moscow, Russia (N.N. Blokhin RCRC). In 96 patients, a diagnosis of UNPC (World Health Organization, type III) was proven based on fiber optic nasopharyngoscopy and histological examination carried out according to standard criteria; high, typical for UNPC IgG and IgA antibody titers, detected at patient admission have also been taken into consideration [35, 36, 37]. The ethnic backgrounds of 96 EBV-positive patients were as follows: 47 were representatives of the Slavic population (Christians), 39 were representatives of the North Caucasus (Muslims), and 10 others were Russian citizens but representatives of independent states of the former Soviet Union. The ratio of women to men in patients under investigation was 1:2.8, and the average age was 48.4 years. After UNPC diagnosis, most patients (with the exception of those with a particularly severe form of the disease) were sent, with the recommended treatment, to oncological dispensaries at their place of residence, and for this reason, only some patients enrolled in this study were available for monitoring. As a control group, 30 patients with other tumors of the oral cavity (OTOC) (represented by cancers of the lower jaw and palate, the tongue, floor of the mouth, cheek, and retro molar area, among other sites) and 154 healthy donors from the Blood Transfusion Center of the N.N. Blokhin RCRC, matched by sex and age, were evaluated. EDTA was used to obtain the plasma from blood samples of patients and blood donors. Plasma samples were centrifuged at 1800 g for 10 min, and plasma supernatants were stored at −20 °C until use. The study participants were chosen after a random sampling. Both the cancer patients and healthy individuals gave their consent, and the study was approved by the Ethics Committee at the N. N. Blokhin Russian Cancer Research Center, Moscow, Russia [38, 39].
Serological Tests for Antibodies against EBV
The IgG and IgA antibody titers against the VCA EBV were determined in the blood plasma of the patients and healthy individuals using the so called “gold standard” of serological testing - an indirect method of immunofluorescence. The technical conditions for the implementation of this method and the analysis of the results have been described by us earlier [40]. The antibody titers values were presented as their geometric mean values (GMV).
Quantification of the Plasma EBV DNA
The number of copies of EBV DNA in the blood plasma samples from the patients was determined using PCR which has been described by Lo, et al. [20].
Statistical Analyses
The contents of viral DNA in the blood plasma of the patients belonging to different groups were compared using a nonparametric test (Mann-Whitney U-test). Depending on the type of distribution obtained, the results were presented as a median with an interquartile range (25th and 75th percentiles). The exact P values were calculated and the differences were considered statistically significant at P ≤ 0.05. The statistical significance of the differences in the frequencies of the studied features was assessed using the χ2 test. For the smaller samples, the Fisher’s exact test was calculated. The linear relationship was assessed using the Spearman’s rank correlation coefficient. The Kaplan-Meier curves were plotted for determining overall survival in patients. All calculations were carried out using the statistical package “Statistica” for Windows 6.0, SPSS and GraphPad Prism 8.4.3 (GraphPad Software, San Diego, CA, USA).
Results
The aim of this work was to assess the clinical significance of IgG and IgA antibody titers to VCA EBV and plasma viral DNA concentration in order to understand whether each of these markers (or their combination) can be used as a diagnostic tool for diagnosing and monitoring of UNPC patients in a non-endemic region, Russia, and how these EBV markers differ from those in their meanings from those in NPC patients from endemic regions.
Relationship between the IgG/VCA and IgA/VCA Antibody Titers and Plasma EBV DNA Load
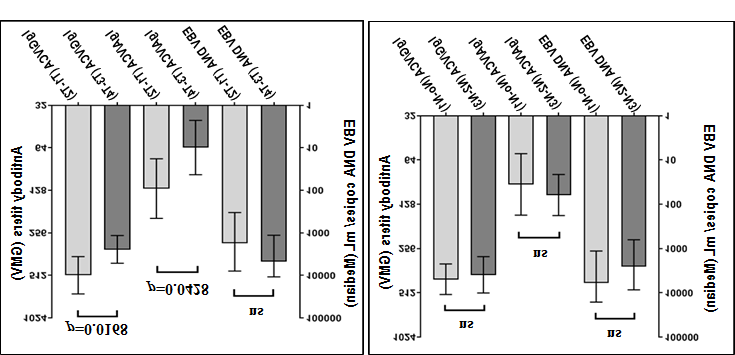
A preliminary study demonstrated that there was a direct correlation between the levels of IgG and IgA antibody titers against VCA and the plasma EBV DNA load in the UNPC patients (Figure 1). In particular, in the group of patients with IgG/VCA antibody titers 1:2560–1:640 the median of the plasma EBV DNA copy numbers/mL was higher than that in the group of patients with IgG/VCA antibody titers 1:320– 1:80 (10 770 and 1816, respectively; p<0.007).
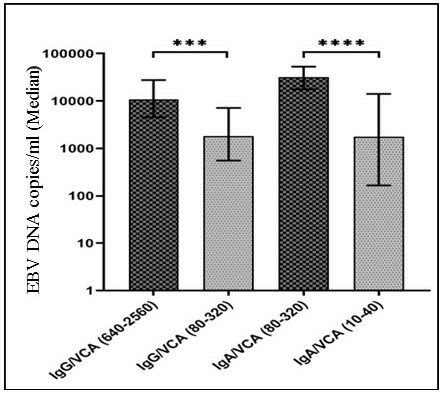
Median of EBV DNA copy numbers/mL for patients with IgG/VCA antibody titers ranging from 640-2560 (n = 33) and 80-320 (n = 62) was 1816 and 10770, respectively (p<0.007).
Median of EBV DNA copy numbers/mL for patients with IgA/VCA antibody titers ranging from 80-320 (n = 31) and 10-40 (n = 25) was 32254 and 1816, respectively (p<0.001).
Similarly, the group of patients with IgA/VCA antibody titers 1:320–1:80 had higher median of plasma viral DNA copy numbers/mL than that in the group of patients with IgA/VCA antibody titers 1:40–1:10 (32 254 and 15 848, respectively; p<0.0001). However, unexpectedly, plasma EBV DNA loads in the UNPC patients didn’t correlate with the IgG/ VCA and IgA/VCA antibody titers (not shown). In the NPC of patients with high (> 10000) and low (<500) EBV DNA copy numbers/mL, the GMVs of IgG/VCA antibodies titers were 425 and 324, respectively with p<0.05, and the GMVs of IgA/ VCA antibodies titers were 106 and 73, respectively (p<0.05).
A study of control groups found both low levels of serological response and concentrations of plasma viral DNA. In particular, the GMVs of IgG/VCA and IgA/VCA antibody titers in OTOC patients (n=30) and blood donors (n=154) were 52 and 33; and 1 and 2, respectively; in other words, these values were an order of magnitude lower than those in UNPC patients (425 for IgG/VCA antibody titers and 324 for IgA/VCA antibody titers). The number of plasma EBV DNA copies/mL in both control groups was negligible and their medians were 1 and 1, respectively (not shown).
Clinical Significance of the EBV Markers in Patients before and After Treatment
To clarify the clinical significance of the EBV markers in Russian UNPC patients, several studies were carried out.
Figure 2 shows the levels of EBV-specific antibody titers and plasma viral DNA loads in patients before and after treatment, regardless of the clinical effects observed.
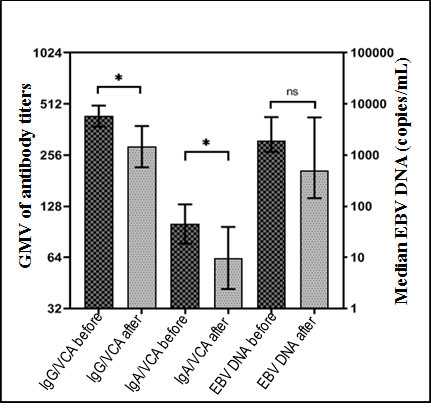
Geometrical mean value (GMV) of IgG/VCA antibody titers in patients before and after treatment were 434 and 287, respectively (p<0.0168); Geometrical mean value (GMV) of IgA/VCA antibody titers in patients before and after treatment were 101 and 64, respectively (_p<_0.0428); Median of the EBV DNA copy numbers/ml in patients before and after treatment were 1895 and 497, respectively (P>0.05).
The GMV of the IgG/VCA antibody titers was high in samples obtained from 96 patients before treatment; while, it was statistically significantly decreased in the samples obtained from 44 patients after the treatment (434 vs. 278, respectively; p< 0.0168). The statistically significant difference in the GMVs of titers, before and after treatment, was also found for the IgA/VCA antibodies (101 vs. 64, respectively; p<0.0428). The Median plasma EBV DNA copy numbers/mL in patients after the treatment in relation to before treatment, also decreased (497 vs. 1895, respectively), but the difference was not statistically significant (p>0.05), probably due to a high plasma EBV DNA load in individual patients who did not respond positively to the therapy.
Relationship between the EBV Markers and Clinical Manifestations of UNPC (Remission, Relapse, and Death)
To elucidate the ability of EBV markers to reflect the various clinical manifestations of UNPC, serological responses to the virus and plasma viral DNA loads in patients with remission and relapse were studied (Figure 3). The analysis showed that IgG/VCA and IgA/VCA antibody titers in UNPC patients in remission and relapse were equally high, with no difference observed between their GMVs (268 and. 239 (p > 0.063) and 70 and 60 (p>0.262), respectively.
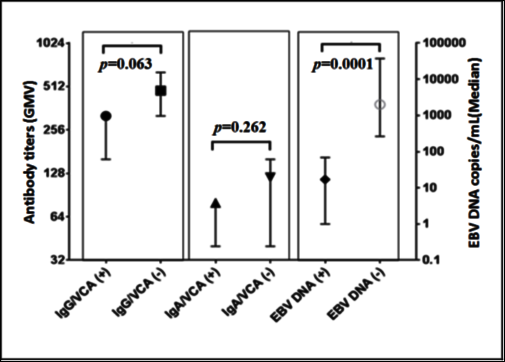
Geometrical mean value (GMV) of IgG/VCA antibody titers in patients with remission (+) and relapse (-) were 269 and 239, respectively (p=0.063); Geometrical mean value (GMV) of IgA/VCA antibody titers in patients with remission (+) and relapse (-) were 70 and 60, respectively (p=0.262); Median of EBV DNA copy numbers/mL in patients with remission (+) and relapse (-) were 17 and 2008, respectively (p=0.0001).
On the contrary, the difference between the Median plasma EBV DNA concentrations/mL in patients in remission (17) and relapse (2008) was highly statistically significant (P < 0.0001). The data obtained demonstrate that the viral DNA copies are associated with clinical events occurring in patients with UNPC, whereas the serological markers are not.
IgA Antibody Titers and Plasma EBV DNA Load/mL in UNPC Patients with Different Manifestation of the Disease
The behavior of EBV markers, during various manifestations of the disease is better observed in individual patients. In four UNPC patients, who went into remission after treatment, (Figure 4), the IgA/VCA antibody titers (a serological marker for UNPC widely used in endemic regions [33, 34]), and the plasma EBV DNA load/mL at different stages of the disease manifestation were compared. The figure shows that at the patient presentations in cases A and C, high plasma EBV DNA concentrations (10 929 and 17 680 copies/mL, respectively) and high IgA/VCA antibody titers (1:80 and 1:320, respectively) were detected. When these patients were reexamined after the course of therapy, the plasma EBV DNA load in both patients decreased sharply; in case A up to 0 copies/mL and in case C up to 444 copies/ mL. However, the IgA/VCA antibody titer in case A remained at the same level (1:80), whereas in case C it decreased slightly to 1:160. During subsequent testing, the number of plasma EBV DNA copies in both patients decreased to almost background values and remained so till the end of 42 months of observation in case A and 68 months in case C. In both patients, the antibody titers decreased significantly to
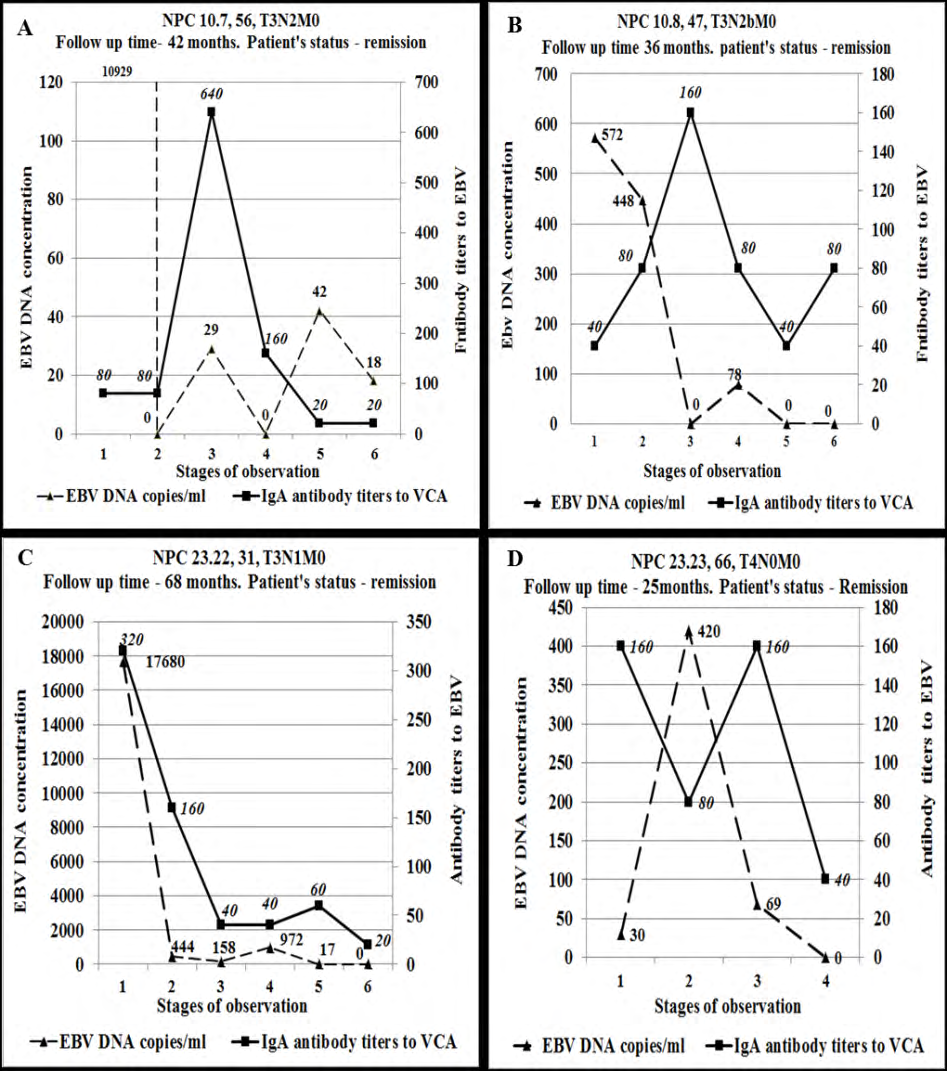
IgG/VCA and IgA/VCA antibody titers (left ordinate scale); for demonstration of plasma EBV DNA load in the number of DNA copies/mL the right ordinate scale was used. Designations on top of the figures are: patient codes, ages, tumor parameters according to the (TNM) classification and the stage of the disease.
1:20. Similar dynamics of plasma EBV DNA load were observed in case B; although at the patient presentation, the concentration of the viral DNA (542 copies/mL) was not as high as in cases A and C. Moreover, the IgA/VCA antibody titer in this patient changed in a paradoxical manner. At the time of patient presentation, the IgG/VCA antibody titer was relatively low (1:40), then with the decrease in the plasma EBV DNA load because of successful therapy, it increased up to 1:80; next, at 0 copies/mL plasma viral DNA load, the antibody titer reached its maximum value to 1:160. Then antibody titer began to decrease (1:40) but by the final stage
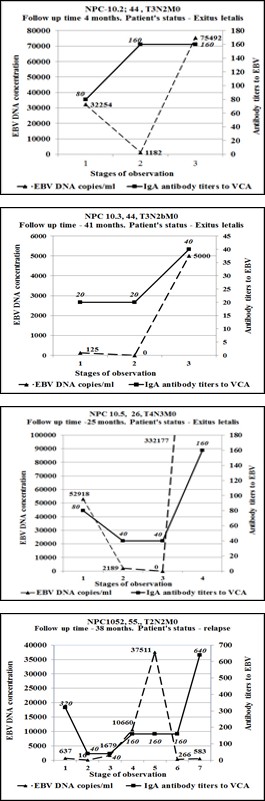
of the patient observation (36 months) the antibody titer again rose to 1:80, while the plasma EBV DNA concentration decreased to 0 copies/mL. In case D, a low plasma EBV DNA concentration (30 copies/mL) and relatively high IgA/ VCA antibody titer (1:160) were detected at the patient presentation. After the course of therapy, an increase in plasma viral DNA load to 420 copies/mL and decrease of the antibody titer to 1:80 were observed. Subsequently, the decrease in the plasma EBV DNA load to 0 copies/mL was accompanied by an increase in the antibody titer (1:160); finally, the antibody titer decreased to 1:40 by the end of 25 months of observation during the patient’s remission state. Importantly, the serologic response to EBV in each case was delayed in relation to viral load and often did not correlate with it; the decrease in antibody titers was uneven and in many cases did not reflect the clinical state of the disease (cases A, C and D).
IgG/VCA and IgA/VCA antibody titers (left ordinate scale); for demonstration of plasma EBV DNA load in the number of DNA copies/mL the right ordinate scale was used. Designations on top of the figures are: patient codes, ages, tumor parameters according to the TNM classification and the stage of the disease.
In an unfavorable course of the disease, such as relapse or death (Figure 5), the plasma EBV DNA load reflected the dynamics of the tumor process more accurately than the IgA/VCA antibody titers. In particular, the concentrations of the circulating viral DNA were high (cases E and G) or low (cases F and H) at patient’s admission; after the first or second course of the therapy, the plasma viral DNA load significantly decreased, and in fact, reached 0 copies/mL in some cases (F and G). In the terminal stage of the disease, the number of plasma EBV DNA copies/mL reached significant values: 5000, 322177, and 75 492 in cases E, F, and G, respectively. At the same time, the titers of the virus-specific antibodies behaved differently. High IgA/VCA antibody titers (1:80 and 1:320) were observed in cases G and H at the patient presentations; after the first or second courses of the therapy, the antibody titers significantly decreased (in both cases to 1:40). Meanwhile, in two other patients (cases E and F) after the first or second courses of the therapy the titers insignificantly increased from 1:80 and 1:20 at the patient presentation to 1:160 and 1:40, respectively. In the terminal stage high plasma EBV DNA loads in E, F, and G cases were also accompanied by rose to relatively high IgA/VCA antibody titers: 1:40, 1:160, and 1:160, respectively.
In the case of a relapse (case H), the plasma EBV DNA load upon admission (637 copies/mL) decreased after two courses of therapy (up to 16 and 40 copies/mL, respectively). However, despite the therapy, the concentration of EBV DNA in plasma significantly increased (up to 10 660 and 37 511 copies/mL), which coincided with the onset of relapse.
Then, after an additional course of therapy, the plasma viral load to the end of 38 months of observation, dropped sharply to relatively low values (to 266 and 583 copies/ml, respectively). The IgA/VCA antibody titer in this patient at the patient presentation was high (1:320); however, it did not increase during the recurrence of the disease, but slightly decreased to 1:160. After the therapy, in contrast to the sharp drop in plasma EBV DNA copies number (from 37 511 to 266 copies/mL), the antibody titer rose sharply to a value of 1:640; this was apparently in response to the release of the viral proteins by a large number of destroyed tumor cells.
Relationship between the EBV Markers and Tumor Manifestation
In UNPC patients, the correlation between EBV markers and disease manifestations according to the classification of malignant tumors (TNM) was also studied. From Figure 6 one could see that the plasma EBV DNA load in the UNPC patients did not correlate with any of the tumor process. Moreover, in patients with N0-N1, the Median of plasma EBV DNA concentration was even higher than that in the patients with N2-N3 (5944 copies/mL vs. 2575 copies/mL), but difference not statistically significant.
Geometrical mean values (GMV) of IgG/VCA antibody titers in patients with T1-T2 (n=37) vs T3-T4 (n=43) were 512 and 336, respectively (P<0.0168);
Geometrical mean values (GMV) of IgA/VCA antibody titers in patients with T1-T2 (n=37) vs T3-T4 (n=43) were 125 and 64, respectively (P<0.0428).
Median of EBV DNA copy numbers/mL in patients with T1-T2 (n-37) vs T3-T4 (n=43) were 1764 and 4729, respectively (p>0.05). Geometrical mean of IgG/VCA antibody titers (GMT) in patients with N0-N1 (n=40) vs L2-L3 (n=40) were 4152 and 387, respectively (P>0.05);
Geometrical mean of IgA/VCA antibody titers (GMT) in patients with N0-N1 (n=40) vs N2-N3 (n=40) were 94 and 11, respectively (P>0.05).
Median of EBV DNA copy numbers/mL in patients with N0-
N1 (n=40) vs N2-N2 (n=40) were 5944 and 2574, respectively (p<0.05).
The antibody response to EBV did not also show a clear correlation with the signs of the disease. Surprisingly, GMVs of IgG/VCA and IgA/VCA antibody titers were higher in patients with T1-T2 than in T3-T4, and differences were statistically significant (512 vs 336, p=0.0168 and 125 vs 64, p=0.0428, respectively). In patients with N0-N1 the GMV of IgA/VCA antibody titers was, nevertheless, lower than in patients with N2-N3 (11 vs 94, respectively), although the difference was not significant (P>0.05). The data obtained indicate an absence of correlation between the EBV markers and TNM signs in the Russian UNPC patients; this contradicts the results of a number of studies from endemic regions [35].
Relationship between the EBV Markers and Patient Survival
As it was mentioned earlier the goal of our investigation was to compare EBV serologic and molecular markers in order to understand if any of them would be clinically relevant. To study the overall survival rates and their relationship with IgA/VCA antibody titers, and plasma EBV DNA concentration, we followed-up 21 UNPC patients, with both serologic and viral load results available for comparison. The median follow-up period was 10 months (range 3–68 months). As follows from Figures 7A & B, the differences between the overall survival rates in patients with high (≥1:160) and low (<1:160) IgA/VCA antibody titers in the groups of patients either before or after the treatment were statistically insignificant.
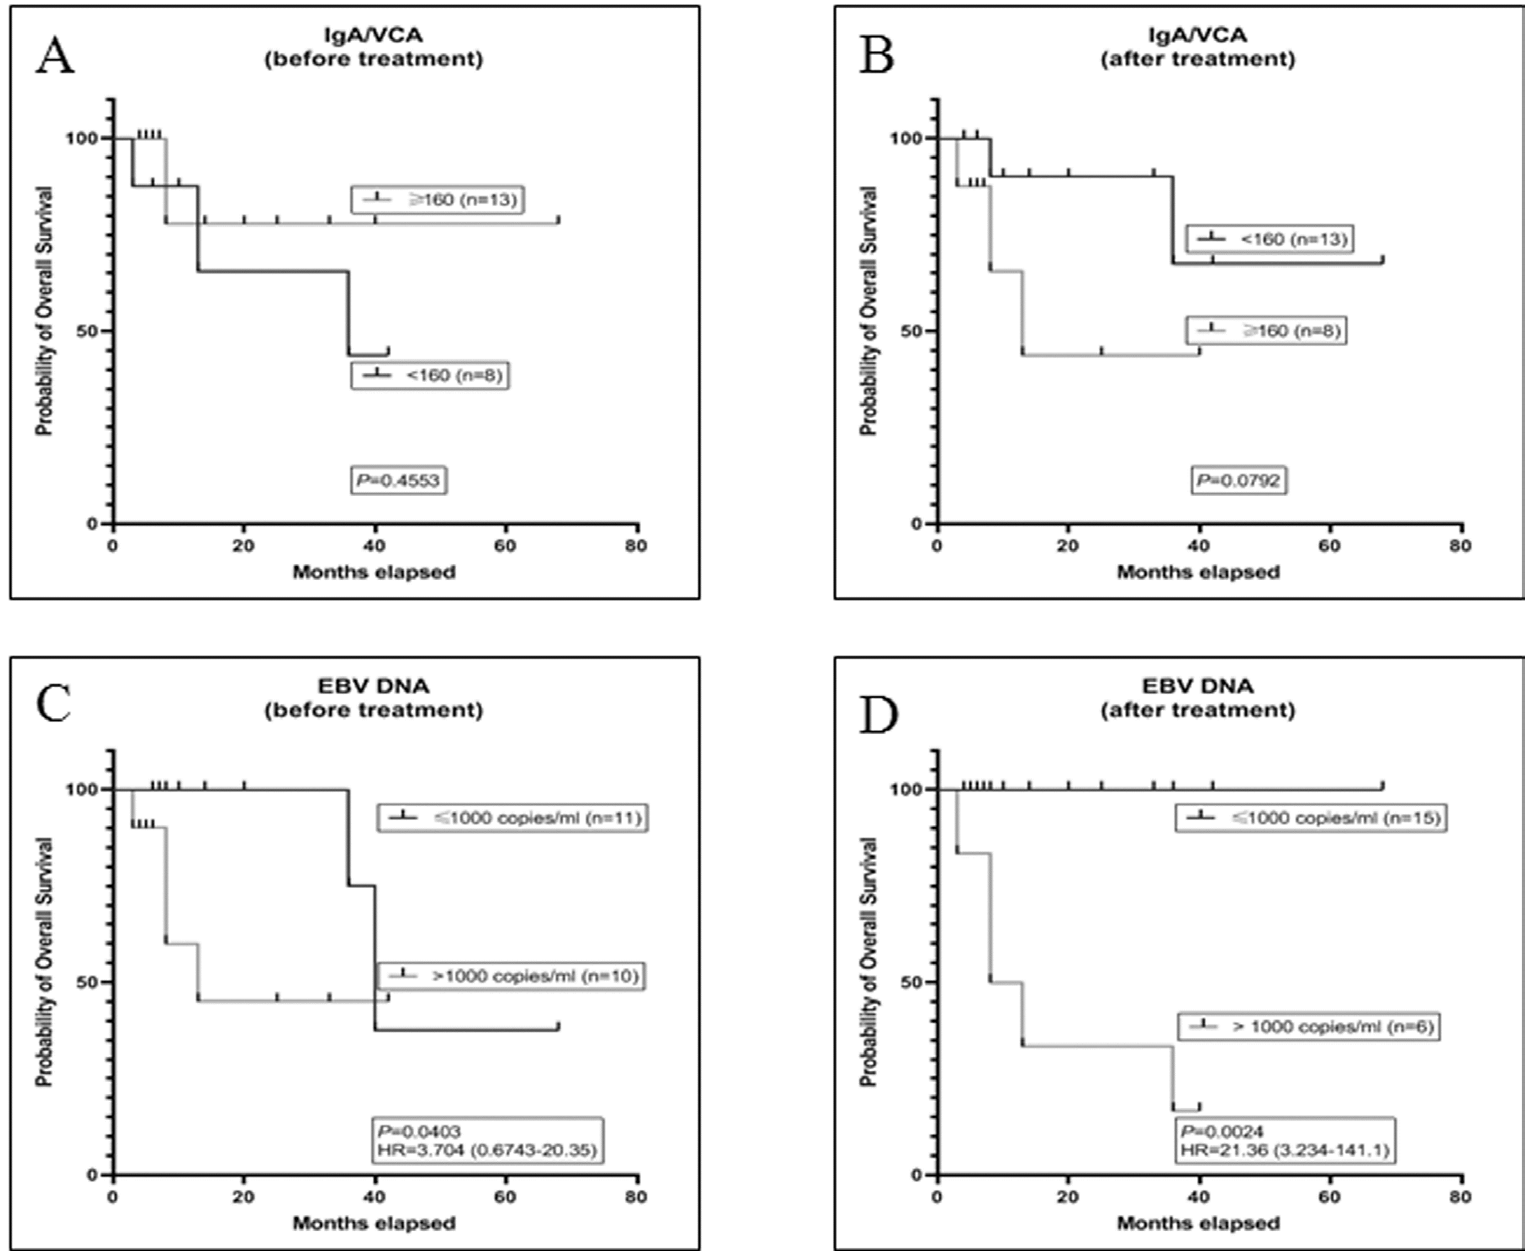
_Ig A antibody titers ≥1:160; Plasma EBV DNA concentration ≥1000 copies/mL _IgA antibody titers ≤1:160; Plasma EBV DNA concentration ≤1000 copies/mL Figure 7: Kaplan-Meier curves depicting overall survival rate in NPC patients.
Analyzing the overall survival rate depending on plasma EBV DNA load (Figure 7) it was found, that in patients with ≤1000 copies/mL before and after the treatment the overall survival was significantly higher than in patients with a viral DNA concentration >1000 copies/mL; the difference was statistically significant (p=0.0403 and p = 0.0024, respectively). Thus, the results obtained showed that an increased plasma EBV DNA levels reflects a tendency towards disease progression and a decrease in overall survival, while IgA/VCA titers do not. Therefore viral DNA load can be considered a useful EBV marker for monitoring UNPC patients not only in endemic but also non-endemic regions.
Discussion
The importance of EBV markers for the diagnosis and monitoring of UNPC patients in non-endemic regions is still not fully understood and requires further investigation_._ Low UNPC incidence in non-endemic countries made it difficult to form a representative group of patients for research that explains small number of publications devoted to UNPC studies in these countries. In present work, we analyzed clinical significance of two EBV markers (serological and molecular) in 96 Russian UNPC patients. It has been shown that IgA/VCA antibody titers are elevated in patients on admission, but respond differently to therapy and subsequent disease manifestations. Unfortunately, antibody response to EBV lags behind the clinical events of the disease in UNPC patients and thus do not allow to adequately assessing patients’ state after the treatment. The inability of EBV-specific antibodies to clearly respond to the various manifestations of UNPC has been confirmed by studies primarily from the non-endemic countries. In one study, serological response to EBV in UNPC patients did not correlate with the state of remission and relapse [36]. In another study, IgA antibody titers, unlike plasma EBV DNA concentrations, did not correlate with tumor size, volume of affected lymph nodes, degree of metastasis, and disease stages [37].
The differences in the serological response to EBV in UNPC patients from endemic and non-endemic regions can also be explained by the different genotypes of the studied populations responsible for formation of immune response to the virus. The external and internal environment factors can also play an important role in the formation of the immune response. In representatives of the same ethnic groups, but inhabiting different climatic and geographic regions, the response to an EBV infection may differ significantly. This assumption is supported by the fact that populations of healthy Chinese living in different parts of China are characterized by a different serological response to EBV [38, 39]. In our previous studies it has been also shown that the levels of IgG and IgA antibodies to VCA in NPC patients in Cuba were 2.5 times higher than those in NPC patients in the USSR [40].
Moreover, recent studies have shown that the peculiarity of the immune response in groups of individuals or entire ethnic groups can also be determined by the levels of magnesium circulating in the body, which are controlled by their corresponding genes. For instance, in NPC patients with NIPAL1 gene variants, the levels of the circulating magnesium are lower in familial and sporadic NPC cases. In addition, MAGT1, a gene for magnesium transport, abolishes the flow of magnesium in natural killer and CD8-T cells; consequently, this promotes an uncontrolled EBV replication [41, 42]. These studies suggest that the genes regulating magnesium transport may be important determinants of the risk of NPC. Thus, this warrants further studies since these genes might also determine the ability of the host to create an effective immune response against EBV and may be closely related to the occurrence of the tumor, thereby providing more effective targets for determining the diagnosis and prognosis in NPC patients [42].
In contrast to EBV specific antibodies, the plasma EBV DNA load in our investigation was found to be valuable marker for diagnosis and clinical state evaluation of UNPC, such as remission and relapse. It was also shown, that the concentration of viral DNA, when using EBV DNA cutoff of 1000 gene copies per mL, correlated with the UNPC patients’ overall survival. Similar correlation of viral DNA load with survival rate and clinical states was also observed in NPC patients from other countries [43, 44, 45]. In our study clinical significance of the viral DNA load is become clearly evident during dynamic follow up of individual UNPC patients. Similar correlation of EBV DNA load with disease relapse and remission in UNPC patients from endemic regions was clearly shown by Lo, et al. [14] and many other investigators [46, 47].
Thus, the study carried out showed that in a non-endemic region, Russia, both EBV markers, serological and molecular, can be effectively used for UNPC diagnosis in primary UNPC patients and that plasma EBV DNA load clearly correlates with overall survival of patients and its clinical state - remission and relapse.
Conclusion
In conclusion, it should be noted that the mechanism of development of neoplasms associated with EBV, including nasopharyngeal carcinoma (NPC), has not been sufficiently studied. The virus is equally widespread among the world’s population; however, there are countries and regions in which NPC is known to be endemic and non-endemic, as well as those with an intermediate level of the disease. The main difference between NPC cases in endemic and non-endemic countries is the different histological structure of tumors found in these countries. While more than 95% of NPC cases from endemic regions are undifferentiated non-keratinizing carcinomas associated with EBV infection, in non-endemic regions about 50% of cases are differentiated/keratinizing carcinomas, usually not associated with EBV. Until now, there is no clear answer for this unequal geographical distribution of histological NPC variants and their association with the virus. This could be due to a genetic predisposition to NPC in certain ethnic groups within a population (as was proven in China); alternatively, in non-endemic countries other factors, such as environmental pollution, exposure to carcinogenic agents, bad habits, culinary preferences etc., may have a significant impact on the process of carcinogenesis. This problem needs further study, and data from non-endemic regions are likely to contribute to its understanding.
Acknowledgements
This study was carried out as part of an experimental state assignment of the Ministry of Health of the Russian Federation under the coordination of the Center for Strategic Planning and Management of Biomedical Health Risks of the Ministry of Health of Russia. The authors are also grateful to the research laboratory assistants TE Dushenkina and TV Deltsova for technical assistance.
Conflicts of Interest
The authors declare that there are no conflicts of interest.
Financing
The study was supported by a grant from the Russian Science Foundation (project No. 18-015-00505A).
References
-
Chang CM, Yu KJ, Mbulaiteye SM, Hildesheim A, Bhatia K (2009) The extent of genetic diversity of Epstein-Barr virus and its geographic and disease patterns: a need for reappraisal. Virus Res 143(2): 209-221.
-
Hildesheim A, Apple RJ, Chen CJ, Wang SS, Cheng YJ, et al. (2002) Association of HLA class I and II alleles and extended haplotypes with nasopharyngeal carcinoma in Taiwan. J Natl Cancer Inst 94(23): 1780-1789.
-
Jia WH, Qin HD (2012) Non-viral environmental risk factors for nasopharyngeal carcinoma: a systematic review. Semin Cancer Biol 22(2): 117-126.
-
Xu M, Yao Y, Chen H, Zhang S, Cao SM, et al. (2019) Genome sequencing analysis identifies Epstein-Barr virus subtypes associated with high risk of nasopharyngeal carcinoma. Nat Genet 51(7): 1131-1136.
-
Hui KF, Chan TF, Yang W, Shen JJ, Lam KP, et al. (2019) High risk Epstein-Barr virus variants characterized by distinct polymorphisms in the EBER locus are strongly associated with nasopharyngeal carcinoma. Int J Cancer 144(12): 3031-3042.
-
Lam WKJ, Ji L, Tse OYO, Cheng SH, Jiang P, et al. (2020) Sequencing Analysis of Plasma Epstein-Barr Virus DNA Reveals Nasopharyngeal Carcinoma-Associated Single Nucleotide Variant Profiles. Clin Chem 66(4): 598-605.
-
Marks JE, Phillips JL, Menck HR (1998) The National Cancer Data Base report on the relationship of race and national origin to the histology of nasopharyngeal carcinoma. Cancer 83(3): 582-588.
-
Fahraeus R, Fu HL, Ernberg I, Finke J, Rowe M, et al. (1988) Expression of Epstein-Barr virus-encoded proteins in nasopharyngeal carcinoma. Int J Cancer 42(3): 329-338.
-
Yip TT, Lau WH, Chan JK, Ngan RK, Poon YF, et al. (1998) Prognostic significance of DNA flow cytometric analysis in patients with nasopharyngeal carcinoma. Cancer 83(11): 2284-2292.
-
Chien YC, Chen JY, Liu MY, Yang HI, Hsu MM, et al. (2001) Serologic markers of Epstein-Barr virus infection and nasopharyngeal carcinoma in Taiwanese men. N Engl J Med 345(26): 1877-1882.
-
Wyatt DE, Brooker DS, Connolly JH, Coyle PV (1993) Prognostic value of Epstein-Barr virus serology in patients with nasopharyngeal carcinoma. J Infect 26(2): 171-175.
-
Cheng WM, Chan KH, Chen HL, Luo RX, Ng SP, et al. (2002) Assessing the risk of nasopharyngeal carcinoma on the basis of EBV antibody spectrum. Int J Cancer 97(4): 489- 492.
-
Tsang RK, Vlantis AC, Ho RW, Tam JS, To KF, et al. (2004) Sensitivity and specificity of Epstein-Barr virus IGA titer in the diagnosis of nasopharyngeal carcinoma: a three- year institutional review. Head Neck 26(7): 598-602.
-
Lo YM, Chan LY, Lo KW, Leung SF, Zhang J, et al. (1999) Quantitative analysis of cell-free Epstein-Barr virus DNA in plasma of patients with nasopharyngeal carcinoma. Cancer Res 59(6): 1188-1191.
-
Lo YM, Chan AT, Chan LY, Leung SF, Lam CW, et al. (2000) Molecular prognostication of nasopharyngeal carcinoma by quantitative analysis of circulating Epstein-Barr virus DNA. Cancer Res 60(24): 6878-6881.
-
Lo YM, Leung SF, Chan LY, Lo KW, Zhang J, et al. (2000) Plasma cell-free Epstein-Barr virus DNA quantitation in patients with nasopharyngeal carcinoma. Correlation with clinical staging. Ann N Y Acad Sci 906: 99-101.
-
Hong RL, Lin CY, Ting LL, Ko JY, Hsu MM (2004) Comparison of clinical and molecular surveillance in patients with advanced nasopharyngeal carcinoma after primary therapy: the potential role of quantitative analysis of circulating Epstein-Barr virus DNA. Cancer 100(7): 1429-1437.
-
Nicholls JM, Lee VH, Chan SK, Tsang KC, Choi CW, et al. (2019) Negative plasma Epstein-Barr virus DNA nasopharyngeal carcinoma in an endemic region and its influence on liquid biopsy screening programmes. Br J Cancer 121: 690-698.
-
Ji MF, Huang QH, Yu X, Liu Z, Li X, et al. (2014) Evaluation of plasma Epstein-Barr virus DNA load to distinguish nasopharyngeal carcinoma patients from healthy high- risk populations in Southern China. Cancer 120(9): 1353-1360.
-
Lo YM, Chan LY, Chan AT, Leung SF, Lo KW, et al. (1999) Quantitative and temporal correlation between circulating cell-free Epstein-Barr virus DNA and tumor recurrence in nasopharyngeal carcinoma. Cancer Res 59(21): 5452-5455.
-
Chan KC, Chan AT, Leung SF, Pang JC, Wang AY, et al. (2005) Investigation into the origin and tumoral mass correlation of plasma Epstein-Barr virus DNA in nasopharyngeal carcinoma. Clin Chem 51(11): 2192- 2195.
-
Hsu CL, Chang KP, Lin CY, Chang HK, Wang CH, et al. (2012) Plasma Epstein-Barr virus DNA concentration and clearance rate as novel prognostic factors for metastatic nasopharyngeal carcinoma. Head Neck 34(8): 1064-1070.
-
Ferrari D, Codeca C, Bertuzzi C, Broggio F, Crepaldi F, et al. (2012) Role of plasma EBV DNA levels in predicting recurrence of nasopharyngeal carcinoma in a Western population. BMC Cancer 12(208): 1-7.
-
Leung SF, Chan AT, Zee B, Ma B, Chan LY, et al. (2003) Pretherapy quantitative measurement of circulating Epstein-Barr virus DNA is predictive of posttherapy distant failure in patients with early-stage nasopharyngeal carcinoma of undifferentiated type. Cancer 98(2): 288-291.
-
Chan JY, Wong ST (2014) The role of plasma Epstein- Barr virus DNA in the management of recurrent nasopharyngeal carcinoma. Laryngoscope 124(1): 126- 130.
-
Cao SM, Liu Z, Jia WH, Huang QH, Liu Q, et al. (2011) Fluctuations of epstein-barr virus serological antibodies and risk for nasopharyngeal carcinoma: a prospective screening study with a 20-year follow-up. PLoS One 6(4): e19100.
-
Ji MF, Wang DK, Yu YL, Guo YQ, Liang JS, et al. (2007) Sustained elevation of Epstein-Barr virus antibody levels preceding clinical onset of nasopharyngeal carcinoma. Br J Cancer 96(4): 623-630.
-
Zhao FP, Liu X, Zhong ZM, Lu J, Yu BL, et al. (2014) Positivity of both plasma Epstein-Barr virus DNA and serum Epstein-Barr virus capsid specific immunoglobulin A is a better prognostic biomarker for nasopharyngeal carcinoma. BBA Clin 2: 88-93.
-
Ferrari D, Codeca C, Bertuzzi C, Broggio F, Crepaldi F, et al. (2012) Role of plasma EBV DNA levels in predicting recurrence of nasopharyngeal carcinoma in a Western population. BMC Cancer 12: 208.
-
Mazurek AM, Wygoda A, Rutkowski T, Olbryt M, Pietrowska M, et al. (2020) Prognostic significance of Epstein-Barr virus viral load in patients with T1-T2 nasopharyngeal cancer. J Med Virol 92(3): 348-355.
-
Stoker SD, Wildeman MA, Novalic Z, Fles R, van Braunius WW, et al. (2016) Can Epstein-Barr virus DNA load in nasopharyngeal brushings or whole blood predict recurrent nasopharyngeal carcinoma in a non-endemic region? A prospective nationwide study of the Dutch Head and Neck Oncology Cooperative Group. Eur Arch Otorhinolaryngol 273(6): 1557-1567.
-
Gurtsevitch VE, Senyuta NB, Ignatova AV, Lomaya MV, et al. (2017) Epstein-Barr virus biomarkers for nasopharyngeal carcinoma in non-endemic regions. J Gen Virol 98(8): 2118-2127.
-
Sam CK, Abu Samah AJ, Prasad U (1994) IgA/VCA as a follow-up marker in the monitoring of nasopharyngeal carcinoma. Eur J Surg Oncol 20(5): 561-564.
-
Tsang RK, Vlantis AC, Ho RW, Tam JS, To KF, et al. (2004) Sensitivity and specificity of Epstein-Barr virus IGA titer in the diagnosis of nasopharyngeal carcinoma: a three- year institutional review. Head Neck 26(7): 598-602.
-
Liu MZ, Fang SG, Huang W, Wang HY, Tian YM, et al. (2019) Clinical characteristics and prognostic value of pre-retreatment plasma epstein-barr virus DNA in locoregional recurrent nasopharyngeal carcinoma. Cancer Med 8(10): 4633-4643.
-
Yip TT, Ngan RK, Fong AH, Law SC (2014) Application of circulating plasma/serum EBV DNA in the clinical management of nasopharyngeal carcinoma. Oral Oncol 50(6): 527-538.
-
Fachiroh J, Schouten T, Hariwiyanto B, Paramita DK, Harijadi A, et al. (2004) Molecular diversity of Epstein-Barr virus IgG and IgA antibody responses in nasopharyngeal carcinoma: a comparison of Indonesian, Chinese, and European subjects. J Infect Dis 190(1): 53- 62.
-
He YQ, Xue WQ, Xu FH, Xu YF, Zhang JB, et al. (2018) The Relationship Between Environmental Factors and the Profile of Epstein-Barr Virus Antibodies in the Lytic and Latent Infection Periods in Healthy Populations from Endemic and Non-Endemic Nasopharyngeal Carcinoma Areas in China. EBioMedicine 30: 184-191.
-
Xu FH, Xiong D, Xu YF, Cao SM, Xue WQ, et al. (2012) An epidemiological and molecular study of the relationship between smoking, risk of nasopharyngeal carcinoma, and Epstein-Barr virus activation. J Natl Cancer Inst 104(18): 1396-1410.
-
Gurtsevitch V, Ruiz R, Stepina V, Plachov I, Le Riverend E, et al. (1986) Epstein-Barr viral serology in nasopharyngeal carcinoma patients in the USSR and Cuba, and its value for differential diagnosis of the disease. Int J Cancer 37(3): 375-381.
-
Chaigne Delalande B, Li FY, O Connor GM, Lukacs MJ, Jiang P, et al. (2013) Mg2+ regulates cytotoxic functions of NK and CD8 T cells in chronic EBV infection through NKG2D. Science 341(6142): 186-191.
-
Li FY, Chaigne-Delalande B, Kanellopoulou C, Davis JC, Matthews HF, et al. (2011) Second messenger role for Mg2+ revealed by human T-cell immunodeficiency. Nature 475(7357): 471-476.
-
Leung SF, Zee B, Ma BB, Hui EP, Mo F, et al. (2006) Plasma Epstein-Barr viral deoxyribonucleic acid quantitation complements tumor-node-metastasis staging prognostication in nasopharyngeal carcinoma. J Clin Oncol 24(34): 5414-5418.
-
Lin JC, Wang WY, Chen KY, Wei YH, Liang WM, et al. (2004) Quantification of plasma Epstein-Barr virus DNA in patients with advanced nasopharyngeal carcinoma. N Engl J Med 350(24): 2461-2470.
-
Hou X, Zhao C, Guo Y, Han F, Lu LX, et al. (2011) Different Clinical Significance of Pre- and Post-treatment Plasma Epstein-Barr Virus DNA Load in Nasopharyngeal Carcinoma Treated with Radiotherapy. Clin Oncol (R Coll Radiol) 23(2): 128-133.
-
Chang KP, Hsu CL, Chang YL, Tsang NM, Chen CK, et al. (2008) Complementary serum test of antibodies to Epstein-Barr virus nuclear antigen-1 and early antigen: a possible alternative for primary screening of nasopharyngeal carcinoma. Oral Oncol 44(8): 784-792.
-
Kalpoe JS, Dekker PB, van Krieken JH, Baatenburg de Jong RJ, Kroes AC (2006) Role of Epstein-Barr virus DNA measurement in plasma in the clinical management of nasopharyngeal carcinoma in a low risk area. J Clin Pathol 59(5): 537-541.
- hMPV: Is It Another Covid-19 Like Situation?
- Streptomyces: Sources of Novel Discoveries in Antibiotic Research to Combat Antimicrobial Resistance
- A Review of Mosquitoes (Diptera: Culicidae) and Their Biodiversity, Medical and Veterinary Importance
- Past and Current Immunotherapy in Cancer
- Hematological Cancer and Viral Infection
- The Growing Threat of Antimicrobial Resistance in India: Challenges and Solutions