Glial Response to Perinatal Multi-Hit Stress: The Triggering Factor for Schizophrenia
Schizophrenia is a neuropsychiatric disorder with heterogeneous causative agents. This mental disorder is accompanied by impaired cognitive and behavioral abilities, hallucination and negative phenotypes. Among many identified causative agents of Schizophrenia, early life stressors like perinatal protein malnourishment and immune infections are considered to be most efficient. Furthermore, due to the world wide prevalence of protein malnourishment and infections, an individual often encounters them simultaneously, giving rise to a multi-hit condition. In this study, Wistar female rats (3 months old) were broadly divided into control (fed with 20% protein diet) and LP (low protein, fed with 8% protein diet) groups. The F1 pups born to both control and LP females were subjected to single as well as combined exposure of Poly I:C (5mg/kg body weight) and LPS (0.3mg/kg body weight) at PND 3 and 9 respectively. The overall study consists of eight groups i.e., Control, Control+Poly I:C, Control+LPS, Control+Poly I:C+LPS, LP, LP+Poly I:C, LP+LPS and LP+Poly I:C+LPS (multi-hit). All these groups were studied for glial (astrocytes and microglia) changes at PND 12, 21 and 30 and cognitive and behavioral abnormalities at PND 30 respectively. From the overall result, it was seen that both astrocytes and microglia were severely affected mainly in the multihit group, with astrogliosis, astrocytic degeneration and loss of healthy microglial activity being prominent observations. Such cellular abnormalities were followed by severe hyperactivity and memory impairment at PND 30. While such changes were also seen in single-hit group, it was not severe. Such above mentioned abnormalities are also common in Schizophrenia and multi-hit stress was observed to trigger them the most. Thus, this study adds on to Schizophrenic research and concludes that multi-hit stress is the actual triggering factor that leads to development of Schizophrenia in affected individual.
Introduction
Schizophrenia is a complicated neuropsychological disorder, classified by impaired social interactions, cognitive and behavioral deficits, negative phenotypes and hallucinations [1, 2]. Neuroinflammation due to exposure of several stress initiating agents like pathogens, genome- environment interactions and social factors like social abuse (physical and mental), poor life style and nutritional deficiencies are reported to be the causative factors for schizophrenia [3, 4, 5, 6, 7]. These causative factors may act either individually or in combination during different stages of life [8]. Due to the diverse array of stressors and their differential mode of action, it becomes difficult to identify the exact scenario that causes schizophrenia in affected individuals.
Developmental age of an individual life is considered as the critical period and is specifically vulnerable to neuroinflammation and neuro-immunological changes due to the occurrence of important cellular events like genesis, proliferation, migration, maturation and apoptosis [9]. Developmental neurogenesis begins around fifth week of gestation during which naïve neurons are formed from the radial glial cell through asymmetric cell division. These naïve neurons then radially migrate to the different brain areas and by week seven the cortical plate starts to form [10]. Neurogenesis peaks during 25th week of gestation and by 36th week, all the new neurons complete migration and reach their destined location in brain. Additionally, the fall of neurogenesis is accompanied by another important event named astrogenesis which begins around 20th week and continue until post birth [11]. Microglia on the other hand colonizes the brain between fourth and twenty fourth week of gestation [12] and are solely responsible for eliminating the detrimental components from the brain [13]. Development and functioning of both astrocytes and microglia are considered crucial for maintaining the neuronal population. Any deviation in glial development alters their functioning and affects neurons, causing neuroinflammation and finally neurodegeneration [14, 15].
Chronic stress encountered perinatally often interrupts the ongoing cellular development and changes the overall brain homeostasis [7, 16]. A state of chronic stress is built up by multiple exposures to early life stressors, pervasively affecting the nervous system by altering the formation and activity of different brain cells [16]. Both maternal protein malnourishment and perinatal/postnatal infections are considered as potential early life stressors [7]. When encountered by an individual during perinatal life, these stressors are reported to cause delay in astrocytic maturation, abnormal glial death, gliosis, neuronal degeneration, neuroinflammation along with cognitive and behavioral deficits [14, 17, 18, 19, 20].
With conditions like poverty, poor medical support and low hygiene, the chances of encountering two most important stressors namely protein malnourishment and infections (viral and bacterial) have increased by many folds [21]. Proteins build up important components of the nervous system like neurotransmitters, cytoskeleton, signaling molecules, receptors, etc. and protein malnourishment faced during development leads to unavailability of essential amino acids which leads to a poorly developed nervous system [22]. Additionally, perinatal protein malnourishment not only affects the physical buildup of an individual, but also leads to a compromised immune system and makes a malnourished individual more prone to immune stress. Immune stress due to viral and bacterial infections causes havoc on the developing brain and is considered responsible for causing encephalitis, leading to lethal consequences like neuronal degeneration, glial activation and demyelination [17, 19]. Thus, when both maternal protein malnourishment and immune stress are encountered together by an individual during development, the extent of damage might be seen as one of the chronic neurological disorders i.e., Schizophrenia. Multi-hit condition arises when multiple stressors are exposed to an individual simultaneously which further affects different brain areas [8, 23]. This study is aimed to investigate the impact of multi-hit exposure on the activity of astrocytes and microglia in developing rat brain. Also, as Schizophrenia is accompanied with cognitive and behavioral abnormalities, these aspects were also analyzed with respect to glial changes following various multi-hit exposures. Lastly, in this study, we studied the hippocampal region of the brain mainly due to its active involvement in both adult neurogenesis as well as cognitive and behavioral abilities. Thus, this study will add on to the limited knowledge of Schizophrenia research and will help to correlate such stressful early life condition with the development of the same.
Materials and Methods
Development and Maintenance of Animal Models
Wistar rats were maintained in the animal house facility of School of Studies in Neuroscience, under controlled environment; temperature 25°C, humidity 65% and light and dark circle of 12 hr. approximately. All animals were given ad libitum access to rat pellet feed and reverse osmosis (RO) water. Three-month-old F0 females (140-150 gm) rats were shifted to the experimental diets i.e., control (normal protein, 20%, n=16) and LP (low protein, 8%, n=16), 15 days prior to mating. After successful mating, the females were maintained on their respective diets throughout the gestation and lactation periods.
Poly I: C (Polyinosinic:polycytidylic acid, viral mimetic) and LPS (lipopolysaccharide, bacterial endotoxin) preparation: The stock solution of Poly I:C was prepared by dissolving 5 mg of Poly I:C (P1630, Sigma; St. Louis USA) in TBE buffer (tris-Borate-EDTA, pH-8, pre heated to 60°C). On the other hand, LPS stock solution was prepared by dissolving 0.3 mg of LPS (L2630, Sigma Aldrich, E. coli, serotype 0111:B4) in 1 mL of PBS buffer (Phosphate buffer saline, pH-7.2).
Division of animals into different experimental groups according to different stress exposure: The F1 pups born to females fed with either control or LP diets were further exposed to Poly I:C or LPS or both in combination, thus making the following eight groups. Litter size was adjusted to 8 per dams and the day of parturition was considered as postnatal day (PND) 0.
Control and LP groups: Equal number of F1 pups (n=32) from both control and LP dams, without any further exposure to stress were used in these two groups.
Poly I: C and LPS administered control and LP groups (Control+Poly I:C; LP+Poly I:C; Control+LPS; LP+LPS): To create these four groups, either Poly I:C or LPS were injected intraperitoneally (Poly I:C dosage: 5 mg/kg body weight; LPS dosage: 0.3 mg/kg body weight) to both control and LP pups (n=32 each) at PND 3 and PND 9 respectively.
Multi-hit groups (Control+Poly I:C+LPS; LP+Poly I:C+LPS): For these groups control and LP pups (n=32) were injected intraperitoneally with Poly I:C at PND 3 followed by LPS at PND 9 (Poly I:C dosage: 5 mg/kg body weight; LPS dosage: 0.3 mg/kg body weight).
The pups after injections were returned to their home cage with their mothers and maintained on their respective diets till used according to the experimental plan. The injections were carried out in aseptic conditions using Stoelting Nanoinjector and Hamilton micro syringe to ensure precise volume and efficient absorption. The control animals were simultaneously injected with vehicle alone. Prior permission was taken from Institutional Animal Ethics Committee, Jiwaji University, Gwalior (M.P), India (Reg no. 1854/G0/Re/s/16/CPCSEA).
Harvesting of brain tissues through transcardial perfusion technique and sectioning of the desired brain area: The F1 pups of PND 12, 21 and 30 (n=3 per group) were anesthetized and then perfused transcardially by flushing blood using PBS (Phosphate Buffer Saline, pH-7.4), followed by fixation with 2% paraformaldehyde (prepared in 0.01M phosphate buffer). The medial temporal part of the brain was dissected out and immersed fixed in the same fixative for 24 hr. The tissues were then cryoprotected using sucrose gradients prepared in phosphate buffer at 4oC, followed by sectioning using a cryotome machine (Leica CM1900, Germany). The coronal sections (14 µm) were collected on gelatin coated slides and stored at -20oC for immunohistochemical labeling.
Astrocytic and microglial response following perinatal stress exposure was assessed by employing GFAP (glial fibrillary acidic protein), S100β (a calcium binding protein), Iba1 (ionized calcium binding adapter molecule), OX 6 (MHC II) and OX 42 (CR3: complement receptor 3) immunolabeling at PND 12, 21 and 30 as per the procedure detailed below. Immunolabelling for MHC II expression (MHC II; OX 6) and complement receptor activation (CR3; OX 42) was performed only at PND 30. Slides with cryosections containing hippocampal region (n=3 per group) from all the groups and time-points, were randomly selected and air dried for 45 min and arranged in a coupling jar and washed with either PBS for GFAP, S100β and Iba1 or TBS (Tris buffered saline, pH-7.4) for OX 6 and OX 42. The sections were then permeabilized using Triton X-100 (Sigma) for 20 min, followed by either PBS or TBS washing. After permeabilization, the endogenous blocking was performed using 1% H2O2 (prepared in PBS or TBS respectively) for 20 min, followed by washing in either PBS or TBS. The sections were then incubated with 1% serum for 90 min at room temperature in a humid chamber (Normal serum from Vector kit PK6101 for GFAP and Iba1; Vector kit PK6200 for S100β, OX 6 and OX 42 respectively). The slides were then coated and incubated overnight at 4oC with their respective primary antibody i.e., anti-GFAP (1:1000, rabbit polyclonal, DAKO Z0334), anti-S100β (1:500, mouse monoclonal, Sigma, S2532), anti-Iba1 (1:800, rabbit polyclonal, Wako, 019-19741), anti-OX-6 (1:150, mouse monoclonal, Serotec, MCA46G) and anti-OX-42 (1:300, mouse monoclonal, Serotec, MCA 275G) diluted in 1% BSA in PBS. Next morning, the slides were brought to room temperature, followed by washing with either PBS or TBS and then incubated with their respective secondary antibody at room temperature for 2 hrs. (1:100, Vector kit PK6101 for GFAP and Iba1 and Vector kit PK6200 for S00β, OX 6 and OX 42 respectively). After this, the sections were washed using their respective buffers and then incubated with streptavidin biotin HRP complex (1:200, Vector kit PK6101 for GFAP and Iba1 and PK6200 for S00β, OX 6 and OX 42 respectively) for 2 hr. Following this step, the sections were washed using either PBS or TBS and then incubated in DAB solution for 20 min (25 mg DAB+60µl H2O2 in PBS/ TBS) for color development. Furthermore, nickel sulphate (2.5%) was added to DAB solution for color enhancement in case of MHC II and CR 3 immunolabeling. The reaction was then terminated by placing the coupling jar under running tap water, followed by rinsing with dH2O. All the antibodies were diluted in 1% BSA in PBS. The sections were finally air dried followed by dehydration in absolute alcohol, cleared in xylene and mounted in DPX. The slides were stored at room temperature for analysis.
Analysis of Immunohistochemical Slides: Bright field images of the sections were grabbed using Leica DFC 310FX digital camera, fitted to Leica DM 6000 microscope and Leica Application Suite (LAS V4.2) software.
For quantification the images (n=108 images for each group and time point) were grabbed with a constant magnification and frame size i.e., 20X and 21670.9 µm2 respectively from various regions of the hippocampus, ie., Cornu Ammonis (CA1, CA3) and Dentate gyrus (DG). Two parameters i.e., area fraction (% positive labeled areas indicating antigen density) and cell count (number of cells/mm2) were considered for quantification. Both the parameters were measured using interactive module of Leica QWin software (V3.1). The data obtained from the images of CA 1, CA 3 and DG regions of the entire hippocampus was compiled and represented graphically.
Analysis of Behavioral and Cognitive Abilities Using Different Tests
Elevated Plus Maze (EPM): 30-day old rats (n=12) from each group were used for this test. The rats were acclimatized in the testing room, 2 hr. prior to initiation of the test. EPM (a plus shaped maze with 75 cm elevation) comprises of a pair of open and closed arms. Animals from different groups were individually placed in the center zone of the EPM and left to freely explore the entire maze, for 120 sec. Three trials for each animal were conducted at an interval of 2 hr. Data for two parameters i.e., time spent in open arms and number of entries in open arms were recorded using a vertical camera focused above the maze and attached to a computer, loaded with Any maze software (v4.82). The percentage of both time spent and number of entries were calculated using the following formulae:
% Time spent in open arms= 100 total time spent inopenarms total test time ×
% Entries in open arms= 100 number of entriesinopenarms number of total entries × The mean percentage data was plotted as bar graphs and analyzed statistically for interpretation of result.
Open field test (OFT): The instrument consists of a transparent box (42 cm X 43 cm X 22 cm) made up of acrylic with infrared beams which are perpendicular to each other (15 infrared photocells per row, total two rows). The beams are used to detect vertical and horizontal locomotor movements of the rats. The OFT apparatus was connected to a computer, pre-loaded with a monitoring software (Opto- Varimex, Columbus Instruments, USA, v4.14). Equal number of animals from different groups (n=12) were acclimatized in the open arena of the OFT for 5 min prior to the actual test session. This was done to rule out anxiety which is normal in case of any exposure of a rat into a novel environment. The actual test was recorded for 20 min in which the animal was kept in the center of the open arena of the OFT to record locomotor activities. Parameters like Distance travelled (sec), Resting time (sec), Ambulatory time (sec) and Stereotypic time (sec). Were recorded and analyzed to study behavioral deficits following early life stress exposure.
Assessment of learning and memory at PND 30 using T maze (Columbus instrument) and Morris Water Maze (MWM; Columbus instrument) T maze: It is a T shaped maze, used to analyze spatial working memory through a reward-based protocol. Bait is placed on the extreme end (baited zone) of either right or left reward arm. The rats, individually placed in the start arm were taught to locate the bait efficiently with minimal effort, following direct path within minimum time. During the training period (three consecutive days with four trials/ animal/ day), the animals were placed in the start arm and were allowed to randomly explore around and locate the bait within 120 sec. If the animals failed to locate the bait, they were manually guided towards the bait. On the 4th day, final data was recorded for three trials as mean path efficiency to reach the bait, using a vertical camera attached to a computer, loaded with Any maze software (v4.82).
MWM: The spatial memory of the animals was analyzed using this maze. Spatial clues fixed to the maze were used as references to guide the animals to locate the hidden platform, following the most direct path. The maze was filled with water and the animals were individually placed in the maze in such a way that the hidden platform was at the opposite end. The animals were then allowed to locate the platform within 120 sec and when failed to do so, the animals were manually guided to the platform during the training period (three consecutive days with four trials for each animal each day). On the fourth day, 3 trails of final data was recorded as path efficiency (shortest route to the platform) and latency (time taken to reach the platform), using a vertical camera focused above the maze and attached to a computer with Any maze software (v4.82). Finally, the data was analyzed to assess their spatial memory.
Statistical analysis: Data from all the tests was analyzed statistically using one-way and two-way ANOVA for group wise interaction and interaction between variables (diets and treatments) respectively. ANOVA was followed by Holm- Sidak post hoc test. All statistical tests were performed using Sigma plot software version 12.0 and the significance level was set at P≤0.05. As sex specific difference was observed to be negligible, data from both male and females were combined and presented as average.
Results
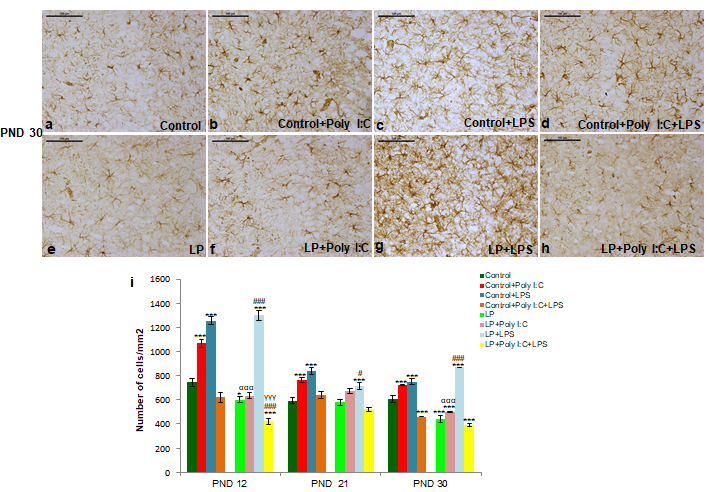
Response of Astrocytes
Astrogliosis and changes in the morphology of astroglia were observed following early life stress exposure in the various stressed groups. During activation, astrocytes change their bushy star shaped morphology into a more confined structure, characterized as confined processes and hyper expression of marker proteins like GFAP and S100β.
Changes in astrocytic morphology and density was assessed in GFAP immunolabelled hippocampal sections. In control group, no astrogliosis was observed at any of the studied time points (PND 12, 21 and 30) and the astrocytes were in resting state with star shaped morphology and extended processes (Figure 1a, i & 2a). Following single-hit with either poly I:C or LPS to control group (control+ Poly I:C and control+ LPS groups), the cell density increased vigorously along the CA regions with most of the astrocytes transformed into activated forms with strong GFAP labeled hypertrophied cell soma and thick processes (Figure 1b,c,j,k & 2b, c). In addition, few GFAP positive fragmented processes were also seen in these single-hit control groups. Cumulative exposure of both Poly I:C and LPS to control group rats led to a significant reduction in the GFAP labeled astrocytes along with a marked increase in fragmented processes (Figure 1d,l & 2d). This suggested either a stress induced defect in astrogenesis or loss of viable astrocytes.
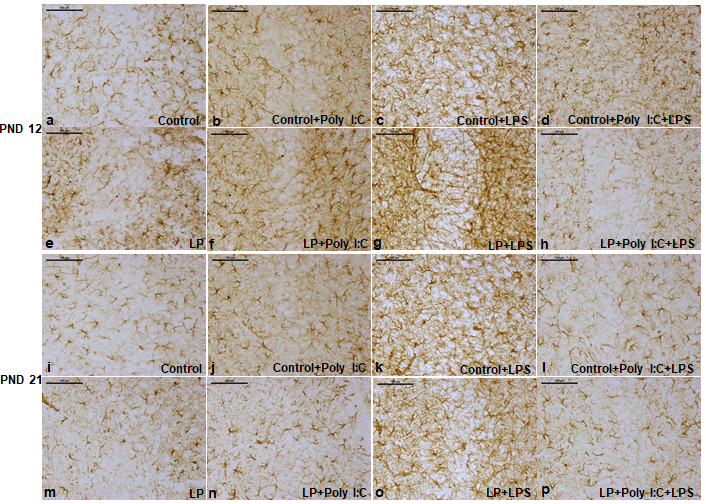
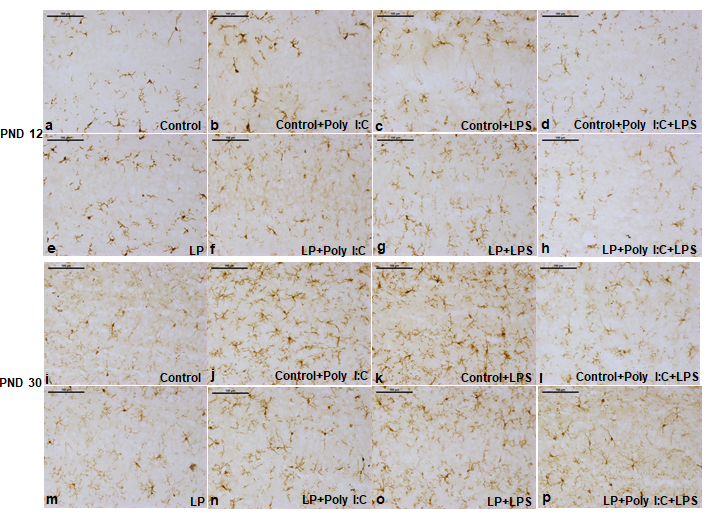
Figure1: The GFAP labeled PND 12 and 21 CA images showing astrogliosis following stress exposure.
Control animals had evenly distributed star shaped astrocytic population around the CA region (a and i). Poly I:C and LPS exposure to controls led to a vigorous activation of astrocytes with a hype in reactive astrocytes in the Control+Poly I:C and Control+LPS groups, marked with prominent enlarged soma and darkly labeled thick processes (b,j,c,k). LP alone group had limited cells when compared to control and the cell population hyped in LP+Poly I:C and LP+LPS groups, (e,f,g,m,n,o). Again, on combined exposure of Poly I:C and LPS to both control and LP animals, cell number decreased and astrocytic activation along with fragmented cells were prominent mainly in the multi-hit group (d,h,l,p). (n=3 slides from different animals/group, scale bar=100µm).
Maternal protein malnutrition was found to significantly reduce the astrocyte population. The astrocytes with normal morphology were very discrete and scattered in the LP group at all the time points studied (Figure 1e,m & 2e) and a large fraction of these cells were found to be morphologically distorted and fragmented. Exposure to either Poly I:C or LPS as single-hit, induced astrocytic activation leading to an increase in both GFAP expression and astrocytic density (Figure 1f,g,n,o & 2f,g). However, the response was much pronounced in LP+LPS group as compared to LP+Poly I:C group and persisted throughout the study period. Cumulative exposure of both Poly I:C and LPS to LP group rats (multi- hit) resulted in a vigorous cellular fragmentation leading to a significant decrease in astrocytic density and GFAP expression at all the time-points studied (Figure 1h, p & 2h). These observations suggest chronic astrocytic loss, specific to multi-hit exposure.
Control animals had resting astrocytic population (a) whereas Poly I:C and LPS exposure to control animals led to a vigorous activation of astrocytes with a hype in reactive astrocytes in the Control+Poly I:C and Control+LPS groups (b,c). LP alone as well as LP+Poly I:C groups were seen to have limited activated astrocytes when compared to their control counterparts (e, f). LP+LPS group showed vigorous increase in astrocytic population (g). Again, on combined exposure of Poly I:C and LPS to both control and LP animals, astrocytic activation along with fragmented cells were prominent (d,h). (n=3 slides from different animals/group, scale bar=100µm).
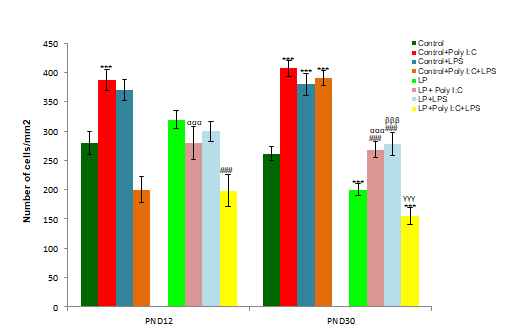
The result observed in the GFAP labeled microscopic images at PND 12, 21 and 30 are also supported by the cell count data, represented as histogram (i). (n=108 images, 3 slides from different animals/group), values are expressed as mean±SEM; ***P≤0.001, *P≤0.05 with respect to controls; ###P≤0.001, #P≤0.05, with respect to LP alone group; αααP≤0.001 with respect to Control+Poly I:C and LP+Poly I:C; γγγP≤0.001 with respect to Control+Poly I:C+LPS and LP+Poly I:C+LPS.
Analysis of cellular density (Figure 2i) as a quantitative measure depicted that the astrocytic response following early life stressors peaked at PND 12 followed by a decline by PND 21 and 30. A significant hype in cell number was also seen following single-hit of either Poly I:C or LPS to both control and LP animals. Both intra and inter group analysis using One and Two way ANOVA, revealed a significant difference between control vs. Control+Poly I:C (t(3,164)=6.8, P≤0.001; t(3,164)=4.8, P≤0.001; t(3,164)=4.7, P≤0.001), control vs. Control+LPS (t(3,164)=10.8, P≤0.001; t(3,164)=7, P≤0.001; t(3,164)=5.9, P≤0.001), and LP vs. LP+LPS (t(3,164)=14.8, P≤0.001; t(3,164)=3.8, P≤0.05; t(3,164)=17.7, P≤0.001) at PND 12, 21 and 30 respectively. However, following combined exposure of both Poly I:C and LPS to control as well as LP animals led to a drastic decrease in total astrocyte number in both Control+Poly I:C+LPS and LP+Poly I:C+LPS (multi-hit) groups respectively (control vs. Control+Poly I:C+LPS, t(3,164)=6, P≤0.001 at PND 30 and LP vs. LP+Poly I:C+LPS, t(3,164)=6.8, P≤0.001 at PND 12). Significant differences in cell number were also seen between control and LP alone group (t(1,246)=3, P≤0.001; t(1,246)=6.9, P≤0.001), and between control and LP single and multi-hit groups (control vs. LP+Poly I:C, t(7,328)=4.4 P≤0.001, at PND 30; control vs. LP+LPS, t(7,328)=11.8, P≤0.001; t(7,328)=3.3, P≤0.001; t(7,328)=8.9, P≤0.001, at PND 12, 21 and 30 and control vs. LP+Poly I:C+LPS, t(7,328)=6.8, P≤0.001 at PND 12). Furthermore, control and LP inter-group analysis revealed a significant difference between control and LP single and combined stressed groups (Control+Poly I:C vs. LP+Poly I:C, t(1,246)=9.2, P≤0.001; t(7,328)=9.1, P≤0.001 at PND 12 and 30, Control+Poly I:C+LPS vs. LP+Poly I:C+LPS, t(7,328)=4.2, P≤0.001; at PND 12). Lastly, when compared between Poly I:C (viral mimetic) and LPS (bacterial mimetic) infected groups, the astrocytic response to bacterial infection was more severe and persistent till PND 30.
Astrogliosis observed vide supra was further confirmed through S100β immunolabeling, a potent marker of neurodegeneration, which indicated a significant increase in S100β positive cells following single and multi-hit exposure to both the control and LP group rats. Such hype in stressed group persisted till PND 30 when compared to controls, although the density was lower in PND 30 as compared to PND 12 groups, may be because of subsiding developmental events (Figure 3a-p). The area fraction data (Figure 4) also supported these results with a significant increase in S100β protein expression seen in either Poly I:C or LPS treated control and LP groups when compared to control and LP alone groups respectively (control vs. Control+Poly I:C, t(3,164)=9.8, P≤0.001; t(3,164)=3.6, P≤0.001; control vs. Control+LPS t(3,164)=7.9, P≤0.001; t(3,164)=9, P≤0.001; control vs. LP+Poly I:C, t(7, 328)=16.3, P≤0.001; t(7,328)=9.3, P≤0.001; control vs. LP+LPS; t(7,328)=14.6, P≤0.001; t(7,328)=9.3, P≤0.001, control vs. Control+Poly I:C+LPS, t(3,164)=13.7, P≤0.001; t(3,164)=9.3, P≤0.001, LP vs. LP+Poly I:C, t(3,164)=3.2, P≤0.001; t(3,164)=12.8, P≤0.001; LP vs. LP+LPS, t(3,164)=3.7, P≤0.001; t(3,164)=11.2, P≤0.001). Additionally, following combined exposure of Poly I:C and LPS to both control and LP animals, the astrocytic activation became severe in LP+Poly I:C+LPS group when compared to control, LP alone as well as Control+Poly I:C+LPS groups (t(7,328)=24, P≤0.001; t(7,328)=11.5, P≤0.001; t(3,164)=20.7, P≤0.001; t(3,164)=10.8, P≤0.001; t(1,246)=10.4, P≤0.001). Thus, even though there was a gradual decrease in total astrocytic population by PND 30, the activated cells remained high in the single-hit and multi-hit group. Moreover, the LP group animals showed more vigorous response to all type of stress exposure when compared to their respective control treated groups (Control+Poly I:C vs LP+Poly I:C, t(1,246)=6.5, P≤0.001; Control+LPS vs. LP+LPS, t(1,246)=6.68, P≤0.001). Lastly, when the data of PND 12 and 30 was compared, the astroglial reactivity was more chronic at PND12, suggesting a damage to the developing astrocytes following various stress exposure.
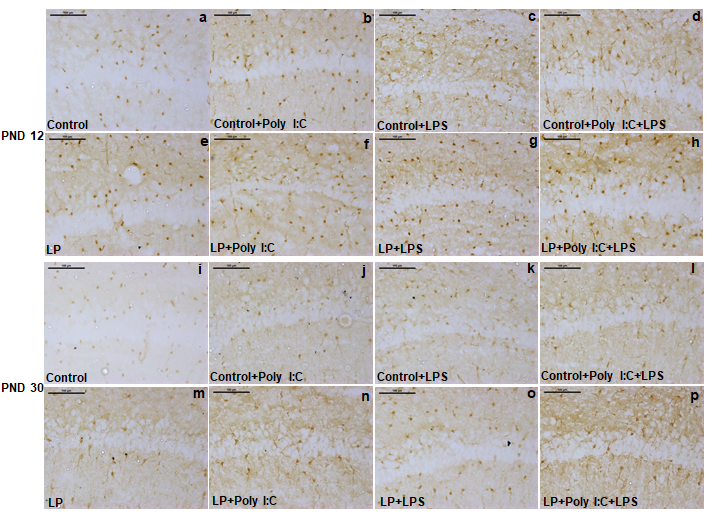
LP+Poly I:C+LPS and Control+Poly I:C+LPS groups showed maximum S100β expressing cells (d,h,l,p) when compared to rest of the groups. Control had very less S100β positive cells (a,i) at both the time points which increased in LP alone group (e,m) and following single-hit of Poly I:C and LPS in both control and LP animals, more number of S100β positive cells were seen around the CA region of the single-hit groups (b,c,j,k,f,g,n,o). However, the hype in single- hit group was less than the multi-hit group. (n=3 slides from different animals/group, scale bar=100µm).
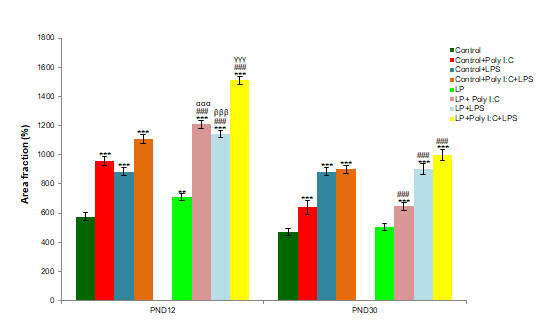
The graphs supports result observed in the microscopic S100β labeled images. From the bars it can be seen that S100β expression was highly significant in LP+Poly I:C+LPS group. (n=108 images, 3 slides from different animals/ group), values are expressed as mean±SEM; ***P≤0.001, with respect to controls; ###P≤0.001 with respect to LP alone group; αααP≤0.001 with respect to control+Poly I:C and LP+Poly I:C; βββP≤0.05 with respect to Control+LPS and LP+LPS; γγγP≤0.001 with respect to Control+Poly I:C+LPS and LP+Poly I:C+LPS.
Response of Microglia
Response of microglia in hippocampus was assessed through Iba 1, MHC II and CR 3 immunolabeling, which clearly revealed stress induced microgliosis in single and multi-hit groups. Time-points, depicting the developmental age of a rat life i.e., PND 12 and 30 were studied to check the response of microglia following exposure of early life stressors. Activated cells were distinguished from the resting ones through morphological differences. The activated cells were identified as microglia with darkly labeled soma and confined thick processes or with amoeboid morphology. Various proteins like Iba 1, MHC II, CR 3 etc. also remain upregulated in activated microglia when compared to the resting once and thus, such proteins are used as markers for analyzing microglial reactivity consequent upon stress exposure.
In the control groups most of the Iba 1 labeled cells in the CA layer were ramified with limited number of activated microglia at PND 12, (Figure 5a) and almost negligible by PND 30 (Figure 5i). Following exposure to either poly I:C or LPS to control pups (Control+Poly I:C and Control+LPS) there was a sharp increase in activated microglial cell population both at PND 12 and 30, however sizably more at PND 30 (Figure 5b,c,j,k). Interestingly, when control animals were co-exposed with both Poly I:C and LPS, most of the microglia with fragmented processes were seen leading to an overall decrease in density. Such low microglial density in Control+Poly I:C+LPS at both the time-points could be because of stress dependent damage to the overall microglial pool (Figure 5d,l).
Microglial population in all the low protein stressed groups was less responsive to any stressor (single and multiple exposures) mainly at PND 12 and all the LP groups including the LP alone (Figure 5e, m), LP+Poly I:C (Figure 5f,n), LP+LPS (Figure 5g,o) and LP+Poly I:C+LPS (Figure 5h, p) showed lower microglial density with respect to their corresponding control and control treated groups, which may suggest premature microglial degeneration along with a compromised immune response.
Control group consisted of mostly ramified microglia (a,i). In LP alone group, activated microglia (amoeboid shaped) were more prominent (e,m). Single and combined exposure of Poly I:C and LPS to both control and LP animals vigorously increased activated cells in Control+Poly I:C, Control+LPS, control+Poly I:C+LPS, LP+Poly I:C, LP+LPS and LP+Poly I:C+LPS groups (b, c, d, f, g, h, j, k, l, n, o, p), when compared to control and LP alone group respectively. However the number of cells was found to be less in LP groups when compared to the control groups. Also, the fragmented cellular processes were maximum in LP+Poly I:C+LPS group (h,p). (n=3 slides from different animals/group, scale bar=100μm) The quantitative data depicting density of Iba 1 positive cells (Figure 6) also confirms the results mentioned vide supra suggesting a compromised response in LP groups although the data was significant at various points as detailed below. When both the time-points were compared, the number of activated microglia in the studied hippocampal region of control animals following single-hit of either Poly I:C or LPS was more vigorous at PND 30 when compared to PND 12. A significant different was found between control vs. Control+Poly I:C (t(3,164)=3.5, P≤0.001; t(3,164)=7, P≤0.001), control vs. Control+LPS (t(3,164)=5.7, P≤0.001) at both PND 12 and 30 respectively. Again, following combined exposure of Poly I:C+LPS, there was a loss in overall microglial number at PND 12 but the same hyped at PND 30 when compared to control (control vs. Control+Poly I:C+LPS, t(3,164)=6.2, P≤0.001). Again, in LP animals, the response of microglia post single-hit was different in both the two time-points. At PND 12, the total population of microglia in LP+Poly I:C and LP+LPS groups were less when compared to LP alone group but at PND 30, the mentioned LP single-hit groups showed compensatory reaction and the microglial density increased when compared to LP alone group (LP vs. LP+Poly I:C, t(3,164)=3.5, P≤0.001; LP vs. LP+LPS, t(3,164)=3.7, P≤0.001). No such compensation was shown by the multi-hit group and at both the time-points studied, the overall cell population remained significantly compromised when compared to rest of the groups (LP vs. LP+Poly I:C+LPS, t(3,164)=4, P≤0.001; control vs. LP+Poly I:C+LPS, t(7, 328)=5.12, P≤0.001). Lastly, control and LP single-hit groups also showed variation within diets, regarding stress mediated microglial response. The LP groups failed to respond to stress and overall microglial population remained less when compared to their control counterparts (Control+Poly I:C vs. LP+Poly I:C, t(1,246)=3.5, P≤0.001; t(1,246)=6.6, P≤0.001; Control+LPS vs. LP+LPS, t(1,246)=4.9, P≤0.001, Control+Poly I:C+LPS vs. LP+Poly I:C+LPS, t(1,246)=11.3, P≤0.001).
The graph confirms the results seen in the microscopic representation of Iba1 labeled images (Figure 5). Among LP groups, stress mediated maximum microglial activation as well as degeneration was seen in LP+Poly I:C+LPS group at all the time-points and regions studied, showing the impact of multi-hit on microglial population. (n=108 images, 3 slides from different animals/group), values are expressed as mean±SEM; ***P≤0.001 with respect to controls; ###P≤0.001 with respect to LP alone group; αααP≤0.001 with respect to Control+Poly I:C and LP+Poly I:C; βββP≤0.05 with respect to Control+LPS and LP+LPS
Transformation of Microglia in MHC II Expressing Cells
Similar to the results of Iba immunolabelling, the OX 6 labelled cells were also discrete in LP groups, owing to overall drastically lower values of area fraction in LP and LP F1 rats exposed to viral and bacterial infection.
The microglial response following early life stress was highest at PND 30, thus to confirm the state of microglial activation, MHC II protein expression was assessed through OX 6 antibody labeling at PND 30, which revealed an increase in MHC II expression following either poly I:C or LPS or both Poly I:C and LPS exposure to control rats (Figure 7a-d). This suggested the induced transformation of resting microglia to MHC II expressing antigen presenting cells.
On the other hand, LP alone group possessed very few MHC II expressing cells (Figure 7e) when compared to control. Although there was an increase in both MHC II expressing cells and its expression following either Poly I:C or LPS or both Poly I:C and LPS exposure to LP F1 rats, the values were significantly very low when compared with the corresponding control groups (Figure 7f-h). Quantitative representation of mean area fraction data shown in (Figure 8a) further support these microscopic observations. Statistical values calculated indicate a significant difference between control vs. Control+Poly I:C, t(3,164)=9.5, P≤0.001; control vs. Control+LPS, t(3, 164)=17.3, P≤0.001 and control vs. Control+Poly I:C+LPS, t(3,164)=18.3, P≤0.001) and control vs. LP+Poly I:C+LPS, t(7, 328)=3.1, P≤0.001 (group wise interaction). Although an increase in area fraction for MHC II protein was also recorded in LP+Poly I:C, LP+LPS and LP+Poly I:C+LPS groups when compared to LP alone group, significant difference was found only between LP and LP+Poly I:C+LPS groups (interaction of treatments within LP groups, LP vs. LP+Poly I:C+LPS, t(3,164)=6.3, P≤0.001), but these values remained significantly low as compared to the respective control groups when inter group comparison was performed between Control+Poly I:C vs. LP+Poly I:C (t(1,246)=10.1, P≤0.001), Control+LPS vs. LP+LPS (t(1,246)=19, P≤0.001) and Control+Poly I:C+LPS vs. LP+Poly I:C+LPS (t(1,246)=15.2, P≤0.001) groups.
CR 3 Upregulation and Microglial Activation
Neuroinflammatory response of microglial activation was further confirmed through OX 42 immunolabeling of CR 3 protein at PND 30. The result obtained through OX 42 immunolabeling are in line with Iba1 data. Labeling of CR 3 (complement receptor) proteins gave an idea of the state of activation of the microglial cells in hippocampus of control as well as treated rats. Immune stimulation using Poly I:C and LPS led to an increase in CR 3 protein in the activated microglial cells of immune-stressed groups when compared to control (Figure 7i). CR 3 positive cells were seen frequently in LP (Figure 7m), LP+Poly I:C (Figure 7n) and LP+LPS (Fig. 7o) groups as compared to only mildly positive cells in control (Figure 7i). However, in the multi-hit groups (LP+Poly I:C+LPS), clusters of darkly labeled CR 3 positive cells along the CA layer (Figure 7p) were observed, suggesting a strong complement activation response in multi-hit rats. However, singular or cumulative exposure of both Poly I:C and LPS to control group rats presented a non-significant activation of CR 3 expression (Figure 7j-l).
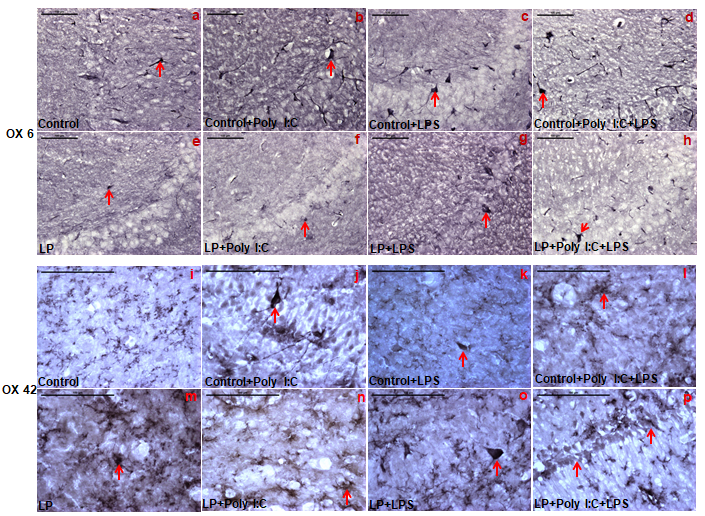
In control group, there are very few OX 6 positive cells (red arrow, a), which increased following Poly I:C and LPS exposure to control animals (b, c). On combined exposure of Poly I:C and LPS also, the OX 6 positive cells remained high in the Control+Poly I:C+LPS group (d). Again, all the respective LP groups i.e., LP, LP+Poly I:C, LP+LPS and LP+Poly I:C+LPS were found to have less OX 6 expressing cells when compared to their HP counterparts (e, f, g, h). (n=3 slides from different animals/group, scale bar=100µm).
The OX 42 labeled representative CA images of PND 30 animals shows that Control+Poly I:C, Control+LPS, LP+Poly I:C and LP+LPS groups (red arrow, j,k,n,o) had more OX 42 labeled cells when compared to control (i) and LP alone group (m) respectively. Multi-hit animals (LP+Poly I:C+LPS, p) on the other hand had maximum CR3 expression when compared to LP alone as well as single-hit LP groups. Cluster of darkly labeled cells showing intense CR3 expression are also seen in LP+Poly I:C+LPS group with comparatively less CR 3 expression in Control+Poly I:C+LPS group (l). (n=3 slides from different animals/group, scale bar=100µm).
Quantitative analysis expression (Figure 8b) also confirmed a strong CR 3 expression in LP+Poly I:C+LPS group leading to the maximum area fraction of occupied when compared to the rest of groups. However, the difference was significant in all the LP groups when compared with their respective control groups (control vs. LP, t(1,246)=4.2, P≤0.001; control vs. LP+Poly I:C+LPS, t(7, 328)=7, P≤0.001; Control+Poly I:C+LPS vs LP+Poly I:C+LPS, t(1,246)=4.7, P≤0.001). This suggests that pups born to normal protein diet fed mothers are able to resist the cumulative exposure of Poly I:C and LPS to some extent.
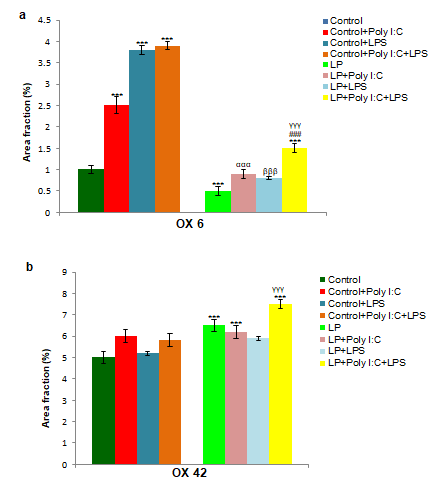
The results obtained from microphotographs (Figures 6 & 7) were further confirmed through the quantitative data. At PND 30, OX 6 and CR 3 expression was more in multi-hit groups when compared to control and single-hit groups. (n=108 images, 3 slides from different animals/group), values are expressed as mean±SEM; ***P≤0.001 with respect to controls; ###P≤0.001 with respect to LP alone group; αααP≤0.001 with respect to Control+Poly I:C and LP+Poly I:C; βββP≤0.05 with respect to Control+LPS and LP+LPS; γγγP≤0.001 with respect to Control+Poly I:C+LPS and LP+Poly I:C+LPS.
Cognitive and Behavioral Changes
Hyperactivity and Low Anxiety Assessed With Elevated Plus Maze (EPM)
The anxiety behavior of the control and stressed group rats was assessed as a measure of the ratio of time spent in the open arms to the time spent in the closed arms. An increase in open arm activity (duration and/or entries) reflects anti-anxiety like behaviour. According to the natural behavior of rats, the control animals (Figure 9a) explore both closed and open arms while avoiding the elevated open arms but the stressed animals failed to do so.
From the track report it is seen that on Poly I:C and LPS injections to the control animals, the animals belonging to Control+Poly I:C (Figure 9b), Control+LPS (Figure 9c) and Control+Poly I:C+LPS (Figure 9d) groups started to actively move along the edges of the open arms, showing hyperactivity and low anxiety like symptoms. On the other hand, LP group rats (Figure 9e) lacked natural exploratory rodent behavior when compared to control (Figure 9a). They were also not able to differentiate between open and closed arms and showed preference for open arms. Furthermore, Poly I:C and LPS exposure to LP animals either individually or in combination, further increased the open arm explorations leading to increased entries and time spent in open arms (LP+Poly I:C, LP+LPS and LP+Poly I:C+LPS groups; (Figure 9f-h).
The histograms denote the percent entries in open arms (Figure 9i) and percent time spent in open arms at PND 30 (Figure 9j). These graphical data further confirms the result mentioned vide supra. When compared to the control group, an increase in both duration and entries in open arms was seen in all the stressed groups which is considered as hyperactivity and anti-anxiety like behavior. Either Poly I:C or LPS exposure to both control and LP animals (Control+Poly I:C, Control+LPS, Control+Poly I:C+LPS, LP+Poly I:C, LP+LPS and LP+PolyI:C+LPS groups), significantly increased the time spent and entries in open arms in all the stressed groups when compared to controls (treatments within control groups and group wise interaction). However, significant difference was found only between control vs. LP+Poly I:C+LPS and LP vs. LP+Poly I:C+LPS in terms of time spent in open arms (t(7,88)=14.5, P≤0.001; t(3,44)=13.4, P≤0.001), denoting severity of multi-hit stress over behavioral abilities.
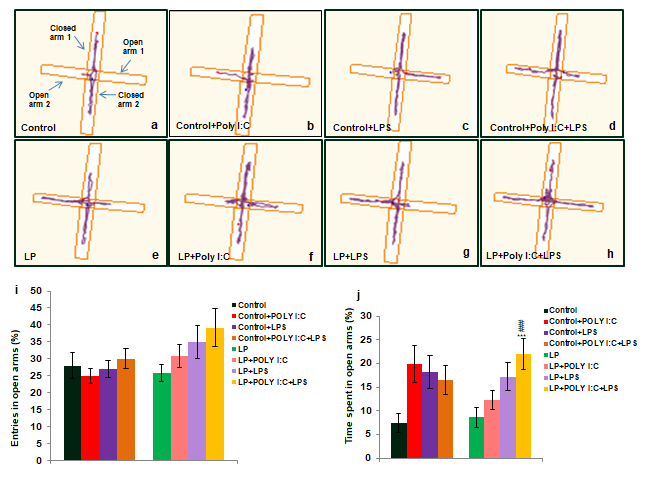
Normal exploratory behavior of rats was seen in control group (a), whereas animals from the remaining stressed groups preferred to explore open arms over closed arms (b, c, d, e, f, g). Such biasness towards open arms was highest in LP+Poly I:C+LPS (multi-hit) group (h). From the entries in open arms and time spent in open arms graphs (i,j), it can be seen that maximum behavioral deficit was shown by LP+Poly I:C+LPS group by choosing and spending more time in the open arms. (n=12 animals/group), values are expressed as mean±SEM; ***P≤0.001; ###P≤0.001, with respect to LP and LP+Poly I:C+LPS.
Hyperactivity and Low Anxiety Further Assessed With Open-Field Teat (OFT)
The representative track records depict hyperactivity and anti-anxiety like behavior in stressed groups. In contrast to the control animals (Figure 10a), the stressed group rats also explored along the central arena of the OFT chamber, suggesting an increase in central zone activity in addition to the normal peripheral zone exploration. Moreover, these stressed group rats moved across the open field arena and did not show any thigmotactic track pattern. In both control and LP group rats exposed to either Poly I:C or LPS, hyperactivity was seen in terms of increased exploration and distance travelled (Figure 10b,c,f,g). The multi-hit rats (LP+Poly I:C+LPS) showed restless behavior with a highly significant increase in distance travelled and exploration throughout the open field area (Figure 10h), suggesting a hyperactive and low anxiety phenotype as these animals repeatedly moved around restlessly, when compared to control as well as Control+Poly I:C+LPS group (Figure 10a,d). The graphical data representing parameters like distance travelled (10i), resting time (Figure 10j), stereotypic time and ambulatory time (Figure 10k.l), further confirms the above observations and also strengthens the EPM data. Statistical data showing the significance of the results in given in Supplementary (Table 1).
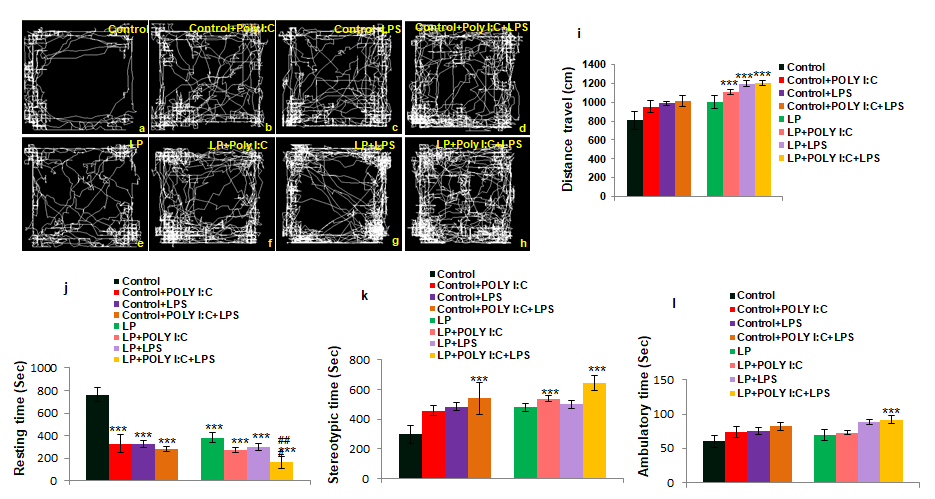
From the tracks, it was seen that control (a) animals normally explored the open arena whereas LP animals travelled more (e), abnormally travelling along the open arena. Poly I:C and LPS exposure either as single-hit or in combination to both control and LP animals led to an abnormal and hyperactive behavior in the stressed groups when compared to control and LP alone group respectively (b, c, d, f, g, h). Again, such abnormal movement was seen One Way ANOVA (comparison with Control) Control vs. LP+Poly I:C
$$ \mathrm {F} (7, 8 8) = 2 9 8, \mathrm {P} \leq 0. 0 0 1 \quad \mathrm {F} (3, 4 4) = 4 9 3, \mathrm {P} \leq 0. 0 0 1 \quad \mathrm {F} (7, 8 8) = 2 3 9, \mathrm {P} \leq 0. 0 0 1 \quad - $$ Control vs. LP+LPS
$$ \mathrm {F} (7, 8 8) = 3 8 8, \mathrm {P} \leq 0. 0 0 1 \quad \mathrm {F} (7, 8 8) = 4 6 3, \mathrm {P} \leq 0. 0 0 1 \quad - \quad - $$ Control vs. LP+Poly I:C+LPS
$$ F (7, 8 8) = 3 9 9, P \leq 0. 0 0 1 F (7, 8 8) = 6 0 2, P \leq 0. 0 0 1 F (7, 8 8) = 3 4 6, P \leq 0. 0 0 1 F (7, 8 8) = 3 1, P \leq 0. 0 0 1 $$ Two way ANOVA (comparison between diet and infections) Control vs. HP+Poly I:C - F(3,44)= 434, P≤0.001 - - Control vs. HP+LPS - F(3,44)= 440, P≤0.001 - - Control vs. HP+Poly I:C+LPS - F(3,44)= 485, P≤0.001 F(3,44)=243, P≤0.001 - LP vs. LP+Poly I:C - - - - LP vs. LP+LPS - - - - to be maximum in LP+Poly I:C+LPS group (h). From the distance travelled (i), resting time (j), stereotypic time (k) and ambulatory time (l) graphs also similar result was observed with LP+Poly I:C+LPS animals showing maximum low anxiety and hyperactivity like behavior. (n=12 animals/ group), values are expressed as mean±SEM; ***P≤0.001, with respect to controls and ###P≤0.001 with respect to LP.
PND 30
Distance Travelled Resting Time Stereotypic Time Ambulatory Time
| LP vs. LP+Poly I:C+LPS | - | F(3,44)= 220, P≤0.001 | - | - |
|---|---|---|---|---|
| Control vs. LP | - | F(1,66)= 381, P≤0.001 | - | - |
| Control+Poly I:C vs. LP+Poly I:C | - | - | - | - |
| Control+LPS vs. LP+LPS | - | - | - | - |
| Control+Poly I:C+LPS vs. LP+Poly I:C+LPS | - | - | - | - |
Table 1: The table contains One Way and Two-Way ANOVA tests derived F values for significant comparison among groups in Open Fiel
Spatial Memory Deficits as Revealed by T Maze and MWM Tests
T Maze
Deficit in spatial memory was observed in all the stressed groups at PND 30. The track records clearly show that the stressed animals made multiple errors and were unable to differentiate the right arm from the left arm. Such deficits were most prominent in the multi-hit group rats (LP+Poly I:C+LPS) (Figure 11h) as compared to control, LP alone (Figure 11e) and other stressed groups (Figure 11b,c,d,f,g). The histogram showing the path efficiency data (Figure 11i) depicts the efficiency of the animals to procure the reward. Path efficiency of the multi-hit (LP+Poly I:C+LPS) group rats was the poorest, suggesting that spatial memory impairment was maximum and the difference was highly significant in these animals as compared to control and all other stressed groups (control vs. LP+Poly I:C+LPS, t(3,44)=0.4, P≤0.001; LP vs. LP+Poly I:C+LPS, t(3,164)=0.2, P≤0.001 and Control+Poly I:C+LPS vs. LP+Poly I:C+LPS, t(1,66)=0.2, P≤0.001).
Significant difference in path efficiency was observed between control and LP alone group (t(1,66)=0.2, P≤0.001) and following either Poly I:C or LPS exposure to both control and LP animals, the difference in path efficiency significantly declined in Control+Poly I: C(t(3,44)=0.1, P≤0.001) Control+LPS (t(3,44)=0.2, P≤0.001) and LP+LPS (t(7,88)=0.2, P≤0.001) animals when compared to control.
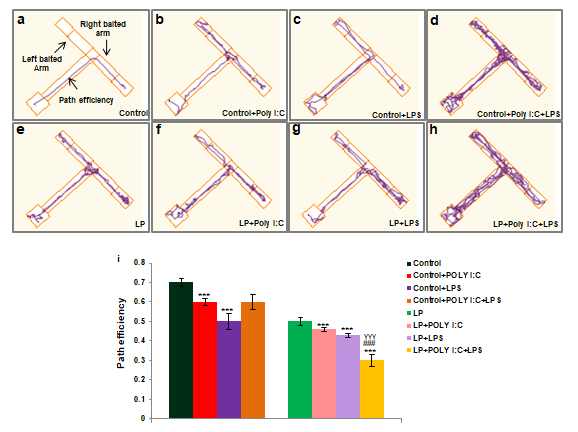
Complicated tracks indicating poor memory was prominent in LP+Poly I:C+LPS group (h). LP alone animals also had indirect and complicated tracks (e) which further deteriorated on Poly I:C or LPS treatment (f, g). Control animals on Poly I:C and LPS infusion (b,c,d) also showed incorrect tracks when compared to HP control (a) but again, the damage in tracks of control animals were less than the LP animals.
The data obtained from the path efficiency graph (i) also tallies with the result mentioned above. From the graph it can be seen that LP+Poly I:C+LPS group had minimum path efficiency when compared to rest of the groups. (n=12/ group). Values are expressed as mean±SEM; ***P≤0.001 with respect to controls; ###P≤0.001, with respect to LP; γγγP≤0.001 with respect to control+Poly I:C+LPS and LP+Poly I:C+LPS.
MWM
Similar to the T maze results, MWM test also revealed severe spatial memory deficits in multi-hit group rats. These animals showed very high latency and poor path efficiency to locate the hidden platform. The representative track reports clearly depicts that these animals followed indirect trajectory taking a long-time and bypassing many potential routes committing multiple errors to reach the hidden platform (Figure 12h), suggesting poor path efficiency and an impaired spatial memory. The impairment of memory was directly proportional to the chronicity of stress and the LP, single- hit LP and control groups also showed mild impairments in path efficiency (Figure 12b-g). Graphs representing latency (Figure 12i) and mean path efficiency (Figure 12j) also depict the maximum latency and lowest path efficiency, denoting severely impaired memory conditioning when compared to the remaining groups.
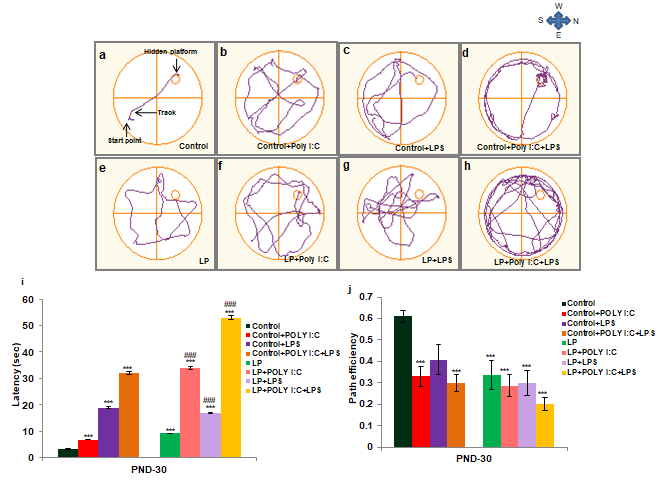
From the tracks it is seen that LP alone group (e) followed indirect path to the platform showing poor memory when compared to control (a). On Poly I:C and LPS infusion to both HP and LP animals, the spatial memory condition decreased and the stressed animals took complicated and indirect path while reaching the platform (b, c, d, f, g, h). Such complications and memory impairment were maximum in LP+Poly I:C+LPS group (h). The latency and path efficiency graph (i,j) also shows similar result as mentioned above. (n=12/group). Values are expressed as mean±SEM; ***P≤0.001 with respect to control; ###P≤0.001 with respect to LP.
Significant difference was found between LP alone group and control in terms of both path efficiency and latency. The impairment in LP alone group further increased following either Poly I:C or LPS exposure when compared
- to control. Singular and combined exposure of Poly I:C and
- LPS also affected both path efficiency and latency in control single-hit animals but was comparatively less than their
- LP counterparts. Statistical data is given in supplementary
- (Table 2).
- One Way ANOVA (comparison with Control)
- PND 30
- Path efficiency
- Latency
- Control vs. LP+Poly I:C
- F(7,856)=0.3, P≤0.001
- F(7,856)=30.6, P≤0.001
- Control vs. LP+LPS
- F(7,856)=0.3, P≤0.001
- F(7,856)=13.6, P≤0.001
- Control vs. LP+Poly I:C+LPS
- F(7,856)=0.4, P≤0.001
- F(7,856)=49.6, P≤0.001
- Two way ANOVA (comparison between diet and infections)
- Control vs. HP+Poly I:C
- F(3,44)=0.2, P≤0.001
- F(3,44)=3.5, P≤0.001
- Control vs. HP+LPS
- -
- F(3,44)=15.6, P≤0.001
- Control vs. HP+Poly I:C+LPS
- F(3,44)=0.3, P≤0.001
- F(3,44)=28.6, P≤0.001
- LP vs. LP+Poly I:C
- -
- F(3,44)=24.8, P≤0.001
- LP vs. LP+LPS
- -
- F(3,44)=7.8, P≤0.001
- LP vs. LP+Poly I:C+LPS
- -
- F(3,44)=43.8, P≤0.001
- Control vs. LP
- F(3,44)=0.2, P≤0.001
- F(3,44)=5.8, P≤0.05
- Control+Poly I:C vs. LP+Poly I:C
- -
- -
- Control+LPS vs. LP+LPS
- -
- -
- Control+Poly I:C+LPS vs. LP+Poly I:C+LPS
- -
- -
Table 2: F values obtained from One Way and Two-Way ANOVA tests, showing significant difference among groups in Morris
Discussion
A developing brain is jammed with a cascade of developing events which includes cellular proliferation, maturation and migration, thus making the developing system highly vulnerable to even a minutest insult during perinatal development. In this study, maternal protein malnourished groups of rats were observed to have altered glial morphology (astrocytes and microglia) and cognitive and behavioral abilities when compared to controls. Moreover, such altered conditions worsened in protein malnourished animals following co-exposure to Poly I:C and LPS either singularly or in combination. Poly I:C and LPS were also exposed to control animals which also led to cellular, cognitive and behavioral changes but to the limited extent than the LP groups. Even in schizophrenia, the involvement of glial cells is well reported. While neurodegeneration is common to all neurodegenerative disorders, glial dysfunction contributes to both neurodegeneration as well as altered synaptic functioning, a typical observation in a schizophrenic brain [24].
Astrocytes, a component of macroglia, support neurons and resist homeostatic changes in brain following exposure to any stressor [25, 26]. Both astrocytes and neurons have common neuroepithelial origin as they develop from common progenitor cells. Astrogenesis occur only after neurogenesis subsides and first appear in rat brain during E16 (embryonic day 16) and continue to be generated actively till postnatal day 30 [6]. Astrogenesis is triggered by both intrinsic and extrinsic factors like members of IL-6 superfamily, notch signaling pathway, BMP4 (bone morphogenetic protein-4) etc. [27]. On inclining towards astrocytic fate, the stem cells starts to express astrocyte specific protein marker like GFAP and S100β while differentiating into different astrocytic types and migrating to specific brain region [27, 28]. This occurs during critical perinatal developmental age and exposure to any stressor during this crucial age leads to altered astrogenesis and astrocytic migration [29] which can also cause premature astrocytic death.
In this investigation, perinatal exposure to Poly I:C and LPS was observed to increase astrocytic response in hippocampus of control animals in terms of both GFAP upregulation and number of astrocytes. Both viral and bacterial infections during perinatal period are reported to cause compromised healthy astrocytic development, leading to premature cellular activation or astrogliosis [17, 30, 31].
Singh and co-workers [17], reported that exposure to LPS may lead to the death of activated astrocytic due to glutamate excitotoxicity. Moreso, astrocytes react to both local and systemic signals, including hormonal changes, nutrition, neurotransmitter etc [25, 29] reported that maternal protein malnourishment result in compromised progenitor pooling due to A2B5+ glial precursor cell restriction in the ventricles along with low BLBP+ gliosphers in the subventricular zone leading to lower astrocytic population and their precocious maturation in embryonic rat brains. Such delayed astrogenesis following protein malnourishment [22, 32] is reported to be further hampered with either viral or bacterial infection. The astrocytes that are formed after exposure to protein stress get further activated through the innate branch of the immune system.
Innate branch of immunity plays major role against both viral and bacterial infection during the perinatal age, via activation of Toll like receptors (TLRs) causing inflammation and irreversible changes in the brain [33]. As per [34] TLR 3 in astrocytes respond to Poly I:C via MDA-5 (melanoma differentiation-associated gene 5) pathway and further activates NF-κB. Neurotrophic viruses, such as Flavivirus, that infect astrocytes also causes astrogliosis, leading to severe viral encephalopathy [35]. Even in case of ZIKA virus infection, astrocytes are the early target in developing brain [36]. LPS, a bacterial mimetic activates TLR 4 thus trigger the innate branch of immunity [37]. In addition, LPS is also reported to decrease S100β secretion in brain tissue within 24 hrs. If its exposure along with a hype in GFAP protein [38]. This observation suggests the loss of normal astrocytic functioning following bacterial infection. Furthermore, in our study, following multi-hit of Poly I:C and LPS infection to LP animals, the astrogenesis was hampered with a triggered astrogliosis [39] have also reported that a combined exposure of maternal separation stress and bacterial infection leads to an elevated corticosterone levels and reduced astrocytic density in PND 15 rat pups, which suggests that multiple hits can further influence astrocyte integrity. Our results also indicate increased astrogliosis along with a significantly compromised astrocyte population following multi-hit exposure, which is in line with the observations of [40] who have reported that chronic stress induced through immobilization in rat results in reduced GFAP +ve astrocytes in the amygdala along with a decrease in astrocytic volume. Decrease in astrocytic number due to astrogliosis is also reported to be associated with Schizophrenia [41, 42]. This suggests that compromised astrocytic population following early life multi-hit exposure may have severe consequences to nervous system functioning at adulthood.
In contrast to astrocytes, microglia are the cells which are majorly responsible for triggering inflammation in the brain. Neuroinflammation is another important scenario that is correlated with schizophrenia. Microglia reacts vigorously following exposure to any early life stressors [43]. As per microglial hypothesis of schizophrenia proposed by Monji and associates [44], amplified activation of microglia result in a hype in free radicals and proinflammatory cytokines, which is a major contributing factor pf the disease. As reported widely, nutritional stress leads to a compromised immune system causing an activation of proinflammatory cytokines and microglia in developing rat brain. Such cellular activation is reported to be because of microstructural damage to astrocytes as well as white matter [45]. Additionally, dietary malnutrition in mice also exhibits a decreased microglial volume which further affected the brain areas surveyed by the microglia [46]. Microgliosis was also reported following maternal protein malnourishment [20] and Poly I:C infusion into the lateral ventricle of rats [47]. Thus, the persistent microglial activation following early life exposure to Poly I:C and LPS to both control and LP animals observed in this study suggest the long-term impact of such exposures on brain function. However, comparatively lower response to such exposures in LP animals mainly at PND 12 may be because maternal protein malnourishment leads to the compromised immune system of the progeny [22]. Furthermore, a compensatory response was seen at PND 30 in all the single-hit groups whereas, multi-hit group failed to express any such response may be because of the chronicity of stress. Chronic stress is reported to act on microglia in two ways i.e., either by damaging the phagocytic ability of the cells or by causing hyper activation, leading to premature death of the cells [48, 49, 50]. This is evident from the overall loss of MHC II expressing cells in all the LP group animals at PND 30 that accounted for a low mean area fraction data as compared to control. Although MHC II expression was elevated in both LP+Poly I:C and LP+LPS exposed animals but the area fraction remained low due to a drastic decrease in MHC II expressing population. Protein malnourishment during development is reported to weaken the immune system that might be the reason for low microglial number in LP animals [22]. Surprisingly, the CR 3 protein expression was comparatively higher in LP animals. As CR 3 protein is a marker for active phagocytic microglia thus it can be stated that the limited number of microglia that were present in the LP group were all in the activated forms.
Such glial changes observed following perinatal multi-hit stress were also seen to negatively impact both behavioral and cognitive abilities in young animals. Schizophrenia being a neuropsychiatric disorder is accompanied by cognitive and behavioral impairments [51]. The impaired glial outcome and functioning observed following early life exposure of multiple stressors directly lead to the behavioral and cognitive dysfunctions [15, 18, 20, 52]. Following maternal protein malnourishment, both astrogenesis and microglial reactivity was observed to be affected which further deteriorated following single and multi-hit of Poly I:C and LPS. This deterioration in the glial homeostasis can directly affect the neuronal cytoarchitecture and connectivity resulting in poor cognitive and behavioral abilities [15, 53]. Maternal protein malnourishment has been reported to cause impairment of learning and memory along with hyperactivity like behavior in young and adult F1 generation rats [3, 20]. Similarly, perinatal exposure of either Poly I:C or LPS also causes impairment of both behavioral and cognitive abilities in affected adult rats [17, 19] and when all these stressors are combined together, the impairment are much hyped in young rats mainly because of the chronicity of the stress. Several studies with chronic stress also reported similar results [54, 55, 56] which again are common to patients with schizophrenia.
Thus, it is suggested, that exposure to a single-hit may cause changes in the cytoarchitecture of the brain, but cumulative multi-hit exposure completely alters the brain homeostasis causing both cellular inflammation and degeneration simultaneously. Such early life multi- hit exposure can potentially predispose an individual to develop full blown schizophrenia during adulthood although prominent symptoms are expressed during a very young age.
Conclusion
From the overall study we can interpret that exposure to early life stressors in multi-hit form leads to development of symptoms which are similar to that of schizophrenia. Furthermore, when compared between single and multi- hit stressors, the effect of multi-hit exposure during the perinatal age was severe and it can be said that a combined exposure of both maternal protein malnourishment and immune stress can fast forward the symptoms or result in development of Schizophrenia in affected individuals.
Authors Contribution
Prof. I. K. Patro conceptualized and implemented the research. Dr. Nisha Patro and Dr. Tiyasha Sarkar performed the experiments. The initial manuscript was written by Dr. Tiyasha Sarkar which was corrected and finalized by Dr. Nisha Patro.
Conflict of Interest
None
Acknowledgements
The authors are thankful to Indian Council of Medical Research (ICMR), New Delhi, India for funding.
References
-
Palmer BW, Dawes SE, Heaton RK (2009) What do we know about neuropsychological aspects of schizophrenia? Neuropsycology Rev 19(3): 365-384.
-
Kantrowitz JT (2021) How do we address treating the negative symptoms of schizophrenia pharmacologically? Expert Opin Pharmacother 22(14): 1811-1813.
-
Naik AA, Patro IK, Patro N (2015) Slow physical growth, delayed reflex ontogeny, and permanent behavioral as well as cognitive impairments in rats following intra- generational protein malnutrition. Front Neurosci 9: 446.
-
Chaiyachati BH, Gur RE (2021) Effect of child abuse and neglect on schizophrenia and other psychotic disorders. Pharmacol Biochem Behav 206: 173195.
-
Kulaga SS, Miller CWT (2019) Viral respiratory infections and psychosis: a review of the literature and the implications of COVID-19. Neurosci Biobehav Rev 127: 520-530.
-
Sarkar T, Patro N, Patro IK (2019) Cumulative multiple early life hits-a potent threat leading to neurological disorders. Brain Res Bull 147: 58-68.
-
Sarkar T, Patro N, Patro IK (2022) Perinatal exposure to synergistic multiple stressors leads to cellular and behavioral deficits mimicking Schizophrenia-like pathology. Biol Open 11(3): bio058870.
-
Guerrin CGJ, Doorduin J, Sommer IE, de Vries EFJ (2021) The dual hit hypothesis of schizophrenia: Evidence from animal models. Neurosci Biobehav Rev 131: 1150-1168.
-
Jiang X, Nardelli J (2016) Cellular and molecular introduction to brain development. Neurobiol Dis 92(Pt A): 3-17.
-
Rahimi-Balaei M, Bergen H, Kong J, Marzban H (2018) Neuronal migration during development of the cerebellum. Front Cell Neurosci 12: 484.
-
Bayraktar OA, Fuentealba LC, Alvarez-Buylla A, Rowitch DH (2015) Astrocyte development and heterogeneity. Cold Spring Harb Perspect Biol 7(1): a020362.
-
Menassa DA, Gomez-Nicola D (2018) Microglial dynamics during human brain development. Front Immunol 9: 1014.
-
Verney C, Monier A, Fallet-Bianco C, Gressens P (2010) Early microglial colonization of the human forebrain and possible involvement in periventricular white‐matter injury of preterm infants. J Anat 217(4): 436-448.
-
Patro N, Naik A, Patro IK (2015) Differential temporal expression of S100β in developing rat brain. Front Cell Neurosci 9: 87.
-
Sarkar T, Patro N, Patro IK (2020) Neuronal changes and cognitive deficits in a multi-hit rat model following cumulative impact of early life stressors. Biol Open 9(9): bio054130.
-
Roberts BL, Karatsoreos IN (2021) Brain-body responses to chronic stress: a brief review. Fac Rev 10: 83.
-
Sharma A, Patro N, Patro IK (2016) Lipopolysaccharide- induced apoptosis of astrocytes: therapeutic intervention by minocycline. Cell Mol Neurobiol 36(4): 577-592.
-
Singh K, Patro N, Pradeepa M, Patro I (2017) Neonatal lipopolysaccharide infection causes demyelination and behavioral deficits in adult and senile rat brain. Ann Neurosci 24(3): 146-154.
-
Baghel MS, Singh B, Patro N, Khanna VK, Patro IK, et al. (2019) Poly (I: C) exposure in early life alters methylation of DNA and acetylation of histone at synaptic plasticity gene promoter in developing rat brain leading to memory impairment. Ann Neurosci 26(3-4): 35-41.
-
Sinha S, Patro N, Tiwari PK, Patro IK (2020) Maternal Spirulina supplementation during pregnancy and lactation partially prevents oxidative stress, glial activation and neuronal damage in protein malnourished F1 progeny. Neurochem Int 141: 104877.
-
Schaible UE, Kaufmann SH (2007) Malnutrition and infection: complex mechanisms and global impacts. PLoS Med 4(5): e115.
-
Chertoff M (2015) Protein malnutrition and brain development. Brain Disord Ther 4(3): 1-6.
-
Hawkes CH, Del Tredici K, Braak H (2007) Parkinson’s disease: a dual‐hit hypothesis. Neuropathol Appl Neurobiol 33(6): 599-614.
-
Bernstein HG, Steiner J, Guest PC, Dobrowolny H, Bogerts B, et al. (2015) Glial cells as key players in schizophrenia pathology: recent insights and concepts of therapy. Schizophr Res 161(1): 4-18.
-
Naik AA, Patro N, Seth P, Patro IK (2017) Intra- generational protein malnutrition impairs temporal astrogenesis in rat brain. Biol Open 6(7): 931-942.
-
Siracusa R, Fusco R, Cuzzocrea S (2019) Astrocytes: role and functions in brain pathologies. Front Pharmacol 10: 1114.
-
Sloan SA, Barres BA (2014) Mechanisms of astrocyte development and their contributions to neurodevelopmental disorders. Curr Opin Neurobiol 27: 75-81.
-
Akdemir ES, Huang AY, Deneen B (2020) Astrocytogenesis: where, when, and how. F1000Res 9.
-
Abbink MR, van Deijk AF, Heine VM, Verheijen MH, Korosi A, et al. (2019) The involvement of astrocytes in early‐life adversity induced programming of the brain. Glia 67(9): 1637-1653.
-
De Miranda J, Yaddanapudi K, Hornig M, Lipkin WI (2009) Astrocytes recognize intracellular polyinosinic‐ polycytidylic acid via MDA‐5. FASEB J 23(4): 1064-1071.
-
Lana D, Ugolini F, Nosi D, Wenk GL, Giovannini MG, et al. (2021) The emerging role of the interplay among astrocytes, microglia, and neurons in the hippocampus in health and disease. Front Aging Neurosci 13: 651973.
-
Cresto N, Pillet LE, Billuart P, Rouach N (2019) Do astrocytes play a role in intellectual disabilities? Trends Neurosci 42(8): 518-527.
-
Zheng W, Xu Q, Zhang Y, E X, Gao W, et al. (2020) Toll- like receptor-mediated innate immunity against herpesviridae infection: A current perspective on viral infection signaling pathways. Virol J 17(1): 199.
-
De Miranda J, Yaddanapudi K, Hornig M, Villar G, Serge R, et al. (2010) Induction of Toll-like receptor 3-mediated immunity during gestation inhibits cortical neurogenesis and causes behavioral disturbances mBio 1(4): e00176- 10.
-
Potokar M, Jorgačevski J, Zorec R (2019) Astrocytes in flavivirus infections. Int J Mol Sci 20(3): 691.
-
Schouest B, Peterson TA, Szeltner DM, Scheef EA, Baddoo M, et al. (2021) Transcriptional signatures of Zika virus infection in astrocytes. J Neurovirol 27(1): 116-125.
-
Firmal P, Shah VK, Chattopadhyay S (2020) Insight into TLR4-mediated immunomodulation in normal pregnancy and related disorders. Front Immunol 11: 807.
-
Guerra MC, Tortorelli LS, Galland F, Da Ré C, Negri E, et al. (2011) Lipopolysaccharide modulates astrocytic S100B secretion: a study in cerebrospinal fluid and astrocyte cultures from rats. J Neuroinflammation 8: 128.
-
Saavedra LM, Navarro BF, Torner L (2017) Early life stress activates glial cells in the hippocampus but attenuates cytokine secretion in response to an immune challenge in rat pups. Neuroimmunomodulation 24(4-5): 242-255.
-
Naskar S, Chattarji S (2019) Stress elicits contrasting effects on the structure and number of astrocytes in the amygdala versus hippocampus. eNeuro 6(1).
-
De Keyser J, Mostert JP, Koch MW (2008) Dysfunctional astrocytes as key players in the pathogenesis of central nervous system disorders. J Neurol Sci 267(1-2): 3-16.
-
Notter T (2021) Astrocytes in schizophrenia. Brain Neurosci Adv 5.
-
Madore C, Yin Z, Leibowitz J, Butovsky O (2020) Microglia, lifestyle stress, and neurodegeneration. Immunity 52(2): 222-240.
-
Monji A, Kato T, Kanba S (2009) Cytokines and schizophrenia: Microglia hypothesis of schizophrenia. Psychiatry Clin Neurosci 63(3): 257-265.
-
Rideau Batista Novais A, Pham H, Van de Looij Y, Bernal M, Mairesse J, et al. (2016) Transcriptomic regulations in oligodendroglial and microglial cells related to brain damage following fetal growth restriction. Glia 64(12): 2306-2320.
-
Bauer KC, York EM, Cirstea MS, Radisavljevic N, Petersen C, et al. (2022) Gut microbes shape microglia and cognitive function during malnutrition. Glia 70(5): 820- 841.
-
Patro IK, Amit, Shrivastava M, Bhumika S, Patro N (2013) Poly I: C induced microglial activation impairs motor activity in adult rats. Indian J Exp Biol 48(2): 104-109.
-
Block ML, Hong JS (2007) Chronic microglial activation and progressive dopaminergic neurotoxicity. Biochem Soc Trans 35(5): 1127-1132.
-
Walker FR, Nilsson M, Jones K (2013) Acute and chronic stress-induced disturbances of microglial plasticity, phenotype and function. Curr Drug Targets 14(11): 1262-1276.
-
Ghosh S, Geahlen RL (2015) Stress granules modulate SYK to cause microglial cell dysfunction in Alzheimer’s disease. EBioMedicine 2(11): 1785-1798.
-
Jablensky A (2010) The diagnostic concept of schizophrenia: its history, evolution, and future prospects. Dialogues Clin Neurosci 12(3): 271-287.
-
Bilbo SD, Schwarz JM (2012) The immune system and developmental programming of brain and behavior. Front Neuroendocrinol 33(3): 267-286.
-
Jacob J, Kent M, Benson-Amram S, Herculano-Houzel S, Raghanti MA, et al. (2021) Cytoarchitectural characteristics associated with cognitive flexibility in raccoons. J Comp Neurol 529(14): 3375-3388.
-
Rincel M, Aubert P, Chevalier J, Grohard PA, Basso L, et al. (2019) Multi-hit early life adversity affects gut microbiota, brain and behavior in a sex-dependent manner. Brain Behav Immun 80: 179-192.
-
Hayley S, Sun H (2021) Neuroimmune multi-hit perspective of coronaviral infection. J Neuroinflammation 18(1): 231.
-
Liu L, Wu J, Geng H, Liu C, Luo Y, et al. (2022) Long-term stress and trait anxiety affect brain network balance in dynamic cognitive computations. Cereb Cortex 32(14): 2957-2971.
- hMPV: Is It Another Covid-19 Like Situation?
- Streptomyces: Sources of Novel Discoveries in Antibiotic Research to Combat Antimicrobial Resistance
- A Review of Mosquitoes (Diptera: Culicidae) and Their Biodiversity, Medical and Veterinary Importance
- Past and Current Immunotherapy in Cancer
- Hematological Cancer and Viral Infection
- The Growing Threat of Antimicrobial Resistance in India: Challenges and Solutions