Smartphone and Smartwatch for Human Activity Recognition
Human activity recognition (HAR) systems are developed as aspect of a model to allow continual assessment of human behaviors in IoT environments in the areas of ambient assisted living, sports injury detection, elderly care, rehabilitation, and entertainment and close monitoring. Smartphones are already used to recognize activity. Most of the research done in this field placed a restriction on fixing the smartphone securely in a certain location on the human body, along with the machine learning system, to promote the process of classifying raw data from smartphone sensors to human activities. Smartwatches solve this limitation by placing them in a consistent position, which becomes steady and precisely sensitive to body movements. For this experiment, we evaluate both the accelerometer and the gyroscope sensor on the smartphone and the smartwatch, and decide which sensors hybrid does superiorly. Five daily physical human activities are evaluated using five classifiers from WEKA, in addition to Artificial Neural Network (ANN), K- Nearest Neighbor (KNN), and Support Vector Machine (SVM) algorithms builtin MATLAB 2018a. We used confusion matrix and random simulation to compare the accuracy and efficiency of those models. The results showed that the accelerometer sensors combination has the highest accuracy among other combinations and achieved an overall accuracy of 97.7% using SVM that gives the best performance among all other classifiers.
Introduction
Human Activity Recognition (HAR) is the challenge of recognizing a physical activity conducted within a given environment by an individual based on a trace of movement. HAR in an automated way is basic in many ambient intelligence applications such as smart homes [1], health monitoring [2, 3], assistance applications, emergency services, and transportation assistance services [4]. It is predicted that smart environments, which communicate with the disabled or elderly according to their specific needs, will be a correlative fraction of everyday life in the short term. Given that the global rise in the older people ratio is firmly significant, the aging in place has been of extreme significance. The economic consequences of international senility can be mitigated by encouraging the overages to remain energetic and stable in their homes for long years, where living free is more normal and restful [5]. Unfortunately, increasing elderly population makes it infeasible for all homes of elderly people to assign a human caretaker, where the need to manage health by oneself in cooperation with healthcare professionals is unavoidable.
The smartphone has recently become an integral part of human regular activities and is turning into an increasingly sophisticated system with rising processing capacity, network functionality and sensing abilities. Many as 25% of people used a smartphone in 2015, and held their phone wherever they went [6]. It also includes a large range of hardware sensors such as accelerometer, gyroscope, compasses, barometer, temperature, humidity, light sensor, and GPS receiver. Mobile health technology is the interchange of eHealth and mobile technology [7]. Smartphone sensors have turned into a data source to track different human behaviors, for example, physical activities such as running, walking, walking upstairs, and downstairs. The analysis of these behaviors can be used to monitor consumer safety and supply health care services on time. The key constraint imposed by the current systems is to firmly attach the smartphone to the human body in order to get the best performance from the raw data of the smartphone sensors. In reality, this is not a practical solution, because the user often needs to serve for calling, using the internet, social media, etc. on the mobile, which means keeping the device in various places and then being subjected to dramatic movements. This technique involves the readings controlled by inertial sensors on the device, which could then display incorrect results. Smartwatches that are worn in a consistent location [8], tackle this restriction.
The key technological justification for using the smartwatch is to hold the smartwatch sensors (accelerometer and gyroscope coordinates) in a location that is stable and critical to movements of the human body. In other words, the aforementioned smartwatch sensors can fit out more generalized and distinct features to be utilized for outcomes that are more reliable in the system of recognition of human activity.
Advances in machine and deep learning techniques for selecting features besides the addition of a variety of sensors will move the limits of recognition of human behavior to deeper epistemological levels. This project tackles the above challenges by collecting and preprocessing available to the public benchmark data, after which we use machine learning and deep learning to predict and accurately and efficiently recognize daily life activities. Our project describes the activity recognition task and the procedure for performing this task using different machine learning algorithms including WEKA data mining, artificial neural network (ANN), K-nearest neighbor (KNN), and support vector machine (SVM), where we consider five activities: walking, jogging, stairs (ascending and descending), sitting, and standing.
The remainder of the article is constructed as follows. Section II introduces a literature review of human activity recognition. The methodology proposed for the built framework is outlined in Section III, the outcomes of the experiments are given in Section IV, and Section V sums up our conclusion and explores scopes of future research.
Literature Review
With ever greater computing capabilities, flexible Internet connections and various mobile apps, smartphones have become an integral part of our daily lives, as described above. Furthermore, even cheaper smartphones have a variety of sensors (accelerometer, GPS, and gyroscope, etc.) that allow human activities to be detected using a smartphone. Oscar Lara and Miguel [9] Lobrador introduce the Waikato Environment for Knowledge Analysis (WEKA), which is definitely the most well recognized resource within the research community of machine learning. This provides enforcements of many learning algorithms and enables them to be readily tested for a dataset using, among others, cross- validation and random break. Therefore, it helps in solving HAR.
Most articles use extractions of features different from what we have employed in this project. Zhenyu and Lianwen [10] describe a high-precision HAR method that uses discrete cosine transformation (DCT), Principal Component Analysis (PCA), and Support Vector Machine (SVM) to distinguish various individual activities. Vollmer C, et al. [11] have used Shift-invariant Sparse Coding Algorithm for activity recognition. SVM algorithm was implemented by Cho J, et al. [12] to identify walking, moving up stairs, moving down stairs, running, and motionless. The characteristics picked from the measuring system data were standard deviation of Y-axis, Y-axis correlation, Z-axis correlation, Y-axis autoregressive fitting and signal magnitude area (SMA). Additionally, the mean, standard deviation, and pitch skew were chosen for classification. Boyle, et al. [13] suggested a gait-based method for the identification of walking behaviors. The wavelet transformation was used to obtain characteristics from raw data, and the classification was carried out using the K-Nearest Neighbors (KNN) algorithm. WEKA data mining was also used to identify and classify HAR using some of the classifier algorithms (such as Bayes, Functions, Lazy, Meta, Mi, Misc, Rules, and Trees) [14]. Some datasets were generated by researchers, submitted, and used by others across the world. WISDM (Wireless Sensor Data Mining) is a Fordham University published dataset, which includes data gathered under controlled and laboratory conditions [15]. Only the accelerometer installed in the mobile phone is used to collect data. The sampling rate is 20Hz and the total instance count is 1,098,207. There are six features (user index, type of activity, time stamp, x, y and z-accelerations). The collection task involves twenty-nine subjects. Six tasks are classified (walking (38.6%), jogging (31.2%), upstairs (11.2%), downstairs (9.1%), sitting (5.5%), and standing (4.4%)). Time-domain characteristics are elicited from the raw time series data in the publisher’s research, such as the average value, standard deviation, average absolute difference, average resulting acceleration, peak time, and binned distribution. In a comparative study Maguire and Frisby [16] used Weka Toolkit for behavior detection to compare the output between KNN and J48 / C4.5. We also found that KNN achieves greater overall performance by using 10-fold cross-validation in various experiment settings.
Recently, several studies have suggested knowledge incorporation strategies that integrate various sensor styles or algorithms to enhance validity, reliability, draw trust measures between different algorithms, and minimize the complication of the recognition system to tackle the obstacles connected to individual sensor approaches and boost the generalization [17].
Smartwatches have become more widespread in the market-place and this trend is expected to continue as the technology develops. A survey found that over 80% of smartwatch users said safe living and access to medical services are major advantages of wearable technology [18]. There are several HAR studies in the literature that concentrate on smartphones, and more lately on smartwatches [19, 20, 21]. Smartwatches offer the set of motion data with a more reliable user, since it is often securely placed to the user (i.e. it is worn on either left or right hand) regardless of their choice of clothing. Consequently, smartwatches give the option to accurately and reliably acquire motion data from the user as smartphones might do. Bhattacharya S [20] has explored the smartwatch-centric recognition of movement and the potential of incorporating deep learning in wearable devices. It was indicated that smartwatch facilitated by GPU could provide profound implementation of the learning. The system executed on wristwatch accomplished high reliability for typical day-to-day operation such as hand movement, inner/outer location, and public-dataset conveyance pattern.
In modern methods of acknowledgment of human activities for smartphone and worn sensors, attribute representation techniques employ carefully designed extraction and selection processes that are extracted properly employing specialists domain expertise. These extracting features approaches, however, are based on task or application, and cannot be transferred to similar pattern behavior. In addition, carefully designed vector features are difficult to analyze complicated operation data and require time-consuming extraction of features [22, 23]. Many ways like multimodal integration and decision mixing are used to achieve diversity and flexible functionality for performance generalization of human activity recognition across diverse domains. Nevertheless, issues surrounding the perfect fusion techniques still remain and that affect achieving higher generalization with reduced computing time for smartphone and wearable sensor integration.
Studies have provided insight into techniques, which require automatic extraction of attributes with minimal human potential using deep learning techniques to solve the above problems [24]. This technique is a novel path of machine learning, which constitutes high-level data attributes. It has been a significant stream in recognition of human activity. It involves several layers of neural networks, which hierarchically reflect features from inferior to superior. It has become a vital work domain in image and object recognition, the processing of modest speech, computer interpretation and circumferential surveillance [25]. More recently, different methods of deep learning have been suggested for the identification of human behavior based on smartphone and wearable sensors. Such deep learning techniques can be piled into various layers to create deep learning templates that deliver improved system execution, resilience, strength and eliminate the necessity to rely on standard handmade attributes. Deep learning for analysis of time series has recently been examined [26, 27]; another highly associated field in the recognition of human behavior. Nevertheless, the author picked a wider perspective of time series usage of deep learning that include words understanding, classification of the sleep period, and detection of anomalies. On the other hand, this review [28] concentrated on recognition of human activity depending on deep learning algorithms using mobile or worn sensor data, describing the mechanisms for promoting deep learning- based recognition of human activity and providing a detailed overview on the approaches, implementation method, and attribute teaching methods.
The Activity Recognition Task
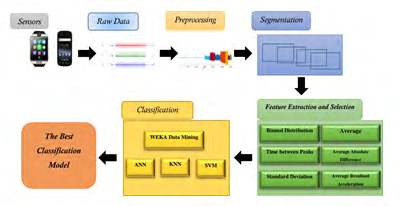
This section illustrates how the classification process was done. Figure 1 shows the fundamental framework of human activity recognition process.
Data Collection
The dataset employed in this project is the” WISDM Smartphone and Smartwatch Activity and Biometrics Dataset” found in UCI machine learning repository website [29]. It consists of data collected from 51 healthy subjects, and each one performed 18 tasks for 3 minutes each. Each one had smartwatch worn on his dominant hand, and a smartphone in his pocket. The collected sensor data was from the accelerometer and the gyroscope on the smartphone and the smartwatch, yielding four total sensors. The smartphone was Google Nexus 5/5X or Samsung Galaxy S5 and the smartwatch was the LGG Watch.
Raw Time-Series Sensor Data
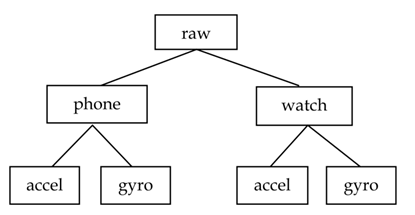
The raw time-series sensor data was collected by the accelerometer and gyroscope on the smartphone and smartwatch at a rate of 20Hz (i.e., every 50ms). So, there are four sensors abbreviated as watch-gyro, watch-accel, phone- gyro, and phone-accel, as shown in figure 2.
Within each sensor subdirectory, there is a file for each subject, so there are 51 files in each of the four subdirectories. The files were named as follows:
- data_1600_accel_phone.txt
- data_1634 _ gyro_watch.txt The first component is fixed and is always “data”. The second part is for the subject number and ranges between 1600 to 1650. The third component is either” accel” or” gyro” to describe the sensor type, and the fourth component is” phone” or” watch” to define the device on which the sensor belongs.
Transformed Activity Examples and Generated Features
The raw data was split into 10-second non-overlapping segments for each sensor (per subject and per activity) and then high-level features are created based on the 200 (10s*20 readings/s) readings stored within each segment.
A 10-second window has been conducted in order to gain sufficient time to capture multiple repetitions of those activities regarding repetitive movements, and is small enough to provide rapid response [15]. The examples included in this data set have 93 features but only 43 most informative features were chosen, which are variant of six basic features [30]:
- Binned Distribution [30]: For each axis, the range of values in the 10s window (max-min value) is located, this range is divided into 10 equal-sized bins, and then the fraction of values is recorded in each bin (per axis).
- Average [3]: Average sensor value (each axis).
- Time between Peaks [3]: Time in milliseconds between the peaks in the wave associated with most activities. Heuristically determined (per axis).
- Average Absolute Difference [3]: Average absolute difference between the each of 200 readings and the mean of those readings (per axis).
- Standard Deviation [3]: Standard deviation (per axis).
- Average Resultant Acceleration [1]: Resultant is computed by squaring each matching x, y, and z value, summing them, taking the square root, and then averaging these values over the 200 readings.
Data Preprocessing
Only five activities from the eighteen activities were selected in each file, which are: walking, jogging, stairs (ascending and descending), sitting, and standing. Such tasks were chosen because many people practice them frequently in their everyday routines. At first, data were imported into MATLAB 2018a to read each file in each sensor subdirectory. The formatting information was then removed from the start of each file, and the remaining 13 unnecessary activities were deleted. After that, readings from the 51 subjects were collected and put in one file for each sensor, separately. After one file for each sensor was generated, they were integrated to provide the five combinations of the four sensors, which are:
1) Phone: Phone acceleration+phone gyroscope (PA+PG). 2) Watch: Watch acceleration+watch gyroscope (WA+WG). 3) Accl: Phone acceleration+watch accelerometer (PA+WA). 4) Gyros: Phone gyroscope+watch gyroscope (PG+WG). 5) All: Phone acceleration+phone gyroscope+watch acceleration+watch gyroscope (PA+PG+WA+WG).
The merging process of different files, for example, Phone acceleration and phone gyroscope, started with merging each one of the five activities in the first file for each subject with the corresponding activity and subject in the second file. In case the number of samples in each file is different, the minimum number of the two was chosen to avoid having missing values in the merged file. After that, the columns of the unwanted features and the column of the subject number in the single and merged data files are removed, and each file is saved in CSV file to be read by WEKA. The number of instances produced for each class forming the dataset used for the training and testing is shown in table 1.
| Used Sensors | Walk | Jog | Stairs | Sit | Stand | Total |
|---|---|---|---|---|---|---|
| PA | 1271 | 1314 | 1180 | 1263 | 1283 | 6311 |
| PG | 1260 | 1311 | 1194 | 1153 | 1323 | 6241 |
| WA | 1011 | 993 | 997 | 1028 | 1046 | 5075 |
| WG | 915 | 902 | 865 | 939 | 934 | 4555 |
| PA+PG | 931 | 963 | 942 | 979 | 965 | 4780 |
| WA+WG | 915 | 901 | 864 | 938 | 933 | 4551 |
| PA+WA | 882 | 867 | 1074 | 1171 | 1188 | 5182 |
| PG+WG | 863 | 868 | 850 | 460 | 1349 | 4390 |
| PA+PG+ PA+PG | 863 | 867 | 858 | 904 | 886 | 4378 |
| Sum | 8911 | 8986 | 8824 | 8835 | 9907 | 45463 |
| % | 19.6 | 19.8 | 19.4 | 19.4 | 21.8 | 100 |
Table 1: Number of Instances per used Sensors and Activity.
Evaluation Methods
WEKA Data Mining Method
Once the dataset was ready, the WEKA data-mining suite [31] utilized five classification techniques to trigger user activity prediction models: Multilayer Perceptron (MP), Decision Tree (J48), Random Forest (RF), k-Nearest Neighbors (KNN), Logistic Regression (LR). In addition, ZeroR classifier was used for baseline performance that acts as a point of reference and predicts the class value that has the most observations in the training dataset. In each case, the default settings and 70% split were used, where the data is divided randomly into 70% training data, and 30% testing data.
ANN-Multilayer Perceptron Algorithm
ANN model is a feed-forward artificial neural network model that consists of input, output, and multiple hidden layers made of several units called neurons that transform the input into something that the output layer can use. These hidden layers of multilayer network will extract a different set of high-level features until it can recognize what is looking for. At first, each data file was split into 30% testing data and 70% training data. The Sigmoid function was used for the hidden layers as an activation function, and for the output layer as a linear function. To specify the size of neurons in each layer, the procedure has been started with one layer and increased the number of neurons gradually until the accuracy started to decrease or it does not show any change, so the value of neurons was fixed. Then, the process was repeated for the second layer to know the number of neurons used in it. After that, another layer was added but the accuracy started to decrease, therefore it was eliminated, so the model had two layers where the first layer had 20 neurons and the second layer had 10 neurons, as shown in figure 3.
K-Nearest Neighbor Algorithm
KNN is a major technique that can be used for recurring activities as simple as that. KNN is a tool of classification which acts as a form of direct classification, as it does not embrace a learning approach. KNN classifies an unknown object based on the value of k by counting the number of its nearest neighbors. The KNN algorithm operates on the concept of resemblance (distance) among the training dataset and the classification of a new instance. The distance of a measurement neighbor is determined using a location information of similarity function, such as the distance from Euclidean function. The unknown instance shall be classified as the most common class among its k nearest neighbors. At first, data was split as in the previous section to 70% training data and 30% testing data, and then KNN algorithm was built to classify a new observation from testing data. The value of the k was one.
Support Vector Machine Algorithm
Support vector machine is by many a simple and highly favored algorithm, as it produces large accuracy with less computing power. The support vector machine algorithm’s objective is to locate a hyperplane in an N-dimensional space (N- the number of features) that separately identifies the relevant data. Data was first split into training and testing data, 70% of the data was used for training and the rest 30% was used for testing. Then, the SVM model was built. Since SVM is a binary algorithm, one of the strategies has been used to reduce the multiclass classification problem to multiple binary classification problem, which is one vs all strategy. This technique includes learning a single classifier per class, with the class instances being positive instances and the remainder instances being negative. This layout allows the ground classifiers to generate a real-valued trust result for its decision, instead of only a class label. Bayesian Optimization was used to optimize the SVM classification using the fitcsvm function and Optimize Hyper parameters name-value pair.
Results and Discussion
WEKA Models Evaluation
The extracted outcomes for our experiments are shown in Table 2. This table provides the accuracy level of all the activities in each data type, for each of the specified learning classifiers. Table 2 confirms that high level of accuracies can be obtained in many states. For merged data of smartphone and smartwatch accelerometers and merged data from all sensors, we generally achieve accuracies above 97%. The phone can perform well on its own and give good efficiency, while using the watch separately provides much lower achievement in all used classifiers. For activity recognition, the gyroscope sensors harmonically do even worse than the accelerometer sensors.
| Used Sensors | MP | J48 | RF | KNN | LR | ZeroR |
|---|---|---|---|---|---|---|
| PA | 93.9 | 92.6 | 95.6 | 95.1 | 87.6 | 19.0 |
| PG | 74.4 | 78.3 | 85.8 | 78.3 | 68.8 | 19.5 |
| WA | 91.0 | 87.7 | 93.2 | 89.8 | 88.2 | 19.4 |
| WG | 79.1 | 76.7 | 82.1 | 76.1 | 75.2 | 20.1 |
| PA+PG | 95.3 | 90.5 | 96.0 | 96.0 | 89.7 | 18.5 |
| WA+WG | 91.9 | 88.8 | 93.5 | 92.2 | 88.8 | 18.6 |
| PA+WA | 97.4 | 94.1 | 97.6 | 97.3 | 93.6 | 22.8 |
| PG+WG | 83.0 | 88.2 | 91.7 | 88.3 | 86.5 | 30.8 |
| PA+PG+ PA+PG | 92.5 | 92.6 | 95.8 | 97.4 | 94.5 | 20.4 |
Table 2: Overall Accuracies of Weka Classifiers for Activity Recognition using 43 Features.
Table 3 provides the results and confusion matrix for merged data of smartphone and smartwatch accelerometers using Random forest classifier only since it has the highest accuracy. On the other hand, the most incorrect classification occurs when the classifier predicts stairs, where 12 of 285 walking activity are misclassified as stairs and 1 of 260 jogging activity is misclassified as stairs. Moreover, 7 of 342 sitting activities are misclassified as stairs, and 2 of 254 standing activity are misclassified as stairs. That indicates it is the hardest activity to be recognized.
| Random Forest | Predictive Activity | |||||
|---|---|---|---|---|---|---|
| Walk | Jog | Stairs | Sit | Stand | ||
| Actual Activity | Walk | 273 | 0 | 12 | 0 | 0 |
| Jog | 1 | 257 | 1 | 1 | 0 | |
| Stairs | 5 | 2 | 307 | 0 | 0 | |
| Sit | 0 | 0 | 7 | 331 | 4 | |
| Stand | 0 | 0 | 2 | 2 | 350 | |
| Accuracy% | 95.8 | 98.8 | 97.8 | 96.8 | 98.9 | |
| Precision% | 97.8 | 99.2 | 93.3 | 99.1 | 98.9 |
Table 3: Activity Recognition Accuracy and Confusion Matrix for Merged Accelerometers using Random Forest Classifier.
ANN, KNN and SVM Models Evaluation
In this part, an analysis of the implementation of ANN, KNN, and SVM classifiers models in terms of accuracy and precision is introduced. Table 4 illustrates the performance of the three algorithms using nine different sensor combinations data.
ANN algorithm was built using MATLAB and incorporated a tuning of hyper parameters where the number of layers and number of neurons were adjusted. The retained performance is good as in previous WEKA results. To understand the effect of varying combinations of these motion sensors, the recognition accuracy for ANN algorithm was evaluated with single and combined sensors data, as shown in Table 4. As expected, we obtained the best accuracy when both accelerometer sensors of smartphone and smartwatch were used together, achieving approximately 96.6% classification accuracy. When phone accelerometer accuracy compared to all sensors accuracy, both have similar accuracies. This indicates that phone accelerometer has good performance compared with other sensors. In addition, phone sensors show better performance compared to watch sensors.
| Used Sensors | ANN Accuracy % | KNN Accuracy % | SVM Accuracy % |
|---|---|---|---|
| PA | 94.0 | 89.7 | 95.6 |
| PG | 80.5 | 69.0 | 93.5 |
| WA | 91.5 | 88.7 | 92.5 |
| WG | 82.1 | 71.5 | 81.6 |
| PA+PG | 95.1 | 88.1 | 96.4 |
| WA+WG | 92.3 | 85.5 | 94.1 |
| PA+WA | 96.6 | 95.1 | 97.7 |
| PG+WG | 85.6 | 69.6 | 90.7 |
| PA+PG+ PA+PG | 93.8 | 93.8 | 97.7 |
Table 4: Overall Classification Accuracy for Different Sensors Data using Three Algorithms, Individually.
KNN algorithm was applied to analyze different sensors data that was got from smartphone and smartwatch sensors. A k value of 1 was used. As we increased the value of k, the accuracy became less. Table 4 shows that KNN gives less accuracy for different sensors compared to the ANN algorithm. Furthermore, similarly to the ANN test, the highest accuracy of both accelerometer sensors was 95.1%, however, the result for each sensor separately has weak performance. In addition, merging the gyroscope sensors did not give higher accuracy, to the contrary, it has worse performance.
In the proposed approach of SVM, the classification is used to identify user activity based on different sensors and their combinations. We used multiclass Support Vector Machine with RBF kernel, which gave the best results. Table 4 depicts the accuracy of different sensors combinations resulted from SVM algorithm. This algorithm provided the best performance for different sensors data compared with other algorithms, and the accelerometer sensors of smartphone and smartwatch gave the optimum accuracy when used together, achieving approximately 97.7%. The same accuracy was obtained when all sensors used together.
Consequently, phone accelerometer provides better
performance compared with other single sensors. Watch sensors have worse classification than phone sensors, since the watch is more related to hand movement than to body movement. Integrated gyroscope sensors give very bad results compared to integrated accelerometer sensors, because gyroscope is not so easily accessed in smartphones and smartwatches as accelerometer.
In this analysis, the confusion matrices of each model with combined data from accelerometer sensors were developed in order to examine the results in detail, where detailed accuracy and precision tests are also given for each class. 5182 research instances were tested with about the same number of instances per class. The confusion matrices imply that the uncertainty between walking-stairs and sitting-standing activity pairs causes many of the predictive errors.
Tables 5-7 show that the most ineffective recognition of the tests results by the KNN method. The walk activity is mixed with stairs. Hence, the KNN classifier fails to identify these events, which means that about 8% of the walk and stair event classifications are ineffective. This is because of the correlation of the acceleration data patterns between “walking” and “stairs”. Additionally, KNN misclassifies standing as being sitting. We managed to run a further series of experiments using ANN and SVM to restrict the confusion between those activity pairs.
| ANN | Predictive Activity | |||||
|---|---|---|---|---|---|---|
| Walk | Jog | Stairs | Sit | Stand | ||
| Actual Activity | Walk | 257 | 0 | 18 | 1 | 0 |
| Jog | 0 | 258 | 1 | 0 | 0 | |
| Stairs | 8 | 2 | 308 | 2 | 1 | |
| Sit | 1 | 0 | 5 | 351 | 4 | |
| Stand | 1 | 0 | 1 | 8 | 327 | |
| Accuracy% | 93.1 | 99.6 | 96.0 | 97.2 | 97.0 | |
| Precision% | 96.3 | 99.2 | 92.5 | 97.0 | 98.5 |
Table 5: Confusion Matrix of Accelerometer Sensors Data using ANN Algorithm.
By evaluating the confusion matrix for both the KNN algorithm with that of the ANN algorithm, we realize that in terms of overall accuracy, the ANN algorithm surpasses the KNN algorithm. Using the ANN algorithm instead of the KNN algorithm, an improvement of 1.5% in overall accuracy is attained. The ANN algorithm further increases the precision of the walking and stairs classification by 3.9% and 2.0%, respectively. However, the sitting and standing classes are still found to be misclassified since both of them have no real movement or a transition in x and y directions, and only the change comes in z.
| KNN | Predictive Activity | |||||
|---|---|---|---|---|---|---|
| Walk | Jog | Stairs | Sit | Stand | ||
| Actual Activity | Walk | 254 | 1 | 17 | 0 | 4 |
| Jog | 2 | 252 | 4 | 1 | 0 | |
| Stairs | 18 | 0 | 297 | 3 | 3 | |
| Sit | 1 | 1 | 3 | 351 | 5 | |
| Stand | 0 | 0 | 7 | 5 | 325 | |
| Accuracy% | 92.0 | 97.3 | 92.5 | 97.2 | 96.4 | |
| Precision% | 92.4 | 99.2 | 90.5 | 97.5 | 96.4 |
Table 6: Confusion Matrix of Accelerometer Sensors Data using KNN Algorithm.
Table 7 reflects the confusion matrix arising from SVM classification of the integrated accelerometer sensors. The results are significantly improved and they have shown that SVM is more accurate than other algorithms. It has reached
100% accuracy for jogging activity even though stairs are still the most difficult activity to recognize. In terms of precision, the SVM algorithm executes by 1.6% and 3.1%, respectively better than the ANN and KNN algorithms.
| SVM | Predictive Activity | |||||
|---|---|---|---|---|---|---|
| Walk | Jog | Stairs | Sit | Stand | ||
| Actual Activity | Walk | 268 | 0 | 8 | 0 | 0 |
| Jog | 0 | 259 | 0 | 0 | 0 | |
| Stairs | 2 | 5 | 312 | 2 | 0 | |
| Sit | 0 | 0 | 4 | 356 | 1 | |
| Stand | 0 | 0 | 0 | 4 | 333 | |
| Accuracy% | 97.1 | 100.0 | 97.2 | 98.6 | 98.8 | |
| Precision% | 99.3 | 98.1 | 96.3 | 98.3 | 99.7 |
Table 7: Confusion Matrix of Accelerometer Sensors Data using SVM Algorithm.
For more details about each smartphone and smartwatch accelerometer sensor, Tables 8 & 9 respectively show the confusion matrices built using SVM model for these sensors. The confusion between the activities mentioned above can be obviously observed. It can also be found that the phone accelerometer shows greater overall accuracy compared to watch accelerometer and has the ability to differentiate between the activities where certain confusion exists. However, the watch accelerometer has more potential than the phone accelerometer to identify jogging activity and significantly minimize the uncertainty between jogging and other activities such as walking and stairs. This is because the hand movement in jogging is very distinct and has higher acceleration values than walking or stairs that makes the accelerometer of the watch better than the accelerometer of the phone in differentiating between such activities. For integrated accelerometer sensors as in table 7, the overall accuracy and the ability to distinguish between the activities where their confusion occurs is better than the case when using each accelerometer sensor individually, achieving overall accuracy of 97.7%.
| SVM | Predictive Activity | |||||
|---|---|---|---|---|---|---|
| Walk | Jog | Stairs | Sit | Stand | ||
| Actual Activity | Walk | 343 | 10 | 27 | 1 | 1 |
| Jog | 2 | 385 | 2 | 1 | 0 | |
| Stairs | 0 | 9 | 342 | 0 | 1 | |
| Sit | 0 | 3 | 4 | 371 | 5 | |
| Stand | 1 | 0 | 3 | 5 | 377 | |
| Accuracy % | 89.8 | 98.7 | 97.2 | 96.9 | 97.7 | |
| Precision % | 99.1 | 94.6 | 90.5 | 98.2 | 98.2 |
Table 8: Confusion Matrix of Phone Accelerometer Data using SVM Algorithm.
| SVM | Predictive Activity | |||||
|---|---|---|---|---|---|---|
| Walk | Jog | Stairs | Sit | Stand | ||
| Actual Activity | Walk | 268 | 2 | 28 | 0 | 1 |
| Jog | 0 | 293 | 0 | 1 | 0 | |
| Stairs | 25 | 8 | 255 | 0 | 0 | |
| Sit | 2 | 0 | 4 | 309 | 5 | |
| Stand | 2 | 1 | 2 | 25 | 291 | |
| Accuracy% | 89.6 | 99.7 | 88.5 | 96.6 | 90.7 | |
| Precision% | 90.2 | 96.4 | 88.2 | 92.2 | 98.0 |
Table 9: Confusion Matrix of Watch Accelerometer Data using SVM Algorithm.
Conclusion
The combination of data from the smartphone and smart- watch accelerometer and gyroscope sensors evaluated the subset of sensors to know which are the most accurate in identifying a given set of activities. Initially, we investigated the performance of five different classifiers using WEKA, after that we assessed the performance of different sensor combinations using ANN, KNN, and SVM algorithms, showing that SVM is more accurate among them. This project further demonstrates that the maximum performance would be resulted from the smartphone and smartwatch accelerometer sensors integrated together. The research highlighted in this project can be extended by adding many more activities with that training data. Additionally, the application of deeper learning to this problem would be very successful, where it would have the capacity to advance the performance by inevitably developing basic representations of features.
Acknowledgment
The authors would like to thank Electrical and Biomedical Engineering Departments, JUST, Irbid, Jordan for their support.
References
-
Soulas J, Lenca P, Thépaut A (2015) Unsupervised discovery of activities of daily living characterized by their periodicity and variability. Engineering Applications of Artificial Intelligence 45: 90-102.
-
Candás JLC, Peláez V, López G, Fernández MA, lvarez EA, et al. (2014) An automatic data mining method to detect abnormal human behaviour using physical activity measurements. Pervasive and Mobile Computing 15: 228-241.
-
Tentori M, Favela J (2008) Activity-aware computing for healthcare. IEEE Pervasive Computing 7(2): 51-57.
-
Alemdar H, Ersoy C (2010) Wireless sensor networks for healthcare: A survey. Computer networks 54(15): 2688- 2710.
-
Dobriansky PJ, Suzman RM, Hodes RJ (2007) Why population aging matters: A global perspective. National Institute on Aging, National Institutes of Health, US Department of Health and Human Services, US Department of State.
-
(2006) Number of mobile phone users worldwide from 2015 to 2020. Statista Research Department.
-
Adibi S (2015) Mobile health: a technology road map. Springer.
-
Ali HM, Muslim AM (2016) Human activity recognition using smartphone and smartwatch. Int J Comput Eng Res Trends 3(10): 568-576.
-
Lara OD, Labrador MA (2012) A survey on human activity recognition using wearable sensors. IEEE communications surveys & tutorials 15(3): 1192-1209.
-
He Z, Jin L (2009) Activity recognition from acceleration data based on discrete consine transform and svm. IEEE International Conference on Systems, Man and Cybernetics, pp: 5041-5044.
-
Vollmer C, Gross HM, Eggert JP (2013) Learning features for activity recognition with shift-invariant sparse coding. International conference on artificial neural networks, pp: 367-374.
-
Cho J, Kim J, Kim T (2012) Smart phone-based human activity classification and energy expenditure generation in building environments. Proceedings of the 7th international symposium on sustainable healthy buildings, pp: 97-105.
-
Boyle M, Klausner A, Starobinski D, Trachtenberg A, Wu H (2011) Poster: Gait-based smartphone user identification. Proceedings of the 9th international conference on Mobile systems, applications and services, pp: 395-396.
-
Ayu MA, Ismail SA, Matin AFA, Mantoro T (2012) A comparison study of classifier algorithms for mobile- phone’s accelerometer based activity recognition. Procedia Engineering 41: 224-229.
-
Kwapisz JR, Weiss GM, Moore SA (2011) Activity recognition using cell phone accelerometers. ACM SIGKDD Explorations Newsletter 12(2): 74-82.
-
Maguire D, Frisby R (2009) Comparison of feature classification algorithm for activity recognition based on accelerometer and heart rate data. Technological University Dublin.
-
Pires IM, Garcia NM, Pombo N, Flórez Revuelta F (2016) From data acquisition to data fusion: A comprehensive review and a roadmap for the identification of activities of daily living using mobile devices. Sensors 16(2): 184.
-
Al Naffakh N (2017) A comprehensive evaluation of feature selection for gait recognition using smartwatches. International Journal for Information Security Research 6(3): 691-700.
-
Halbmayer P (2015) Wrist-worn activity recognition based on smart watches. Johannes Kepler University, Linz.
-
Bhattacharya S, Lane ND (2016) From smart to deep: Robust activity recognition on smartwatches using deep learning. 2016 IEEE International Conference on Pervasive Computing and Communication Workshops (PerCom Workshops), pp: 1-6.
-
Shoaib M, Bosch S, Incel OD, Scholten H, Havinga PJ (2016) Complex human activity recognition using smartphone and wrist-worn motion sensors. Sensors 16(4): 426.
-
Yang J, Nguyen MN, San PP, Li XL, Krishnaswamy S (2015) Deep convolutional neural networks on multichannel time series for human activity recognition. 24th International Joint Conference on Artificial Intelligence.
-
Ronao CA, Cho SB (2016) Human activity recognition with smart- phone sensors using deep learning neural networks. Expert systems with applications 59: 235- 244.
-
LeCun Y, Bengio Y, Hinton G (2015) Deep learning. Nature 521(7553): 436-444.
-
Guo Y, Liu Y, Oerlemans A, Lao S, Wu S, et al. (2016) Deep learning for visual understanding: A review. Neurocomputing 187: 27-48.
-
Gamboa JCB (2017) Deep learning for time-series analysis. arXiv preprint arXiv: 1701.01887.
-
La¨ngkvist M, Karlsson L, Loutfi A (2014) A review of unsupervised feature learning and deep learning for time-series modeling. Pattern Recognition Letters 42: 11-24.
-
Nweke HF, Teh YW, Al Garadi MA, Alo UR (2018) Deep learning algorithms for human activity recognition using mobile and wearable sensor networks: State of the art and research challenges. Expert Systems with Applications 105: 233-261.
-
Weiss GM (2019) Wisdm smartphone and smartwatch activity and biometrics dataset data set. UCI Machine Learning Repository.
-
Weiss GM, Yoneda K, Hayajneh T (2019) Smartphone and smartwatch-based biometrics using activities of daily living. IEEE Access 7: 133190-133202.
-
Witten IH, Frank E (2002) Data mining: practical machine learning tools and techniques with java implementations. ACM SIGMOD Record 31(1): 76-77.
- Origin, Evolution, and Functional Impact of Short Insertion- Deletion Variants in Human Genomes: A Review
- Harnessing Molecular Glues for Next-Generation Vaccine, Cancer and Cardiovascular Disease Drug Development: A Comprehensive Review
- Lateral Cervical Epidermal Inclusion Cyst in a Paediatric Patient: A Rare Case Report
- Malarial Plasmodium Falciparum with Hepatitis B and C Virus Infections among Blood Donors in Ife Central Local Government Area, Ile Ife, Osun State, Nigeria
- Withanolides and Withaferin A- What’s next in Ashwagandha Research
- Designing of Dual Pulse Photoacoustic Tomography for Imaging of Drug-Response and Tumor Growth