Stable Carbon and Nitrogen Isotopes of A Sentinel Species, the Western Alaska Red Fox (Vulpes Vulpes)
Mercury (Hg) is a metal of both natural and anthropogenic origins that bioaccumulates in wildlife. Environmental risk assessments to arctic wildlife, such as the red fox (Vulpes vulpes), often use mercury analysis of hair due to its minimally invasive sampling method. The fate and transport of Hg provides refined risk assessment information. Stable carbon and nitrogen isotopes in hair and other tissues from 65 members of a wild, free-ranging population of red foxes in western Alaska were investigated to establish the trophic position for a northern red fox population in western Alaska. Hair stable isotopes δ13C correlated with stable isotope values from bone and muscle. Stable isotope ratios of the wild red fox are distinct from published farmed red fox data. Data demonstrated that hair δ15N positively correlated with hair total mercury levels. The western Alaska red fox consumes a diet of rodents and birds, which agrees with stable isotope data. The data establishes a baseline for monitoring changes in trophic level patterns as climate change impacts the red foxes’ food web.
Introduction
The red fox (Vulpes vulpes) is considered a generalist predator [1, 2, 3], whose movements are usually driven by local, seasonal food availability. The red fox expanded its range to the Arctic regions of the far north during the 20th century [4, 5, 6]. Found throughout Alaska, red fox are considered abundant on the Yukon Kuskokwim river delta [7]. Because of their abundance and value, red fox are ranked as the most important species to trappers in western Alaska and second most important overall statewide [8].
Red fox food sources consist of rodents, invertebrates, fruit, and even anthropogenic garbage in urban settings [9, 10, 11]. Red fox survive in a variety of ecosystems from semi- arid deserts to the [1] feeding on a wide range of prey species specific to their habitat [12, 13, 14]. In Alaska, the natural habitat provides red back voles (Myodes rutilus) and other microtine rodents, shrews (Sorex cinereus), wood frogs (Rana sylvatica), black fish (Dalia pectoralice), and birds, such as willow ptarmigans (Lagous lagopus) [13, 15]. Historically, foxes were captured and farms established to produce fur for the retail clothing market. Over time, the farms also became associated with some behavioral and domestication studies [16]. Stable isotope analysis is a common tool used to trace pathways of organic matter through the food chain [17]. The stable isotope ratios reflect dietary sources from coastal, terrestrial, benthic and pelagic environments [18, 19]. Differences in carbon stable isotope ratios (13C/12C) arise in the photosynthetic pathways of C3 and C4 plants [20, 21]. In western Alaska, the native vegetation is exclusively composed of C3 plants [22]. The animals’ tissue isotopes reflect naturally occurring stable isotope values in both local diet and seasonal patterns [15, 23]. The difference in carbon isotopes [24, 25] can distinguish wild foods from processed animal kibble or human food in their diet. The stable nitrogen isotope (15N/14N) is used to identify food web structures [12, 26, 27, 28].
Besides general isotopic incorporation, stable isotope ratio can also discriminate between an animal’s diet and accumulation of nutrient values in various tissues [29, 30, 31]. Each tissue incorporates the nutrients from diet differently as each tissue is influenced by different turnover rates [32]. The δ15N signature is incorporated into tissues at a slower rate when herbivores consume a nitrogen-poor diet [33]. An animal’s feeding ecology also determines the uptake of contaminants, such as mercury [3, 34, 35, 36].
In this study, we used stable isotopes to test the hypothesis that hair could be used to monitor food chain changes within the red foxes’ ecosystem. We additionally hypothesized that the stable isotopes would be correlated between hair, muscle and tissue. Thieszen, et al. [37] noted that muscle tissue infers diet one to two months prior to sampling and bone collagen infers past diet and increases in mercury. Since winter hair begins growing in August and is fully prime by late November or early December [12, 38, 39], contaminants like mercury, accumulated during late summer, would be observed. Analysis of seasonal impacts on fox tissues infer past diet, increases in mercury bioaccumulation help identify changes in the environment or feeding patterns. Roth and Hobson [12] reported stable isotope data for captive red foxes raised on a commercial pellet diet. A qualitative comparison, using wild foxes from western Alaska would add to Roth and Hobson’s foundational concept of using stable isotopes to monitor food webs.
Materials and Methods
Sample Preparation
A total of 200 red fox carcasses were donated during the period of November 2010 through February 2011. Trappers anonymously and voluntarily provided carcasses to the Alaska Department of Fish and Game (ADF&G) in Bethel, Alaska. Carcasses remained frozen and were stored outside at the ADF&G office (temperature was continuously below 0°C).
Frozen carcasses were transported to the University of Alaska Fairbanks (UAF) where they were stored at -20 ̊C. Carcasses were partially thawed and sub-samples of liver, muscle, and one whole kidney, femur, and rear paw with fur were collected into Whirl-PakTM bags and stored at -20 ̊C (liver, muscle, kidney, rear paw) and -80°C (femur). All samples were collected from the right side of the carcass using stainless steel scalpels or scissors. Only foxes with all five available tissues were analyzed for stable isotope analysis. Based on these criteria, 65 foxes were used in this study, 35 males and 30 females.
Approximately 14 g of frozen liver was cut into small pieces (~1 cm3). The entire quadricep muscle was removed from the femur bone while partially frozen, and cut into small pieces. For dissection of cortex and medulla, kidneys were kept partially frozen on a clean stainless steel tray placed on ice. All instruments used to separate renal cortex and medulla (scalpels and trays) were also kept at -20 ̊C before use. All tissues were placed into individual pre-weighed Whirl-PakTM bags and lyophilized for 72 hours (Labconco FreeZone 4.5TM Freeze Dry System).
Hair was collected from the right rear paw using a Wahl stainless steel trimmer (carbon blades) and stainless steel scissors. Blades were thoroughly cleaned between samples. Hair was placed in a 50 ml metal-free conical bottom tube and filled with 1% Triton X, covered, and allowed to sit for 15-30 minutes, shaking occasionally. The Triton X was then poured off and the tube was filled with H2O, covered, sat for 10-15 minutes, with occasional shaking. This process was repeated at least four times until all soap was gone. The hair samples were placed into individual pre-weighed Whirl-PakTM bags and lyophilized for 48 hours (Labconco FreeZone 4.5TM Freeze Dry System).
Bones were cored under a fume hood while wearing a 3MTM particulate respirator N95. The bones were cored using a DremelTM glass diamond drilling bit, 1⁄4” (6.350mm), 663DR, drill speed #23. Each femur was drilled completely through the shaft in three locations to produce six core. Four cores were used in a similar study of THg [3], and the remaining 2 cores were used in this stable isotope study. The periosteum and any traebecular bone were removed using a DremelTM glass diamond taper point sander, 3/32” (2.381mm), #7144. The cores were stored at -20 ̊C in acid- washed (5% HNO3) vials prior to degreasing. The degreasing method used is as follows: bone core samples were sonicated in deionized water in order to remove any debris. Next, they were soaked in chloroform for two 8-hour periods to remove any lipids, then finally rinsed with deionized water and air- dried under a fume hood for 3 days.
The bone collagen extraction is as follows: bone samples were demineralized by soaking in an HCl-H2O solution until they were translucent. After which they were rinsed with deionized water. In order to separate the collagen from other organic compounds and proteins, the bone samples were gelatinized by placing the collagen samples, with HCl-H2O solution (pH between 3.0 and 4.0) in a culture tube. The tube was heated to 70°C under a stream of nitrogen, to dissolve the collagen. The supernatant was lyophilized to retrieve the collagen after centrifugation.
Stable Isoptope Analysis
Isotope ratios are presented as stable isotope abundances
relative to the international standard (delta (δ) notation) in parts per thousand (permil (‰) δX = ((Rsample/Rstandard)-1) × 103 ‰ where, element X = 13C or 15N and R is the molar ratios of heavy to light isotope of the sample and the standard [24]. These isotope ratios are expressed in delta notation of per mil relative to the Viennna PeeDee Belemnite international standards for carbon, and atmospheric N for nitrogen. These standard values are measured using a laboratory standard (peptone) calibrated against several certified reference materials [24].
Between 0.1 and 0.5 mg of hair, liver, muscle, renal cortex, renal medulla, and bone collagen samples were placed in tin capsules then loaded into an autosampler. Samples were analyzed for stable carbon and nitrogen isotopes at the Alaska Stable Isotope Facility at the University of Alaska Fairbanks. A continuous-flow isotope ratio mass spectrometry with a Costech ECS4010 Elemental Analyzer (Costech Analytical Technologies Inc., Valencia, CA, USA) interfaced to a Finnigan Delta Plus XP isotope ratio mass spectrometer via the Conflo III interface (Thermo Fisher Scientific, Waltham, MA, USA) was used for analyzing. The laboratory standard was measured multiple times between samples to evaluate the accuracy and precision of analyses. Accuracy and precision was assessed using multiple peptone standards. Precision was within 0.3‰ and accuracy was within 0.1‰ for both δ13C and δ15N values.
Tissue turnover, Growth Rates and Lipid Contamination Methods used for Analysis
Analysis of the pelage (hair) cycle of the red fox has shown that annual molt begins in early spring, approximately in April, and regrowth begins in late summer. The cycle is complete when the fur obtains its full length and is fully prime in early December. Therefore, the hair collected in winter will be representative of a diet August through October [39]. Bone collagen, however, describes the lifetime diet of an animal [37], while muscle tissues will show a diet within the last two months prior to sampling [12]. Renal cortex and medulla, as well as the liver show the diet within the last week prior to sampling [12, 40].
Lipids are typically depleted in 13C and have δ13C values more negative than those in carbohydrates and proteins within an individual organism [41]. Lipids for hair and bone were extracted and corrected, while muscle, liver and kidney were not [41, 42]. The C:N ratios were analyzed to compare the effect of lipid extractions. A C:N ratio of around four (~10% lipids) is an acceptable range for terrestrial mammals.
Statistical Analyses
Histograms and normal probability plots were used to assess normality of the distribution of δ13C and δ15N isotope measurements for each tissue. Individual isotope measurements greater than three standard deviations from the mean for each tissue were identified as potential outliers [43]. Means and standard deviations were used to summarize δ13C, δ15N and C:N values for all tissues for all foxes, as well as separately for male and female foxes. T-tests were used to compare mean isotope values of males and females for each tissue. Paired t-tests were used to test mean differences in isotope values between pairs of tissues, for both δ13C and δ15N. Pearson’s product-moment correlation was used to measure and test the significance of correlations between isotope values in each pair of tissues, for both δ13C and δ15N. We used the scale established by Andale [44] to classify correlations as follows: High correlation: 0.5 to 1.0 or -0.5 to 1.0, Medium correlation: 0.3 to 0.5 or -0.3 to 0.5, and Low correlation: 0.1 to 0.3 or -0.1 to -0.3. A significance level of α =.05 was used for all hypothesis tests. All analyses were performed using the statistical software R [45].
| Hair Mean (STD) | Bone | Liver | Muscle | Kidney Cortex | Kidney Medulla | |
|---|---|---|---|---|---|---|
| δ13Carbon | -24.89 (1.08) | -22.56 (0.67) | -25.37 (1.34) | -25.69 (1.14) | -25.35 (1.21) | -25.31 (1.21) |
| δ15Nitrogen | 5.57 (1.48) | 4.64 (1.47) | 5.72 (1.64) | 5.20 (1.53) | 5.63 (1.66) | 5.85 (1.53) |
| C:N Ratio | 2.62 (0.05) | 2.51 (0.04) | 4.01 (0.61) | 3.38 (0.31) | 4.02 (0.22) | 3.83 (0.30) |
Table 1: Mean and standard deviation for δ13C and δ15N and C:N ratios for all red foxes (n=65).
Results
Tissue Isotope values for δ13C and δ15N and C:N ratios in wild foxes
The C:N ratios (Table 1) demonstrated a ratio that would be expected for terrestrial mammals [41]. Table 1 summarizes the means and standard deviations of δ13C and δ15N values and C:N ratios for all tissues from the sample of free-ranging red foxes from Bethel Alaska. There was no significant difference between male and female foxes. Histograms and normal probability plots of isotope values were consistent with normality for all tissues.
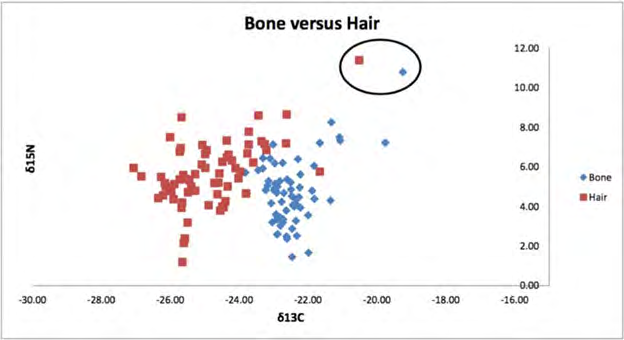
Figure 1 compares the relationship of δ13C and δ15N values for bone and hair. The δ15N values of the two tissues had similar ranges. On the other hand, the δ13C values differed between hair and bone. An outlier was observed in one fox that had isotope values outside the three-standard deviation range for δ13C in hair and bone [43]. This same fox was considerably larger and heavier (5.5 kilograms (kg) than the other foxes. Weight averages for all foxes were 3.85 kg, with males having averages of 4.06 kg, and females 3.62 kg. This fox was not included in the statistical analyses (Figure 1). The C:N ratio for male and female foxes demonstrated ratios that would be expected for terrestrial mammals.
Paired t-tests indicated significant differences in the means for δ13C and δ15N values between pairs of tissues. Table 2 (δ13C) reports the mean differences and p-values for all tissues. For δ13C pairwise mean of differences, hair, bone and muscle were significantly different from kidney and liver. Kidney cortex and medulla were not significantly different from each other.
| Hair | Bone | Muscle | Liver | Kidney Cortex | Kidney Medulla | |
|---|---|---|---|---|---|---|
| Hair | ---- | -2.33 | 0.79 | 0.483 | 0.46 | 0.42 |
| <0.0001 | <0.0001 | <0.0001 | <0.0001 | <0.0001 | ||
| Bone | ---- | 3.12 | 2.81 | 2.79 | 2.75 | |
| <0.0001 | <0.0001 | <0.0001 | <0.0001 | |||
| Muscle | ---- | -0.311 | -0.33 | -0.37 | ||
| 0.001 | <0.0001 | <0.0001 | ||||
| Liver | ---- | -0.02 | -0.05 | |||
| 0.791 | 0.466 | |||||
| Kidney Cortex | ---- | -0.03 | ||||
| 0.404 |
Table 2: Carbon stable isotope paired t-test among all tissues. Mean of differences (top number) / p-values (bottom number).
For δ15N pairwise mean of differences (Table 3), hair was significantly different from bone and muscle. Bone was significantly different from all tissues. Kidney cortex and medulla were significantly different from all tissues except for hair and liver.
| Hair | Bone | Muscle | Liver | Kidney Cortex | Kidney Medulla | |
|---|---|---|---|---|---|---|
| Hair | ---- | 0.92 | 0.37 | -0.15 | -0.05 | -0.27 |
| <0.0001 | <0.0001 | 0.328 | 0.696 | 0.044 | ||
| Bone | ---- | -0.55 | -1.08 | -0.98 | -1.2 | |
| 0.002 | <0.0001 | <0.0001 | <0.0001 | |||
| Muscle | ---- | -0.52 | -0.42 | -0.64 | ||
| <0.0001 | <0.0001 | <0.0001 | ||||
| Liver | ---- | 0.09 | -0.12 | |||
| 0.002 | 0.01 | |||||
| Kidney Cortex | ---- | -0.21 | ||||
| <0.0001 |
Table 3: Nitrogen stable isotope paired t-test among all tissues. Mean of differences (top number / p-values (bottom number).
| Hair | Bone | Muscle | Liver | Kidney Cortex | Kidney Medulla | |
|---|---|---|---|---|---|---|
| Hair | ---- | 0.423 | 0.819 | 0.673 | 0.709 | 0.692 |
| 0.0004 | <0.0001 | <0.0001 | <0.0001 | <0.0001 | ||
| Bone | ---- | 0.308 | 0.328 | 0.318 | 0.346 | |
| 0.013 | 0.007 | 0.01 | 0.005 | |||
| Muscle | ---- | 0.838 | 0.913 | 0.904 | ||
| <0.0001 | <0.0001 | <0.0001 | ||||
| Liver | ---- | 0.891 | 0.875 | |||
| <0.0001 | <0.0001 | |||||
| Kidney Cortex | ---- | 0.952 | ||||
| <0.0001 |
Table 4: Carbon stable isotope correlations among all tissues. Pearson’s product-moment correlation (top number) / p-values (bott
| Hair | Bone | Muscle | Liver | Kidney Cortex | Kidney Medulla | |
|---|---|---|---|---|---|---|
| Hair | ---- | 0.613 | 0.851 | 0.68 | 0.719 | 0.744 |
| <0.0001 | <0.0001 | <0.0001 | <0.0001 | <0.0001 | ||
| Bone | ---- | 0.55 | 0.405 | 0.433 | 0.48 | |
| <0.0001 | <0.0001 | <0.0001 | <0.0001 | |||
| Muscle | ---- | 0.928 | 0.939 | 0.945 | ||
| <0.0001 | <0.0001 | <0.0001 | ||||
| Liver | ---- | 0.988 | 0.975 | |||
| <0.0001 | <0.0001 | |||||
| Kidney Cortex | ---- | 0.985 | ||||
| <0.0001 |
Table 5: Carbon stable isotope correlations among all tissues. Pearson’s product-moment correlation (top number) / p-values (bott
Pearson’s product-moment correlation was used to estimate correlations in isotope measurements between pairs of tissues. Table 4 (δ13C) and Table 5 (δ15N) also show the p- values for testing significance. All p-values were significantly different from zero. Specifically, high correlations were observed for both δ13C and δ15N stable isotope measurements between hair and muscle, liver, kidney cortex and medulla. Hair and muscle correlated with liver, kidney cortex and medulla. Bone showed a small correlation with all tissues for both δ13C and δ15N stable isotope measurements. Bone is less likely to be useful in predicting stable isotope ratios in other tissues of the red fox.
Relationship of Mercury Concentration to Hair
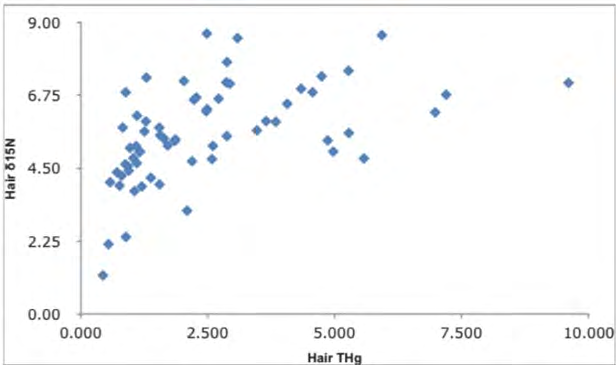
A correlation between δ15N values and THg concentrations of hair was observed for the western Alaska red foxes total mercury (THg) concentration in hair as reported by Dainowski, et al. [3]. When δ15N of hair increased, hair THg increased. Figure 2 shows an increasing pattern of hair δ15N ranging from 2 to about 7 per mil, with most foxes between 4.5 and 7 per mil. The Hg levels range from 0.5 ppm to 9 ppm with most foxes Hg concentrations between 1 and 5 ppm.
Farmed Foxes Versus Wild Foxes
Roth and Hobson [12] reported a study of captive red foxes in which the objective was to measure diet –tissue isotopic fractionation in foxes raised on commercial pellet feed. A non-statistical, qualitative comparison is presented in Table 6. The red fox δ13C hair mean was -24.89 while the farmed fox hair was -16.10 per mil (Table 6). Muscle and bone tissues also differed between the two groups. Similarly, the δ15N means varied for both groups (5.57 vs. 8.10 per mil).
| δ13C Alaska free- ranging foxes | δ13C Ontario commer- cial fed farmed foxes | δ15N Alaska free- ranging foxes | δ15N Ontario commercial fed farmed foxes | |
|---|---|---|---|---|
| Bone | -22.56 (0.67) | ---- | 4.64 (1.47) | ---- |
| Kidney Medulla (KidneyM) | -25.31 (1.21) | ---- | 5.85 (1.53) | ---- |
| Kidney Cortex (KidneyC) | -25.35 (1.21) | ---- | 5.63 (1.66) | ---- |
| Liver | -25.37 (1.34) | -18.3 | 5.72 (1.64) | 8.2 |
| Muscle | -25.69 (1.14) | -17.6 | 5.20 (1.53) | 8.2 |
| Hair (fur) | -24.89 (1.08) | -16.1 | 5.57 (1.48) | 8.1 |
Table 6: Stable Isotope mean values (std dev) for tissues of Alaskan free-ranging red foxes and Southern Ontario, commercially fe
Discussion
The small percentage of lipid content in the fox tissues did not influence the δ13C and δ15N stable isotope values. The red fox tissues had a 1% difference in their mean values between lipid extracted, e.g. bone, and non-lipid extracted tissues, e.g. hair, for δ13C.
Potential western Alaska red fox nutrient sources include terrestrial, avian, aquatic, and occasionally anthropogenic derived foods. Plants, both C3 and C4, are significant due to the δ13C ratios, which differ depending on the photosynthetic pathway [21, 46]. The ratio of 13C/12C isotopes in C3 plants range from approximately -24.00 to -34.00‰, while the ratio in C4 plants range from approximately -6.00 to -19.00‰ [47]. Alaska’s native vegetation is exclusively C3, such as rice, shrubs and grasses [22, 47]. The C13 isotopes indicate that C3 plant eating terrestrial animals comprise the majority of the red fox’s diet. The red fox hair mean value δ13C of -24.89 ‰ (male and female) results from a diet high in microtines (Table 6).
The farmed red fox diet is δ13C isotopically different from the wild Alaskan fox (Table 6). Roth and Hobson [12] reported the pellet diet of their farmed foxes contained up to fifty percent carbohydrate, resulting in an average δ13C isotope fractionation value lower than the Alaskan red fox whose diet is based on microtines eating C3 plants. For farmed fox δ13C isotope values ranged between-16.10 to 18.31 per mil in the tissues (Table 6). Corn, found in domestic animal feed, is a major component of the commercial rodent pellet diet and human diet [11, 25].
Nitrogen stable isotope ratios vary as trophic levels increase [48], and between terrestrial and marine sources [13, 24, 26, 27]. The increase in trophic levels can be 2.00‰ to 4.00‰ between levels; however, this depends on the tissue water content [49, 50, 51]. The environment and physiological factors of animals (e.g. hair growth) [24, 49] and wetter and cooler ecosystems plants would have a lower δ15N ratio [24, 51].
After comparing our muscle data with Roth and Hobson [12], δ13C and δ15N stable isotope measurements illustrate that a wild diet of mainly microtines consumed by the free-ranging red foxes can easily be distinguished from the carbohydrate rich pellet diet that includes carbon from C4 plants. Our stable isotope demonstrates that free- ranging Western Alaska red fox diets vary greatly from the commercial fur farmed foxes from Ontario, Canada (Table 6). The isotope data suggests that the Alaska red foxes have a major diet of herbivores, such as microtones that feed on C3 plants. Our data validates Roth and Hobson’s concept using stable isotope changes to monitor terrestrial mammalian omnivores’ food web [52].
The isotope values of the red fox’s diet items versus the THg concentrations found in their hair tissue implies that the THg may be coming through a mixed lemming/aquatic/avian pathway (possibly fish or other fish-eating birds) for those foxes with the higher mercury contents. The free-ranging red foxes should retain a summer signal in their hair. A summer seasonal effect of THg in the diet may explain the variation in the Hg values (Figure 2) [53].
Since red foxes are the second most important species overall in the state of Alaska, as well as among the top most important species to trappers in western Alaska, the different statistical analysis provided in this research has shown to be important. The stable isotope statistical analyses, as seen in various tissues of the Alaskan red fox, have shown the red fox’s dietary food source, the components of their food chain as well as seasons diet patterns in their changing Alaskan environment. In addition, the mercury analyses, as seen in various tissues of these same red fox’s, helped to identify not only bioaccumulation of mercury through season changes but also the accumulation of mercury through the fox’s food chain. Since the red fox’s movements are driven by local and seasonal food availability, the implications of this research is important in order to monitor the health of the Western Alaska red fox. By monitoring the health of the Alaskan red fox and their food chain, we can also monitor the health of their ecosystem, through mercury analysis, for nutritional value. By monitoring the red fox’s heath and the health of their ecosystem, we can then address various health issues that may be indicated in future red fox tissue analysis. In this way, we can make every effort to insure a healthy ecosystem and population of red foxes in western Alaska [54].
Conclusion
This is the first report on red fox population stable isotope ratios from western Alaska. The δ15N stable isotope ratio of hair are significantly different from bone and muscle tissues. The western Alaska red fox differs in trophic position with the farmed red fox. Stable isotope data is correlated with the mercury levels. Identifying the trophic position of red fox populations allows for ecological risk assessment of contaminants such as mercury as climate change and industrial development impacts the physical and biological composition of western Alaska ecosystems.
Funding
Research reported in this publication was supported by the National Institute of General Medical Sciences of the National Institutes of Health under Award Number P20GM103395. The content is solely the responsibility of the authors and does not necessarily represent the official views of the National Institutes of Health.
References
-
Dell’Arte GL, Laaksonen T, Norrdahl K, Korpimaki E (2007) Variation in the diet composition of a generalist predator, the red fox, in relation to season and density of main prey. Acta Oecol 31(3): 276-281.
-
Newsome SD, Wolf N, Peters J, Fogel ML (2014) Amino Acid δ13C Analysis Shows Flexibility in the Routing of Dietary Protein and Lipids to the Tissue of an Omnivore. ICB 54(5): 890-902.
-
Dainowski BH, Duffy LK, McIntyre J, Jones P (2015) Hair and bone as predictors of tissular mercury concentration in the Western Alaska Red Fox, Vulpes vulpes. Sci Total Environ 518-519: 526-533.
-
Chirkova A (1968) The relationship between arctic fox and red fox in the far north. Problems in the North 11: 129-131.
-
Hersteinsson P, Macdonald DW (1992) Interspecific competition and the geographical distribution of red and arctic foxes Vulpes vulpes and Alopex lagopus. Oikos 64(3): 505-515.
-
Kiener TV, Zaitsev VA (2010) Range structure in the red fox (Vulpes vulpes L.) in the forest zone of Eastern Europe. Contemporary Problems of Ecology 3(1): 119- 126.
-
Harper P, McCarthy LA (2013) Furbearer management report of survey-inventory activities 1 July 2009-30 June 2012. Alaska Department of Fish and Game, Species Management Report ADF&G/DWC/SMR-2013-5, Juneau.
-
Parr BL (2017) 2016 Alaska trapper report: 1 July 2016– 30 June 2017. Alaska Department of Fish and Game, Division of Wildlife Conservation, Wildlife Management Report ADF&G/DWC/WMR-2017-3, Juneau.
-
Von Schantz T (1980) Prey consumption of a red fox population in Southern Sweden. Biogeographica 18: 53- 64.
-
Harris S (1981) The food of suburban foxes (Vulpes vulpes) with special reference to London. Mammal Rev 11(4): 151-168.
-
Savory GA, Hunter CM, Wooller MJ, O’Brien DM (2014) Anthropogenic food use and diet overlap between red foxes (Vulpes vulpes) and arctic foxes (Vulpes lagopus) in Prudhoe Bay, Alaska. Can J Zool 92(8): 657-663.
-
Roth JD, Hobson KA (2000) Stable carbon and nitrogen isotopic fractionation between diet and tissue of captive red fox: implications for dietary reconstruction. Can J Zool 78(5): 848-852.
-
Kelly JF (2000) Stable isotopes of carbon and nitrogen in the study of avian and mammalian trophic ecology. Can J Zool 78(1): 1-27.
-
Fleming PJS, Nolan H, Jackson SM, Ballard G, Bengsen A, et al. (2017) Roles for the Canidae in food webs reviewed: Where do they fit? Food Webs 12: 14-34.
-
Peterson BJ, Fry B (1987) Stable isotopes in ecosystem studies. Annu Rev Ecol Syst 18: 293-320.
-
Dugatkein LA, Trut L (2017) How to tame a fox and build a dog. American Scientist 105: 240-247.
-
McCutchan JH, Lewis WM, Kendall C, McGrath CC (2003) Variation in trophic shift for stable isotope ratios of carbon, nitrogen, and sulfur. OIKOS 102(2): 378-390.
-
Rounick JS, Winterbourn MJ (1986) Stable carbon isotopes and carbon flow in Ecosystems. Bioscience 36(3): 171-177.
-
Hobson KA, Fisk AT, Karnovsky N, Holst M, Gagnon JM, et al. (2002) A stable isotope (δ13C, δ15N) model for the North Water foodweb: implications for evaluating trophodynamics and the flow of energy and contaminants. Deep Sea Research Part II: Topical studies in Oceanography 49(22-23): 5131-5150.
-
Vogel JC, Van Der Merwe NJ (1977) Isotopic evidence for early maize cultivation in New York State. Am. Antiquity 42(2): 238-242.
-
Farquhar GD, Ehleringer JR, Hubick KT (1989) Carbon isotope discrimination and photosynthesis. Annu Rev Plant Physiol Plant Mol Biol 40: 503-537.
-
Sage RF, Wedin DA, Li M (1999) The biogeography of C4 photosynthesis: patterns and controlling factors. In: Sage RF, (Ed.), C4 plant biology. Academic Press, San Diego, pp: 596.
-
Dalerum F, Angerbjorn A (2005) Resolving temporal variation in vertebrate diets using natural occurring stable isotopes. Oecologia 144(4): 647-658.
-
Fry B (2006) Stable Isotope Ecology. Springer: New York, NY.
-
Jahren AH, Kraft RA (2008) Carbon and nitrogen stable isotopes in fast food: signatures of corn and confinement. Proc Nat Acad Sci 105(46): 17855-17860.
-
Schoeninger MJ, DeNiro MJ (1984) Nitrogen and carbon isotopic composition of bone collagen from marine and terrestrial animals. Geochim Cosmochim Ac 48(4): 625- 639.
-
Ben-David M, Bowyer RT, Duffy LK, Roby DD, Schell DM (1998) Social behavior and ecosystem processes: Effects of river otters latrine sites on nutrient dynamics of terrestrial vegetation. Ecology 79: 2567-2571.
-
Won EJ, Choi B, Hong S, Khim JS, Shin KH (2018) Importance of accurate trophic level determination by nitrogen isotope of amino acids for trophic magnification studies: A review. Environ Pollut 238: 677-690.
-
Robbins CT, Felicetti LA, Sponheimer M (2005) The effect of dietary protein quality on nitrogen isotope discrimination in mammals and birds. Oecologia 144(4): 534-540.
-
Sweeting CJ, Jennings S, Polunin MVC (2005) Variance in isotopic signatures as a descriptor of tissue turnover and degree of omnivore. Funct Ecol 19(5): 777-784.
-
Ben-David M, Newsome SD, Whiteman JP (2012) Lipid and amino acid composition influence incorporation and discrimination of 13C and 15N in mink. J Mammal 93(2): 399-412.
-
Phillips DL, Eldridge PM (2006) Estimating the timing of diet shifts using stable isotopes. Oecologia 147(2): 195- 203.
-
Ben-David M, Flaherty EA (2012) Stable isotopes in mammalian research: a beginner’s guide. J Mammal 93(2): 312-328.
-
Ben-David M, Duffy LK, Blundell GM, Bowyer RT (2001) Natural exposure to mercury in coastal river otters: age, diet and survival. Environ Toxicol Chem 20(9): 1986- 1992
-
Kalisinska E, Lisowski P, Salicki W, Kucharska T, Kavetska K (2009) Mercury in wild terrestrial carnivorous mammals from north-western Poland and unusual fish diet of red fox. Acta Theriol 54(4): 345-356.
-
Clark CT, Horstmann L, Misarti N (2017) Quantifying variability in stable carbon and nitrogen isotope ratios within the skeletons of marine mammals of the suborder Caniformia. J Arch Science: Reports. 15: 393-400.
-
Tieszen LL, Boutton TW, Tesdahl KG, Slade NA (1983) Fractionation and turnover for δ13C analysis of diet in animal tissues: Implications for δ13C analysis of diet. Ecology 57(1): 32-37.
-
Bassett CF, Llewellyn LM (1948) The molting and fur growth pattern in the adult silver fox. Am Midl Nat 39(3): 597-601.
-
Maurel D, Coutant C, Boissin-Agasse L, Boissin J (1986) Seasonal moulting patterns in three fur bearing mammals: the European badger (Meles meles L.), the red fox (Vulpes vulpes L.), and the mink (Mustela vison). A morphological and histological study. Can J Zool 64(8): 1757-1764.
-
Roth JD, Marshall JD, Murray DL, Nickerson DM, Steury TD (2007) Geographical Gradients in Diet Affect Population Dynamics of Canada Lynx. Ecology 88(11): 2736-2743.
-
Post DM (2002) Using Stable Isotopes to Estimate Trophic Position: Models, Methods, and Assumptions. Ecology 83(3): 703-718.
-
Fagan KA, Koops MA, Arts MT, Power M (2011) Assessing the utility of C:N ratios for predicting lipid content in fishes. Can J Fish Aquat Sci 68(2): 374-385.
-
Ruan D, Chen G, Kerre E (2005) Intelligent Data Mining: Techniques & Applications. In: Wets G [ed.], Studies in Computational Intelligence 5: 318.
-
Andale (2015) Pearson Correlation: Definition and Easy Steps for Use.
-
R Development Core Team (2015) R: A language and environment for statistical computing. R Foundation for Statistical Computing, Vienna, Austria 3-900051-07-0.
-
Smith BN, Epstein S (1971) Two categories of 13C/12 C ratios for higher plants. Plant Physiol 47(3): 380-384.
-
O’Leary MH (1988) Carbon Isotopes in Photosynthesis. BioScience 38(5): 328-336.
-
Hobson KA, Welch HE (1992) Determination of trophic relationships within a high Arctic marine food web using δ13C and δ15N analysis. Mar Ecol Prog Ser 84: 9-18.
-
Adams TS, Sterner RW (2000) The effect of dietary nitrogen content on trophic level 15N enrichment. ASLO 45(3): 601-607.
-
Handley LL, Austin AT, Stewart GR, Robinson D, Scrimgeour CM, et al. (1999) The 15N natural abundance (δ15N) of ecosystem samples reflects measures of water availability. Aust J Plant Physiol 26(2): 185-199.
-
Szpak P, White CD, Longstaffe FJ, Millaire JF, Vasquez Sanchez VF (2013) Carbon and Nitrogen Isotopic Survey of Northern Peruvian Plants. Baselines for Paleodietary and Paleoecological Studies. PLOS ONE 8: e53763.
-
Dehn LA, Follmann EH, Thomas DL, Sheffield GG, Rosa C, et al. (2006) Trophic relationships in an Arctic food web and implications for trace metal transfer. Sci Total Environ 362(1-3): 103-123.
-
Murray MS, McRoy CP, Duffy LK, Hirons AC, Schaaf JM, et al. (2015) Biogeochemical analysis of ancient Pacific cod bone suggest Hg bioaccumulation was linked to paleo sea level rise and climate change. Front Environ Sci 3(8): 1-8.
-
Treu G, Krone O, Unnsteinsdottir ER, Greenwood AD, Czirjak GA (2018) Correlations between hair and tissue mercury concentrations in Icelandic arctic foxes (Vulpes lagopus). 619-620:1589-1598.
- Evaluation of Skin Aging Preventive Effects of Cherry Blossom Petal Extracts Through Antioxidant and Anti-Glycation Activities
- Is Cell Death Responsible for False Positive Results of In Vivo Comet Assay?
- Pattern of Gonadal Hormones in Oral Testosterone-Supplimented Male Wistar Rats with Diabetes-Induced Hypogonadism
- Re-Evaluation of the Genotoxicity of Currently Used Food Dyes in Mouse Multiple Organs Via Continuous Administration by Drinking Using the Comet Assay
- Pharmacogenetics of Type 2 Diabetes Mellitus: Linking Genetic Variability to Drug Efficacy and its Cardiovascular Outcomes
- Exploratory Proteomic Profiling of SARS-CoV-2 Infected THP-1 Macrophages Reveals Alterations in Inflammatory Response and Cellular Metabolism