A Systematic Review and Health Risk Assessment on the Concentration of Particulate Matters in Iran
There are growing activities leading to emission of suspended particles. Industrialization and expanding the cities in Iran is an alarm of urban air pollution and the particulate maters (PMs) as one of the criteria air pollutants. The concentration of the particulate maters, exposure and the health risks are studied in this systematic review regarding the published literatures in the data bases of SID (Scientific Information Database), Science direct, and Google scholar. The results showed a high concentration of PMs, which was the highest concentration related to PM10 (146.39 ± 123.31 µg/m3) and then respectively PM7, PM4, PM2.5 and PM1. The concentration of particles in spring (136.79 ± 157.95 µg/m3) was higher compared to remain, it was followed by summer, winter and autumn, respectively. The particles were with higher concentrations in industrial areas compared to the commercial and residential areas. The risk of cancer and toxicity of PM2.5 was high for all age groups, and the risk levels were very high for children under 6 years old (4937.7×10-6). Non-cancer risk PM10 (2.92), PM2.5 (7.41) for outdoor air in most cities was higher than the guideline limit of 1
Introduction
For the last decades the air pollution has become one of the global concerns that have a significant impact on climate, environment, human health, sustainable development and global economy. The air pollutants enter the atmosphere due to the natural and anthropogenic sources such as mining, explosion, drilling, construction, fire, volcanoes, dust storms, and sea waves. Particulate matter or PM is a complex mixture of very small particles and liquid droplets, which cause air pollution. Two main classes of the particles are; 1- Course inhalable particles (PM10) whose diameter is greater than 2.5 microns and smaller than 10 microns, 2- Fine particles (PM2.5) whose diameter is 2.5 microns or less. Epidemiological studies on the relationship between exposures to particles they have shown the incidence of cancer, cardiovascular diseases and premature death. According to the results obtained from the studies, the health effects of suspended particles depend to a great extent on their size. After inhalation, these particles may have a stimulating effect on the upper respiratory tract or penetrate inside the lungs and cause complications in the lungs that lead to the lung disorders. They particles are dangerous for people who have a history of respiratory disease. Diseases such as upper respiratory tract infection, heart disorders, bronchitis, shortness of breath, pneumonia, harm to the chest and the effect on the body defense system are the main effects of suspended particles on humans [1]. In many studies, a significant relationship between exposure to particulate matter and mortality has been observed, for example, in 2013, 87% of the world’s population lived in areas where PM2.5 concentrations exceeded the World Health Organization (WHO) guidelines. It led to the death of about 9.2 million people [2].
The guideline level for PM10 is (150 µg/m³) in a 24-hour average. For every (10 µg/m³) increase in PM10 concentration, total daily mortality increases by almost one percent. Therefore, study on the concentrations and the health effects of PMs in the cities and more populated places is important to better understanding the health impacts and sustainable development strategy design. For this purpose, the current research was conducted with the aim of investigating the concentration and toxicity of suspended particles (PM5, PM2.5, PM10) in different cities of Iran.
The Study Method
Description Search Articles
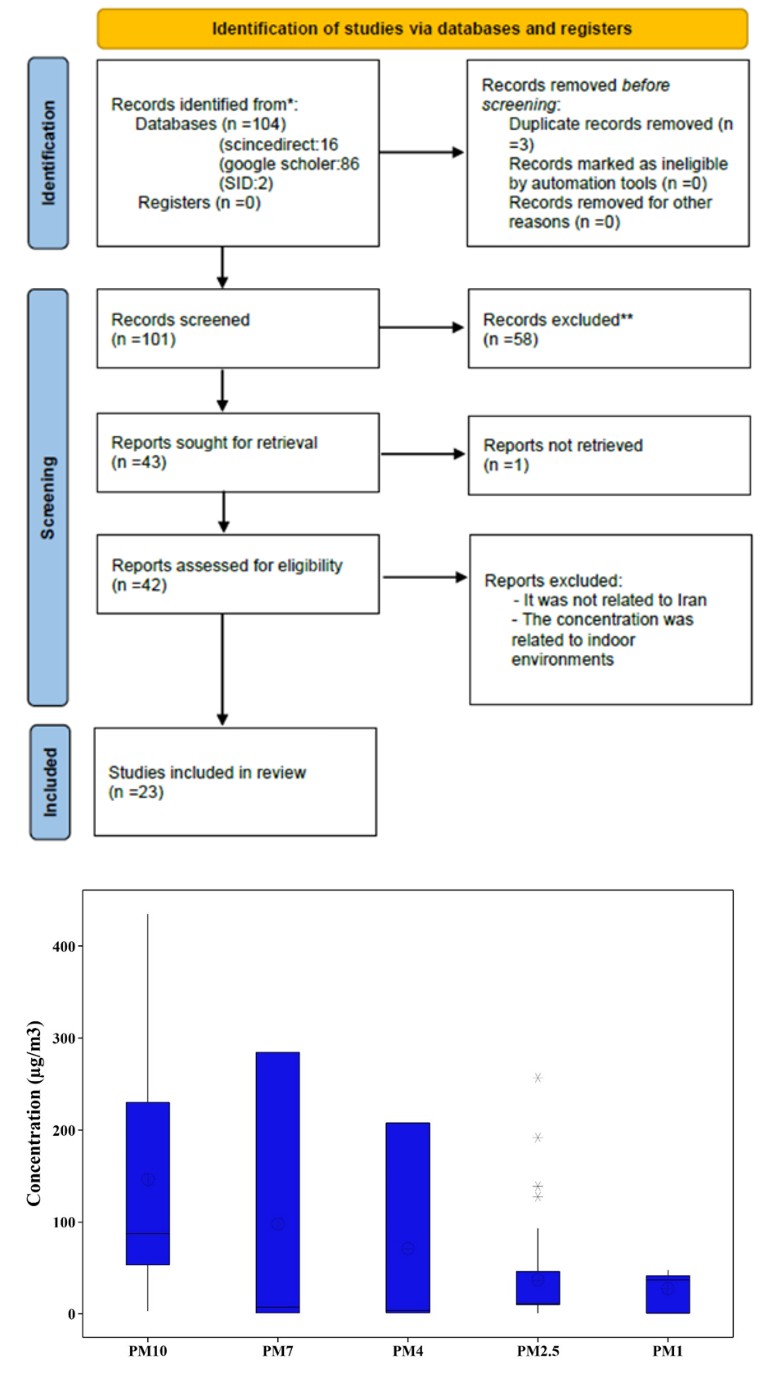
This systematic review was carried out by searching in the selected databases in time range from mid of September to the end of September for the articles published between years of 2002-2022 in English and Persian languages. The applied search keywords were particulate matter, air pollution, dust, PM10, PM2.5, PM5 and Iran in Science Direct, Google Scholar and SID databases. The searched phrases were "particulate matter" AND "PM10" AND "PM2.5" AND "Iran" in the Science Direct database, the search phrases "PM10" AND "PM2.5" AND "PM5" AND "particulate matter" AND "Iran" in the Google Scholar database, the search phrases "particulate matter" AND "PM2.5" AND "Iran" in the first time and the search phrases "air pollution" AND "PM10" in the second in the database of SID. As a result, 16 articles were found in Science Direct database, 86 articles were found in Google Scholar database and 2 articles were found in SID database.
In the further step, all the articles including "particulate matter", "PM10", "PM2.5", "PM5" and "Iran", "air Pollution", "Dust" in their title, abstract and keywords were selected. In this primitive search, 104 articles were found, after reviewing the articles, duplicate articles were removed. The including criteria for the found documents were the reporting the concentration of particulate matter in the air of Iranian cities, the toxicity of particulate matter in the air of Iranian cities in general. Finally, 23 articles were included in the study.
Health Risk Assessment
Health risk assessment is an important tool by which probable deleterious impacts of human exposure to a given pollutant is characterized [3, 4]. This tool is predictive in nature and uses the measured exposure data to determine the health effects of human exposure to pollutants [5]. This study applied the risk assessment methodology provided by the Unites States Environmental Protection Agency (USEPA)24, which concentrated on the health risk estimation through inhalation route for all age groups. For assessing the risk to the human health upon exposure to PM2.5 in ambient air of Different cities Iran through inhalation pathway, Excess Lifetime Cancer Risk (ELCR) were estimated. As the health risk assessment is age---specific, the population is divided into ten age-specific categories (from Birth to < 1 to 71 and above years olds) which is given in Table 1. T The (ELCR) was calculated using the following equation:
$$ELCR = LADD \left( \frac{\text{lifetime average daily dose} \left( \frac{\mu g}{\text{kg day}} \right)}{SF} \left( \frac{\text{Slope Factor}}{\mu g} \right) \right)$$
(1)
Furthermore, the LADD can be calculated using Eq. (2):
$$LADD = \frac{\left( C \times IR \times ED \times EF \right)}{\left( AT \times BW \right)}$$
(2)
Where, C is pollutant concentration $\left( \frac{\mu g}{m^3} \right)$, IR is inhalation rate $\left( \frac{m^3}{day} \right)$, ED is exposure duration (years), EF is exposure frequency $\left( \frac{\text{days}}{year} \right)$, BW is body weight $(kg)$, and AT is averaging exposure time $(days)$ [6].
The slope factor $(SF)$ of each pollutant is presented by the Integrated Risk Information System (IRIS) of the USEPA.
But in absence of its exact amount, Eq. (3) can be used as:
$$SF = \frac{BW}{\left( (UR \times IR) \right)}$$
where, SF is the slope factor and UR is unit risk $\left( \frac{\mu g}{m^3} \right)$. To calculate SF value, it is necessary to have the value of unit risk for PM2.5. There is no any information associated with PM2.5 in Iran. Therefore, in the present work, the value of
3 g m µ
risk unit of PM2.5)0.008
provided by Greene and
Morris was applied [7]. But for PM10, the value of unit risk and slope factor has been not provided in the previous studies, so we didn’t calculate ELCR and carcinogenic risk for PM10. Risk assessment for the non-carcinogenic risk of PM2.5 was calculated using the parameter called hazard quotient( ) HQ , the ratio of LADD to reference dose ( ) RFD by using the following equation:
( ) ( ) g HQ hazard quotient LADD
lifetime average daily dose
RFD reference dose kg day
$$ Q = \left(h a z a r d q u o t i e n t\right) = L A D D \left(l i f e t i m e a v e r a g e d a l i y d o s e\right) \div R F D \left(re f e r e n c e d o s e \left(\frac {\mu g}{k g d a y}\right)\right) $$ If HQ > 1, the potential risk can be serious. Furthermore, If HQ ≤ 1, it means as acceptable hazard [8, 9]. used the value of
3 g m µ
RFC of diesel particles to calculate the reference dose (RFD) for PM2.5 De Oliveira BFA, et al. [10] and 3 g m µ RFC to calculate the RFD for PM10 Li F, et al. [11] in order to assess the probability of adverse health impacts. Risk parameters used for calculating HQ and ELCR for PM2.5 and PM10 in ambient air are given in Table 2. After the calculations, the resulted ELCRs and HQs were reported as mean, minimum, and maximum values based on the concentrations of the PMs [12, 13, 14, 15].
| Age groups (year) | Reference | ||||||||||
|---|---|---|---|---|---|---|---|---|---|---|---|
| Birth to <1 | 1 to <2 | 2 to <3 | 3 to <6 | 6 to <11 | 11 to <16 | 16 to <21 | 21 to <61 | 61 to <71 | 71 and Older | -12 | |
| Inhalation rate (m3/day) | 8 | 8.9 | 10.1 | 12 | 15.2 | 16.3 | 15.7 | 16 | 14.2 | 12.9 | -12 |
| Body weight (kg) | 9.2 | 11.4 | 13.8 | 18.6 | 31.8 | 56.8 | 71.6 | 80 | 80 | 80 | -12 |
| Exposure duration (year) | 1 | 1 | 1 | 3 | 5 | 5 | 5 | 49 | 49 | 49 | -12 |
| Exposure frequency (day/ year) | 365 | 365 | 365 | 365 | 365 | 365 | 365 | 365 | 365 | 365 | -12 |
| Averaging time (day) for noncarcinogens | 365 | 365 | 365 | 1095 | 1825 | 1825 | 1825 | 17885 | 17885 | 17885 | -12 |
| Unit risk (UR) | 0.008 µg/m3 for PM 2.5 | -13 | |||||||||
| Inhalation reference concentration | 5 µg/m3 for PM 2.5 | -14 | |||||||||
| (RFC) | 50 µg/m3 for PM 10 | -15 |
Table 1: Risk parameters used for calculating HQ and ELCR for PM2.5 and PM10 in ambient air.
3 1 3 mg m RFD RFC Assumed inhalation rate m inhalation refer day BW K ence concentra g tion = × × ( ) ( ) ( ) ( ) ( ) ; 70 365 BW
Slope factor or carcinogenic potency slope SF
Averaging time days for Carcinogens
years
days per year
$$ ) = \frac {B W}{\left(I R \times U R\right)}; A v e r a g i n g t i m e (d a y s) f o r C a r c i n o g e n s = (7 0 y e a r s) \times ( $$ [16].
( )
Results and Discussion
Particulate Matter Concentrations
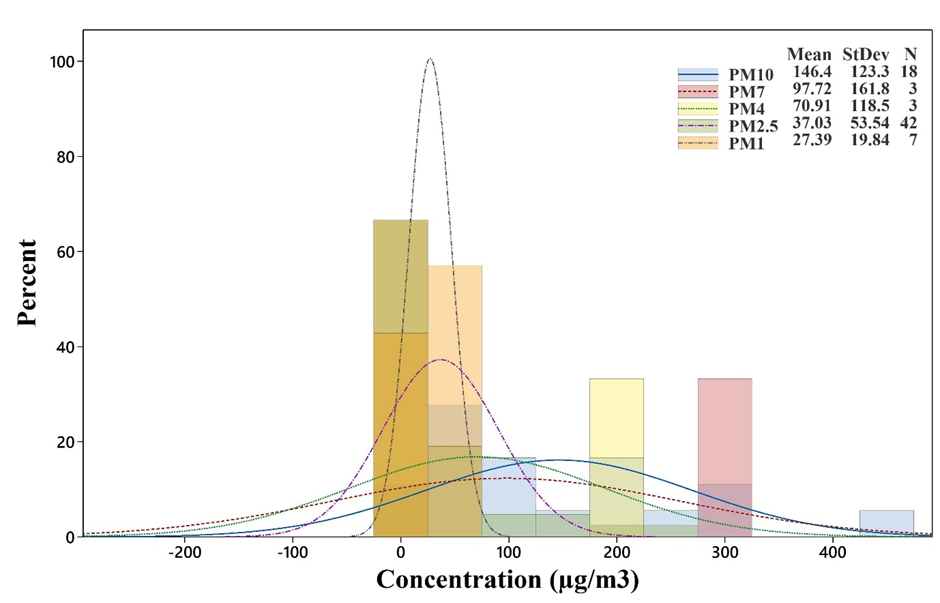
Screening of 104 articles, which were included in the study, showed that 9 articles investigated the concentration of suspended particles of PM10 and PM2.5, 7 articles investigated the concentration of suspended particles of PM10, PM2.5 and PM1, 3 articles investigated suspended particles of PM10, PM7, PM4, PM2.5 and PM1, 2 articles specialized in PM10 and 3 articles specialized in concentration of PM2.5 in different cities of Iran. Regarding the results, the mean concentration of the particulate matters in Iran were PM10 (146.39 ± 123.31 µg/m3), PM7 (97.72 ± 161.84 µg/m3), PM4 (70.91 ± 118.5 µg/m3), PM2.5 (37.03 ± 53.54 µg/m3), PM1 (27.38 ± 19.83 µg/m3) for Tehran, Mashhad, Karaj, Ahvaz, Kashan, Isfahan, Sabzevar, Yazd, Durud, Khorramabad, Arak, the boxplot of the results is presented in Figure 1.
According to Figure 1, PM10 (146.39 µg/m3) was the highest concentration of the suspended particles and it was followed by PM7 (97.72 µg/m3), PM4 (70.91 µg/ m3), PM2.5 (37.03 µg/m3), and PM1 (27.38 µg/m3). It indicates that the mean concentration of PM2.5 and PM1 are very close. They are the lowest mean levels among the PMs. Maximum concentrations for the PMs were results as PM10 (5337.6 ± 407.07 µg/m3), PM7 (580.5 ± 80.47 µg/m3), PM4 (281.7 ± 56.84 µg/m3), PM2,5 (910.9 ± 83.2 µg/m3), PM1 (495.3 ± 34.9 µg/m3) and minimum concentrations of them were as PM10 (2.22 ± 35.13 µg/ m3), PM7 (58.23 ± 47.47 µg/m3), PM4 (35.84 ± 27.33 µg/ m3), PM2.5 (0.1 ± 14.35 µg/m3), PM1 (10.31 ± 10.46 µg/m3).
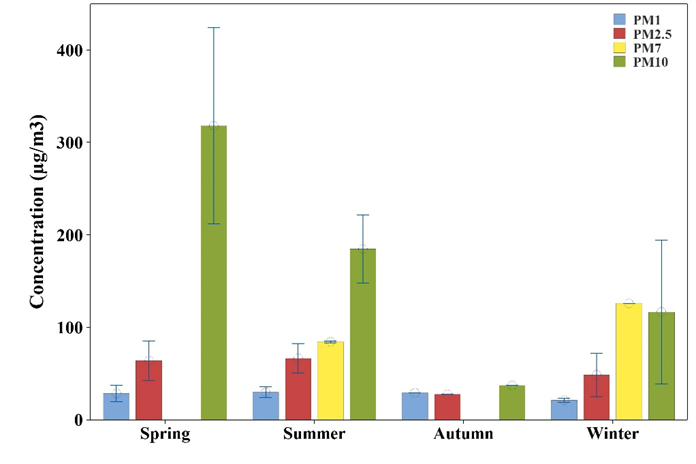
The distribution of PMs in Iran shows higher concentrations for the coarse particles compared to the fine particles (Figure 2). Concentration of PM10 and PM7 are more widely distributed compared to remain. This is consistent with results of Ahmadi et al. They reported concentration of PM2.5 in 9 cities in the west and south of Iran. In their results, mean concentration of PM2.5 was 12.25 µg/m3 and Khuzestan province showed the highest mean concentration (15.29 µg/m3), where Hamedan province had the lowest mean concentration of PM2.5 (10.16 µg/m3), which were not considerably varied. It is proven by the previous researches that the particles of concern for human health are PM10 and PM2.5. The fine particles or PM2.5 are 2.5 microns and smaller, which are invisible to the naked eye. It is generated by combustion or heating processes, generally. Moreover, there is a report of high exposure to PM2.5 in subway users compared to other transportation systems such as taxis or buses users [17]. After inhalation, these particles may have a stimulating effect on the upper respiratory tract or penetrate inside the lungs and cause complications in the lungs that lead to the lung disorders. They particles are dangerous for people who have a history of respiratory disease. Diseases such as upper respiratory tract infection, heart disorders, bronchitis, shortness of breath, pneumonia, harm to the chest and the effect on the body defense system are the main effects of suspended particles on humans. Prevalence of chronic obstructive pulmonary disease (COPD) increases due to exposure to air pollutants such as carbon monoxide and suspended particles [18]. According to the report of World Health Organization (WHO), for every 10 micrograms increase in the concentration of suspended particles, the death rate increases by 13 percent. In 2015-2016, the lung cancer mortality rate attributed to exposure to PM2.5 in people older than 30 years was conducted in 15 cities of Iran, and the total lung cancer mortality caused by PM2.5 in these 15 cities was 120 cases for the study year. Aziz et al. reported that in Lahore, Pakistan, an average of 1250 people die annually due to air pollution [18]. The next category is PM10 which are the particles with an aerodynamic diameter of less than 10 microns. These particles are produced as a result of industrial activities in greater amounts compared to PM2.5. Gilmour and his colleagues reported that PM10 particles lead to oxidative stress in macrophages by producing hydroxyl radicals [19]. The guideline level for PM10 is (150 µg/m3) in a 24-hour average. For every (10 µg/m3) increase in PM10 concentration, total daily mortality increases by almost one percent [20].
Seasonal Variation of the PMs
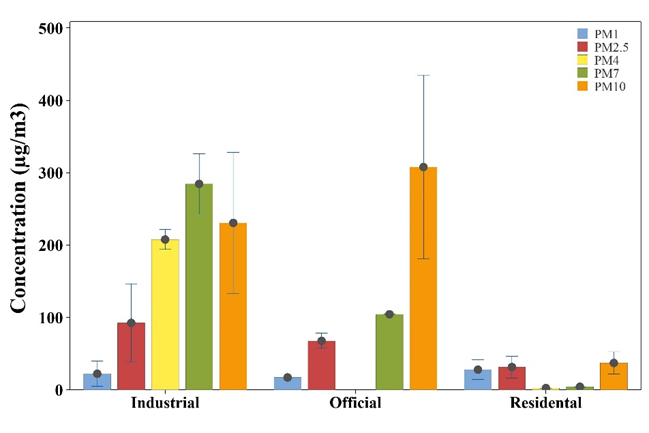
Seasonal variations of the concentrations for PMs are reported in the 4 Out of 23 studies. All of them reported PM1, PM2.5, PM7, and PM10 for summer, 2 studies reported PM1, PM2.5, and PM10 in spring, 2 studies reported PM1, PM2.5, PM7, and PM10 in the winter, and 1 article reported PM1, PM2.5, and PM10 in the autumn. Respect to the results, the mean concentrations of PMs in spring are as PM10 (318.03±212.64 µg/m3), PM2.5 (63.88±42.46 µg/ m3), PM1 (28.47±17.7 µg/m3), for the summer they are as PM10 (184.62±90.54 µg/m3), PM7 (85.23 µg/m3), PM2.5 (66.46±39.41 µg/m3), PM1 (29.72±13.18 µg/m3), for autumn they are as PM10 (37±50.11 µg/m3), PM2.5(27.5±35.92 µg/ m3), PM1 (29±28.75 µg/m3), and for the winter they are as PM10 (116.41±110.18 µg/m3), PM7 (125.83 µg/m3), PM2.5 (48.41±33.11 µg/m3), and PM1 (21±2.82 µg/m3) (Figure 3). Kianisadr, et al. reported PM2.5 (138.8 µg/m3) and PM10 (202.1 µg/m3) in the summer of 2017 in Khorram Abad city, and the PM10 was higher than PM2.5 which is consistent with our results [21]. Miri, et al. reported PM10, PM2.5 and PM1 particles in the fall and spring seasons in Sabzevar city, and the concentration of the PMs was higher in the fall, which is not agree with our findings [22]. Shahsavani, et al. stated the concentration of suspended particles in the spring of 2010 in Ahvaz city, and the average PM10 (319.6±407.07 µg/m3) was higher than PM2.5 (69.5±83.2 µg/m3) and the concentration of PM2.5 was higher than PM1 (37.02±34.9 µg/m3) which is consistent with our results [23]. Shahri, et al. reported the PMs of Khash cement factory in Sistan Baluchistan province, that the highest concentration of PM10 (64.92±3.76 µg/ m3) was in autumn and the highest concentration of PM2.5 (24.32±2.51 µg/m3) was in spring. Unlikely, our findings showed that the highest concentration of PM10 is related to spring and the highest concentration of PM2.5 is related to summer [24]. Almasi, et al. during a period of 4 years (1390_87) reported the air quality of the city of Kermanshah in terms of PM10 concentration, the highest concentration of PM10 was related to the winter (21.96 µg/m3) and the lowest concentration was related to the summer season (4.81 µg/ m3), our results showed that the highest concentration of PM10 was related to the spring and the lowest concentration was related to the autumn [25].
Regional Changes of PMs
The concentration of the PMs is reported in various environments in the studied literature. In this regard, in 3 studies the concentration of PM10, PM7, PM2.5, and PM1 reported for the official environments, 3 studies reported PM10, PM7, PM4, PM2.5, PM1 in the residential areas and 2 studies reported PM10, PM7, PM4, PM2.5, PM1 in the industries. Given the reports, the mean concentration of the PMs for the official environments were as PM10 (307.85±179.58 µg/m3), PM7 (104.54 µg/m3), PM2.5 (67.84± µg/m3), and PM1 (17.16 µg/m3). For the residential environments they were PM10 (37.23 µg/m3), PM7 (4.3 µg/m3), PM4 (2.5 µg/m3), PM2.5 (31.45 µg/m3), and PM1 (27.93 µg/m3). And for the industrial environments they were PM10 (185.43±168.54 µg/m3), PM7 (284.56±58.84 µg/m3), PM4 (207.74±19.4 µg/m3), PM2.5 (75.17±93.61 µg/m3), PM1 (22.37±24.61 µg/m3) (Figure 4). Peihan, et al. reported the effect of air pollution on the kids’ liver in the residential areas of Sabzevar city. The concentration of PM10 (53.8±36.1 µg/m3), PM2.5 (46.8±33.2 µg/m3), and PM1(41.7±29.1 µg/m3) is consistent with the order in our finding as PM10>PM2.5>PM1(25). Karimi, et al. reported similar results for PM10 and PM2.5 in Arak industrial town as the PM10 (49.78±35.13 µg/m3) > PM2.5(22.92±14.35 µg/m3), is also agree with our findings [26]. Barjoee, et al.
reported the PMs in a textile industry in Yazd, and the highest concentrations were PM10 (175.15µg/m3), PM7 (164.38 µg/ m3), PM4 (132.95 µg/m3), PM2.5 (98.5 µg/m3) and PM1 (7.74 µg/m3) respectively. Our findings showed that PM7 is higher in the industrial areas compared to remain and the rest of them are consistent with our findings [26]. Similar results are reported by Kioumourtzoglou, et al. and PM10 >PM2.5 > PM1 is declared in their report [27].
The Quality of the PMs
Today, megacities and industrial areas, especially in southwestern Iran, frequently suffer from heavy smog, which is mainly caused by heavy metals attached to PM10. Goudarzi, et al. reported the concentration of heavy metals in the ambient air of the city of Ahvaz, the highest and lowest concentration of heavy metals is reported in the industrial and residential areas, respectively. Zinc and lead were the most abundant elements among the heavy metals reported as PM10, followed by chromium and nickel. They reported that the combined carcinogenic risks of children and adults through inhalation and dermal exposure exceeded 1×10⁻⁴ [27]. Leili, et al. reported the concentration of heavy metals related to PM10. They reported Pb (132.53±109.34 ng/m-3), Cr (9.12±2.14 ng/m-3), Cd (6.87±2.22 ng/m-3) and 79% of PM10 samples contained Cd levels higher than WHO annual average guideline (0.005 µg/m-3) and Cr in all samples was higher than 2.5 ng/m-3, that corresponds to an excess of lifetime risk of 1: 10,000 [28]. Shahswani, et al. reported the quantitative estimates of the elemental compositions of suspended particles, in which the percentage of elements, respectively: Silicon (41.28%), Aluminum (13.56%), Calcium (12.62%), Magnesium (5.76%), Iron (3.37%), Potassium (2.93%), Sulfur (2.73%), Barium (1.65%), Copper (1.65%), Chlorine) 0.82%), Zinc (0.58%) [29].
Health Risk Assessment
Recently PM2.5 and PM10 are considered as Group I carcinogen by the International Agency for Research on Cancer [30]. According to the World Health Organization (WHO), ELCR values considered as “an acceptable limit for humans” in range from 1×10⁻⁵ to 1×10⁻⁶, but ELCR values < 1×10⁻⁶ are recommended by the USEPA [8, 31]. Table 1 summarizes the mean ELCR calculated for PM2.5 in ambient air of cities in Iran air quality monitoring stations for 10 different age groups. As can be seen in the table, the ELCR values were higher than Iran the standard recommended by the EPA for all the studied groups.
The expected cancer risk for all age groups were high, and unfortunately, these levels were much higher for children under 6 years old, indicating that these age groups are in risk of PM2.5 exposures in cities of Iran and therefore proper mitigation procedures should be used to decline the expected cancer risks to the children. Similar result is reported in the ambient atmosphere of Tehran which the expected cancer risk for all age groups were high, and the risk was much higher for children under 3 years old. Moreover, the level of cancer risk was higher in 2017 compared to 2016.It is reported that a range of 2.6–4.4 million premature deaths annually are attributed to air pollution [32].
| Age groups (year) | ||||||||||
|---|---|---|---|---|---|---|---|---|---|---|
| Birth to <1 | 1 to <2 | 2 to <3 | 3 to <6 | 6 to <11 | 11 to <16 | 16 to <21 | 21 to <61 | 61 to <71 | 71 and Older | |
| ELCR | 4936.2 | 4702.9 | 4187.2 | 4937.7 | 4644.2 | 4844.2 | 4844.3 | 4625 | 4726.8 | 4720 |
Table 2: Cancer risk (ELCR) related to PM2.5 concentrations in air of cities for Iran [10−6].
In order to assess non carcinogenic risk for PM2.5 and PM10 in air of cities of Iran in this research, the values of HQ are estimated for all age groups. The HQ values calculated are provided in Table 2. The values higher than 1 represent unacceptable exposure conditions with high chronic non- cancer risks for the target organs (58,59). As shown in the table, the mean of HQ in study period for PM2.5 (7.41), shows an unacceptable risk. It was also found that HQ calculated for PM10 was higher than 1 (mean HQ=2.9), indicating a slightly elevated risk. HQ values for outdoor air of most cities are higher than 1, indicating high non-carcinogenic risk in the cities. Similar results are reported in the ambient atmosphere of Tehran, which mean of HQ in study period for PM2.5, 6.1 (2016) and 6.4 (2017), indicating high non- carcinogenic risk [10]. Jafari, et al. reported the QH value of PM2.5 (0.81) and PM10 (4.96) in a hospital of Tehran. Exposure to PM can lead to some health effects such as lung inflammation, lung function reduction, deleterious impacts on the cardiovascular system, increased hospital admission, and sometimes death [33].
| Age groups (year) | ||||||||||
|---|---|---|---|---|---|---|---|---|---|---|
| Birth to <1 | 1 to <2 | 2 to <3 | 3 to <6 | 6 to <11 | 11 to <16 | 16 to <21 | 21 to <61 | 61 to <71 | 71 and Older | |
| PM 2.5 | 7.4 | 7.4 | 6.6 | 7.4 | 7.6 | 7.5 | 7.4 | 7.4 | 8.1 | 7.3 |
| PM 10 | 2.92 | 2.92 | 2.92 | 2.92 | 2.92 | 2.92 | 2.91 | 2.92 | 2.92 | 2.92 |
Table 3: Hazard quotient (HQ) related to PM2.5 and PM10 concentrations in ambient air of cities in Iran.
Conclusion
According to the results, the concentration of PM10 was higher than other PMs in all cases, also pollution caused by suspended particles is more in spring and summer than in autumn and winter. The concentration of these particles in industrial areas is more than in office and residential areas. The amount of PM10 and PM2.5 pollutions for all age groups is higher than the set guidelines and leads to an increase in the risk of cancer and non-cancer in people at risk. It seems that stricter inspection and regulations for controlling health risks is needed.
Acknowledgments
The authors are grateful to tank you of Semnan University of medical sciences to supporting this research.
References
-
Donaldson K, Mills N, MacNee W, Robinson S, Newby D (2005) Role of inflammation in cardiopulmonary health effects of PM. Toxicol Appl Pharmacol Elsevier 207(2): 483-488.
-
Ahmadi M, Dadashiroudbari A (2019) Spatio-Temporal Distribution of Particulate Matter (PM2. 5) with an Environmental Approach in West and Southwest of Iran Based on SeaWifs, MISR and MODIS Sensors. J Environ Stud.
-
Ghaderpoori M, Paydar M, Zarei A, Alidadi H, Najafpoor AA, et al. (2019) Health risk assessment of fluoride in water distribution network of Mashhad, Iran. Hum and Ecology Risk Assessment: An Int Journal 25(4): 851-862.
-
Yarmohammadi H, Poursadeghiyan M, Shorabi Y, Ebrahimi MH, Rezaei G, et al. (2016) Risk assessment in a wheat winnowing factory based on ET and BA method. J Eng Appl Sci 11(3): 334-338.
-
Qasemi M, Afsharnia M, Zarei A, Farhang M, Allahdadi M (2018) Non-carcinogenic risk assessment to human health due to intake of fluoride in the groundwater in rural areas of Gonabad and Bajestan, Iran: a case study. Hum Ecol Risk Assessement: An Int Journal.
-
Heydari G, Taghizdeh F, Fazlzadeh M, Jafari AJ, Asadgol Z, et al. (2019) Levels and health risk assessments of particulate matters (PM 2.5 and PM 10) in indoor/ outdoor air of waterpipe cafés in Tehran, Iran. Environ Sci Pollut Res. Springer 26: 7205-7215.
-
Greene NA, Morris VR (2006) Assessment of public health risks associated with atmospheric exposure to PM2. 5 in Washington, DC, USA. Int J Environ Res Public Health. Molecular Diversity Preservation International (MDPI) 3(1): 86-97.
-
Persad AS, Cooper GS (2008) Use of epidemiologic data in Integrated Risk Information System (IRIS) assessments. Toxicol Appl Pharmacol 233(1): 137-145.
-
Rostami R, Zarei A, Saranjam B, Ghaffari HR, Hazrati S, et al. (2019) Exposure and risk assessment of PAHs in indoor air of waterpipe cafés in Ardebil, Iran. Build Environ 155: 47-57.
-
De Oliveira BFA, Ignotti E, Artaxo P, do Nascimento Saldiva PH, Junger WL, et al. (2012) Risk assessment of PM2. 5 to child residents in Brazilian Amazon region with biofuel production. Environ Heal. BioMed Central 11(1): 1-11.
-
Li F, Xiao M, Zhang J, Yang J, Zhu L (2017) Health risk assessment on tunnel workers’ exposure to PM10 based on triangular fuzzy numbers. In: AIP conference proceedings.
-
Yarmohammadi H, Hamidvand E, Abdollahzadeh D, Sohrabi Y, Poursadeghiyan M, et al. (2016) Measuring concentration of welding fumes in respiratory zones of welders: An ergo-toxicological approach. Res J Med Sci 10(3): 111-115.
-
Mehrizi E, Biglari H, Amiri R, Baneshi MM, Mobini M, et al. (2017) Determine the important heavy metals in air dust of zahedan, Iran. Pollut Res 36: 474-480.
-
Davil FM, Rostami R, Zarei A, Feizizadeh M, Mahdavi M, et al. (2011) A survey of 24 hour variations of BTEX concentration in the ambient air of Tehran. J Babol Univ Med Sci 14(1): 50-55.
-
Biglari H, Geravandi S, Mohammadi MJ, Porazmey EJ, Chuturkova RZ, et al. (2017) Relationship between air particulate matter and meteorological parameters. Fresenius Env Bull 26(6): 4047-5406.
-
Huang DS, Zhang SQ (2013) Valuation of the health effects of particulate matter pollution in the Pearl River Delta, China. B Valuat Heal Eff Part matter Pollut Pearl River Delta, China City.
-
Zarandi MS, Shaktaie RH, Cheratee YJ, Hosseinzade F, Dowlati M (2012) Evaluation of PM2. 5 concentration and determinant parameters on its distribution in Tehran’s metro system in 2012. Journal of Mazandaran University of Medical Sciences 21(2): 37-46.
-
Bonyadi Z, Ehrampoush MH, Ghaneian MT (2016) Health impact assessment of the ambient PM2. 5 concentrations in Mashhad, Iran, in 2013. Journal of Rafsanjan University of Medical Sciences 15(5): 389-398.
-
Gilmour PS, Brown DM, Lindsay TG, Beswick PH, MacNee W, et al. (1996) Adverse health effects of PM10 particles: involvement of iron in generation of hydroxyl radical. Occup Environ Med 53(12): 817-822.
-
Nazari Z, Khorasani N, Feiznia S, Karami M (2017) Source identification of the elements in PM10 aerosols, case study: Kermanshah City. Phys Geogr Research 49(4): 557-569.
-
Kianisadr M, Ghaderpoori M, Jafari A, Karami M (2018) Zoning of air quality index (PM10 and PM2. 5) by Arc- GIS for Khorramabad city, Iran. Elsevier 19: 1131-1141.
-
Miri M, Ghassoun Y, Dovlatabadi A, Ebrahimnejad A, Löwner MO (2019) Estimate annual and seasonal PM1, PM2. 5 and PM10 concentrations using land use regression model. Ecotoxicol Environ Saf 174: 137-145.
-
Shahsavani A, Naddafi K, Haghighifard NJ, Mesdaghinia A, Yunesian M, et al. (2012) The evaluation of PM10, PM2. 5, and PM1 concentrations during the Middle Eastern Dust (MED) events in Ahvaz, Iran, from april through september 2010. J Arid Environ 77: 72-83.
-
Shahri E, Velayatzadeh M, Sayadi MH (2019) Evaluation of particulate matter PM2. 5 and PM10, (Case study: Khash cement company, Sistan and Baluchestan). J Air Pollut Heal.
-
Almasi A, Moradi M, Sharafi K, Abbasi S (2014) Seasonal variation in air quality of Kermanshah city in terms of PM10 Concentration over a four-year period (2008- 2011). Journal of Health 5(2): 149-158.
-
Karimi B, Shokrinezhad B (2021) Spatial variation of ambient PM2. 5 and PM10 in the industrial city of Arak, Iran: A land-use regression. Atmos Pollut Res 12(12): 101235.
-
Khosrorad R, Aval HE, Najafi ML, Rezai H, Dovlatabadi A, et al. (2022) The association of exposure to air pollution and depression in women; a cross-sectional study of a middle-income country. Environ Res 215: 114266.
-
Constantinescu S, Drăgan VM, Basliu V (2016) Research Study on The Environmental Risk Assessment For Particulate Matter (PM10). Int Multidiscip Sci GeoConference SGEM. Surveying Geology & Mining Ecology Management (SGEM) 2: 3-10.
-
Shahsavani A, Naddafi K, Jafarzade Haghighifard N, Mesdaghinia A, et al. (2012) The evaluation of PM10, PM2.5, and PM1 concentrations during the Middle Eastern Dust (MED) events in Ahvaz, Iran, from april through september 2010. Journal of Arid Environments 77: 72-83.
-
Prasannavenkatesh R, Andimuthu R, Kandasamy P, Rajadurai G, Subash Kumar D, et al. (2015) Assessment of population exposure to coarse and fine particulate matter in the urban areas of Chennai, India. Sci World Journal pp: 643714.
-
Delikhoon M, Fazlzadeh M, Sorooshian A, Baghani AN, Golaki M, et al. (2018) Characteristics and health effects of formaldehyde and acetaldehyde in an urban area in Iran. Environ Pollution 242: 938-951.
-
Horton DE, Skinner CB, Singh D, Diffenbaugh NS (2014) Occurrence and persistence of future atmospheric stagnation events. Nat Clim Chang 4(8): 698-703.
-
Jafari AJ, Delikhoon M, Rastani MJ, Baghani AN, Sorooshian A, et al. (2021) Characteristics of gaseous and particulate air pollutants at four different urban hotspots in Tehran, Iran. Sustain Cities Soc 70: 102907.
- Evaluation of Skin Aging Preventive Effects of Cherry Blossom Petal Extracts Through Antioxidant and Anti-Glycation Activities
- Is Cell Death Responsible for False Positive Results of In Vivo Comet Assay?
- Pattern of Gonadal Hormones in Oral Testosterone-Supplimented Male Wistar Rats with Diabetes-Induced Hypogonadism
- Re-Evaluation of the Genotoxicity of Currently Used Food Dyes in Mouse Multiple Organs Via Continuous Administration by Drinking Using the Comet Assay
- Pharmacogenetics of Type 2 Diabetes Mellitus: Linking Genetic Variability to Drug Efficacy and its Cardiovascular Outcomes
- Exploratory Proteomic Profiling of SARS-CoV-2 Infected THP-1 Macrophages Reveals Alterations in Inflammatory Response and Cellular Metabolism