Joint Modelling of the Relationship between CD4 Cell Count and Survival Analysis of HIV Infected Patients Receiving Antiretroviral Therapy, Gweru, Zimbabwe
Introduction: The main objective of this research is to apply joint modelling technique to assess the relationship between cd4 cell count and survival of ART patients in Gweru, Zimbabwe. The Cox proportional hazards model is mainly used in modelling survival data when the true values of the time-varying covariates are observed. However, most of these measurements are observed with error and to circumvent this problem, measurements are taken longitudinally to reduce the bias caused using such observed measurements in the Cox proportional hazards models. Methods: We conducted secondary data analysis on the Gweru district ART cohort data for the period 2006 to 2010. The association between CD4 cell count and survival time of the patient was determined using a joint longitudinal-survival model. The factors that affected cd4 cell changes were determined using mixed linear regression model and factors associated with survival of ART patients was determined using a Cox proportional hazard model. Shared parameters were used to determine the association between cd4 cell count and survival of the ART patient. Results: A statistically significant direct effect of gender on survival was observed -0.003 (95% CI: -001, -0.002). Also, a highly negative significant association was observed -9.48 (95% CI: -11.7, -7.23), indicating that female patients with high levels of lncd4 had reduced hazard of death compared to male patients. Place of residents of the ART patient had a significant direct effect on survival -0.66 (95% CI: -0.01, 0.003). There is also a highly negative significant association -10.0 (95% CI: -12.4, -7.67), indicating that patients in urban areas and with high lncd4 cell counts had a reduced hazard of death compared to patients in rural areas. Age had a direct effect on survival as the hazard of death increases as we move from one age group to another. A highly negative significant association was observed -9.4 (95% CI: -11.6, -7.17) indicating that the hazard of death for patients with high lncd4 decreases as we move down the age groups.
Introduction
The main objective in medical studies is to explore or investigate how survival times are associated with some time-independent or time–varying covariates [1]. The Cox proportional hazards model is mainly used in modelling survival data when the true values of the time- varying covariates are observed. However, most of these measurements are observed with error and to circumvent this problem, measurements are taken longitudinally to reduce the bias caused by using such observed measurements in the Cox proportional hazards models.
Many methods have been developed to separately model longitudinal and survival data. Mixed effects models have been suggested for longitudinal data and Weibull or semi parametric (Cox) proportional hazards models for survival data [2, 3]. Their separate use becomes compromised when the longitudinal variable is correlated to the patient health status which influences survival end point or possibility of study drop out [2]. Joint modelling of survival and longitudinal data has become a common phenomenon as this makes it possible to explore the measurement errors encompassed in these data. The joint model assumes a mixed effects model for longitudinal data and a proportional hazards model for survival times. Joint models tend to produce unbiased statistical inferences [4].
Longitudinal studies often lead to survival data. For instance in an HIV study we not only longitudinally measure CD4 cell counts over time for each subject but we may also be interested in the time to an outcome of interest, such as time to death or time to CD4 rebound. Two scenarios usually arise:
- Where the longitudinal model is taken as the primary model and the survival model as the secondary to model time to event of interest to avoid biased inferences for longitudinal model.
- Primary interest is on survival analysis with time- dependent predictors missing at failure times or with measurement errors. In this scenario longitudinal model is used to address the missing predictors or their measurement errors.
In the joint model, the survival model and the longitudinal model are assumed to be linked through shared parameters or shared unobserved variables.
Background of the Study
The Gweru District ART cohort: The Gweru District ART cohort was run by Medecins Sans Frontieres (MSF) Holland. MSF is an international, independent, medical humanitarian organisation. Its main mandate is to deliver emergency aid to people affected by armed conflicts, epidemics, natural disasters, and exclusion from healthcare. The organisation assists people based on need, irrespective of race, religion, gender, or political affiliation.
MSF was offering humanitarian aid to people infected with HIV in Gweru district starting in year 2006, before it handed over the operations to the Ministry of Health and Child Welfare (MOHCW) in 2011. The organisation operated at Mkoba 1 and Lower Gweru Mission Hospital Opportunistic Infections clinics. Their operations constituted the biggest HIV care service in the Midlands province of Zimbabwe. The clinics were established in 2006 and were involved in among other services HIV/AIDS interventions, nutritional and preventive services, and training of medical personnel.
Patients were enrolled into the cohort through voluntary counselling and testing (VCT) and through prevention of mother to child transmission programme (PMTCT). The organisation had a laboratory for conducting HIV tests through the services of qualified personnel. Patients were voluntarily counselled and tested for HIV. Those who consented were enrolled into the cohort and were offered treatment. An electronic database was designed to capture patient’s information. Demographic information of the patient at enrolment was captured and this includes gender, age, marital status, WHO disease staging, weight, height, CD4 cell counts, haemoglobin, ALAT (Alanine aminotransferase, creatinine, and history of HIV treatment. Baseline measurements for the patients were taken. Immunologic markers (such as CD4 cell counts) were measured after ART initiation at six months intervals. Date of death for the deceased patients was also recorded. Patients were followed up through a comprehensive patient monitoring system, capturing specific patient variables and outcomes overtime. The treatment protocols, drug regimens and programme reporting tools used at the centres were conforming to the national guidelines.
Human Immune Virus (HIV) infection leads to a depletion in CD4 T-helper cells leading to acquired immune deficiency syndrome (AIDS) in a period of 2 to 10 years depending on the patient. This variation in period of death due to AIDS has been mainly linked to differences in viral load [5]. AIDS progression also varies by age and the relative risk of developing AIDS by any given time after sero-conversion was 1.45 for each ten year increase in age [6]. Younger patients had a higher chance, 20 year survival than older patients [7].
There is an association between progression to AIDS and a rapid decline in CD4 cell counts [8]. Antiretroviral therapy (ART) which fights against HIV infection has been in use since 1996. ART suppresses the viral load, consequently allowing the patient’s immune system to recover and protecting him or her from developing AIDS and death. ART is mainly recommended to those patients with very high viral load and those experiencing a rapid drop in CD4 cell count. Treatment can also be initiated irrespective of CD4 cell count but also depending on patient’s clinical condition (World Health Organization (WHO) disease staging) or another HIV related condition like renal failure and pregnant mothers.
Increases in CD4 cell counts, and mortality and loss to follow up depend on time on ART as well as on current CD4 cell count [9]. Low CD4 cell counts are highly related to development of opportunistic infections (SMART study group, 2008) [10]. Initiation of ART at a CD4 cell count more than 350 cells/µl was seen to result in longer quality- adjusted survival compared to starting ART at lower CD4 cell counts [11]. Data from the EUROSIDA study suggested that all patients could eventually experience normalization of their CD4 cell counts, regardless of their starting CD4 cell count [12].
Researchers often opt for cross sectional analyses even if exposed to longitudinal data. Their analyses usually make use of a single wave of data or focus on change in scores between only two waves. Such an analysis discards an enormous amount of data that are useful and central in describing the complex health trajectories over time.
Statisticians have shown great interest in modelling longitudinal and survival data. The genesis of work on joint modelling of longitudinal and survival data was work by Tsiatis et al. [12], Wulfsohn et al. [13], De Gruttola, et al. [14], Wang, et al. [15], and Henderson, et al. [16]. Tsiatis, et al. [12] developed the methods for developing joint models for longitudinal and survival data, Wulfsohn, et al. [13] developed a joint model for survival and longitudinal data measured with error, De Gruttola, et al. [14] modelled the progression of CD4-lymphocyte count and its relationship to survival time. Furthermore, Wang, et al. [15] modelled longitudinal and event time data with application to acquired immunodeficiency syndrome and Henderson, et al. [16] also modelled longitudinal and event time data.
Limitations of the study: The study mainly concentrated on secondary data analysis. Other variables which may be of interest in explaining changes in cd4 cell count were not captured for example viral load.
Methodology
A secondary data analysis was done on HIV patient data collected by MSF in Gweru district for the period 2006 to 2010. The dataset had 145 variables and 11 930 ART patients and data for all the patients were analysed.
Study Variables
The longitudinal outcome variable is the CD4 cell count and the survival time is the survival outcome, with death as the censoring indicator. The variable cd4 count was transformed into the natural logarithm of cdd4 (lncd4). The covariates to be examined are gender, age, profession, marital status, WHO disease stage and nutritional status (defined using body mass index (BMI). BMI is calculated by dividing the patients’ weight in kilograms by the square of the height in metres. Patients were grouped into three nutritional groups using BMI (BMI < 18.5 underweight, 18.5- 24.9 Normal weight and > 25 overweight). A new variable age group was generated with patience below 15 years recoded as 1, 15 to 49 years recoded as 2 and above 49 years recoded as 3.
• Data Management The variable bmi_n for body mass index was generated in Stata13 and patients were regrouped into three nutritional groups using BMI as stated above. A value 3 represent the underweight, 2 the normal weight and 1 the overweight. Dummy variables were also created for bmi_n (bmi_n1, bmi_ n2 and bmi_n3), WHO disease staging (fstwhoc1, fstwhoc2, fstwhoc3, fstwhoc4), profession, marital status and place of residence and for the variable age group (agegrp1, agegrp2, agegrp3). Marital status was further categorized as staying with a partner (marit_stat= 1) or not staying with a partner (marit_stat= 0), with those married classified as staying with a partner and those single, widowed, divorced and separated as not staying with a partner. WHO disease staging was further categorized as patient_condition =1 for the patients in WHO disease stages 3 and 4 and patient_condition = 0 for the patients in WHO disease stages 1 and 2. Employment status was further categorized as employed (employ_stat =1for formal employment, health worker, self-employed) and unemployed (employ_stat=0 for unemployed, student/ child and other). The Xtset command was used to transform the data into longitudinal data. The Stset command was used to transform the data into survival data. A patient who died during the follow up period was recoded 1 and surviving patient was recoded 0. Missing data were assumed to be missing at random.
Data Analysis
The joint model for the longitudinal process and the survival process was developed by considering the situation where the longitudinal model is the primary model and the survival model is the secondary model. Separate longitudinal model is developed using CD4 cell count as the longitudinal outcome and considering gender, age, profession, marital status, WHO stage and nutritional status as the explanatory variables. Separate survival model using time to death as the outcome variable and considering gender, age, profession, marital status, WHO stage and nutritional status as the explanatory variables is also developed [17].
• Longitudinal Model Development Individual CD4 measurements are plotted overtime and fitting a smoothing spline overtime, to identify general trends within subjects and suggest possible transformations to be done on CD4 data depending on the nature of the distribution. Mixed linear regression models are run in Stata 13 software with CD4 cell count as the outcome variable and gender, age, profession, marital status, WHO stage and nutritional status as the explanatory variables. The Lemeshow-Hosmer statistic was used to determine the covariates to be considered in the model. A full linear mixed effects model (with all the main effects and the time by main effects interactions) is fit using statistically significant and subject matter importance covariates by the Maximum Likelihood Estimation (MLE) method. Backward elimination technique is used in model development with the least statistically significant interaction term removed first.
• Survival Model Development 1. Univariate Kaplan –Meier curves are plotted in Stata 12 on gender, profession, marital status, WHO stage, ART regimen and nutritional status to gain insights on the shape of the survival functions for each group and to check if the groups are proportional (that is if the survival functions are approximately parallel). Univariate Cox proportional hazard regression is done also in Stata 11 on age and weight. 2. A multivariate model that contains all the covariates that are deemed relevant from Univariate analysis is first considered. The statistical significance of each covariate is judged on the corresponding size of the p-value. Covariates with p-value greater than 0.05 will not be included in the model, except for those covariates of known subject matter importance. 3. Interaction terms are generated and added to the multivariate model built above. Interaction terms are tested based on their p-values. Covariates with p-values above 0.05 are disregarded and those with a p-value less than 0.05 are included in the model. The model with interaction terms will be compared to the one without interaction terms. The likelihood ratio test will be used to test the difference between the two models. Proportional hazard test is done in Stata using the stphtest command and we fail to reject proportionality for p-values greater than 0.05.
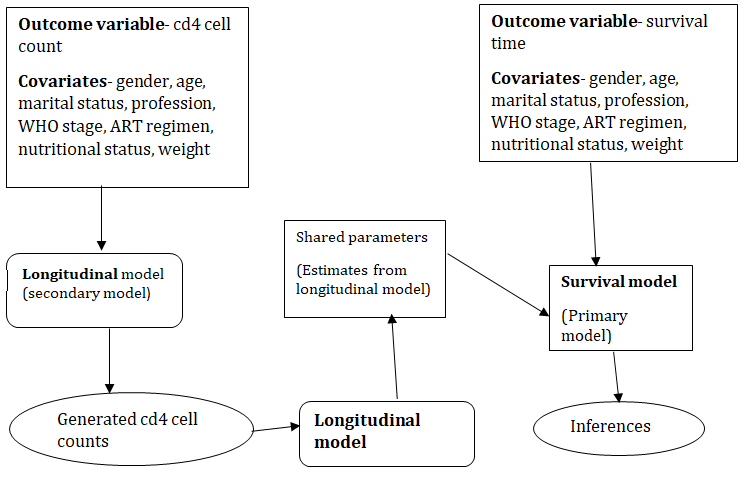
• Joint Model (longitudinal-survival model) The modified two step method was used to jointly model the longitudinal process (CD4 cell count) and the survival process (survival time). The longitudinal model developed above is taken as the secondary model and the survival model is taken as the primary model. The steps are are shown in Figure 1.
Results
Demographics
11 930 HIV infected patients were enrolled into the Gweru district ART cohort between January 2006 and December 2010. The following table gives the demographic characteristics of the Gweru district ART cohort (Tables 1-5).
| Variable | Category | Number (N=11930) | Proportion (%) |
|---|---|---|---|
| Gender | male | 3852 | 32.3 |
| Gender | female | 8078 | 67.7 |
| Profession | unemployed | 9042 | 76.2 |
Table 1: Mixed linear regression model parameters.
- self employed
- 522
- 4.4 student/child
- 174
- 9.9
- (n= 11863) formal employed
- 199
- 8.9 other
- 9
- 0.3
- Marital status single
- 2524
- 21.4 divorced
- 763
- 6.4 married
- 5987
- 50.8
- (n= 11794) separated
- 496
- 4.2 widowed
- 2024
- 17.2
- WHO stage
- 1
- 3741
- 32.7
- 2
- 2386
- 28.9
- (n= 11432)
- 3
- 4335
- 37.9
- 4
- 970
- 8.5
- Nutritional status
- Underweight
- 1378
- 12.5
- (n= 11013)
- Normal
- 5947
- 54
- Overweight
- 3688
- 33.5
- Origin
- Eastern surbubs
- 382
- 3.2
- Gweru rural
- 6090
- 51.1
- (n= 11926)
- Western surbubs
- 5372
- 45
- Other
- 16
- 0.7
- Age group
- < 15 years
- 1177
- 9.9
- (n= 11930)
- 15-49 years
- 9271
- 77.7 over 49 years
- 1482
- 12.4
Table 2: Demographic characteristics of subjects.
The mean age of the patients was 33.5 years with a standard deviation of 13.8 years. Majority of the patients were in the 15 to 49 years age category and were married. There were more female patients in the cohort.
Mixed Linear Regression Model
| coefficient | Standard error | 95% | p-value | |
|---|---|---|---|---|
| Age group | ||||
| 15 to 49 years | -1.14 | 0.03 | (-1.21, -1.08) | < 0.001 |
| above 49 years | -1.13 | 0.04 | (-1.21, -1.05) | < 0.001 |
| Gender | 0.24 | 0.02 | (0.20, 0.28) | < 0.001 |
| Patient condition | -0.46 | 0.03 | (-0.52, -0.39) | < 0.001 |
| Nutritional Status | ||||
| Overweight | 0.4 | 0.04 | (0.32, 0.48) | < 0.001 |
| Normal weight | 0.28 | 0.03 | (0.22, 0.34) | < 0.001 |
| Marital Status | 0.06 | 0.02 | (0.02, 0.09) | 0.001 |
| Place of residence | 0.09 | 0.02 | (0.06, 0.13) | < 0.001 |
| Patient condition and overweight | 0.23 | 0.06 | (0.11, 0.36) | 0.003 |
Table 3: Mixed linear regression model parameters.
| Patient condition and normal weight | 0.16 | 0.04 | (0.08, 0.23) | < 0.001 |
|---|---|---|---|---|
| Constant | 6.27 | 0.03 | (6.21, 6.34) | < 0.001 |
| Random effects component | ||||
| Parameter | Estimate | Standard error | 95% C.I | |
| Id: identity sd(_cons) | 0.59 | 0.01 | (0.58, 0.61) | |
| Sd(Residual) | 0.77 | 0.05 | (0.76, 0.78) |
Table 4: Mixed linear regression model parameters.
The expected CD4 cell count for a HIV infected patient on ART averages 508 across all patients, but shows little variation, with a standard deviation equal to 2. The gain in CD4 cell count is estimated to be 2 units in female patients compared to male patients and differ by a single unit in the nutritional groups. CD4 cell count gain also decreases by a single unit as we move across the age groups in comparison to the below 15 years age group. Overweight and normal weight patients have a gain of a single unit CD4 cell count compared to the underweight patients.
Survival Analysis
| Chi-square value | p-value | |
|---|---|---|
| Gender | 6.84 | 0.01 |
| Employment status | 1.69 | 0.19 |
| Marital Status | 2.04 | 0.15 |
| Place of residence | 10.38 | 0.001 |
| Patient condition | 10.87 | 0.001 |
| Nutritional status | 1.44 | 0.49 |
| Age group | 25.2 | < 0.001 |
Table 6: Proportionality test for Kaplan Meier curves.
From the above results the Kaplan Meier curves for employment status, marital status and nutritional status are not parallel while those for gender, patient condition, place of residence and age group are parallel. The assumption of
Joint longitudinal Survival Model
proportional hazards is violated in many covariates; hence the proportional hazards model may not be applicable.
| ln(survival time) | Hazard ratio | 95% CI | p-value | |
|---|---|---|---|---|
| gender | 0.59 | (0.41, 0.84) | 0.003 | |
| place of residence | 0.5 | (0.35, 0.72) | < 0.001 | |
| Age group | ||||
| 15 to 49 years | 4.62 | (1.84, 11.6) | 0.001 | |
| above 49 years | 7.97 | (3.09, 20.5) | <0.001 | |
| Marital status | 0.61 | (0.43, 0.88) | 0.01 | |
| Patient condition | 1.89 | (1.33, 2.71) | < 0.001 |
Table 5: Multivariate survival model.
Survival of ART patients vary by gender; with the hazard of death for female patients being 41% less than that for male patients. Patients above 49 years of age have a hazard of death 7.97 times compared to patients below 15 years. The 15 to 49 years age group has a hazard of death 4.62 times compared to patients below 15 years. This shows that there is an increase in the hazard of death as we move from one age group to another. This is because young patients respond better to treatment than the old because of the differences in their physiology. Patients who were enrolled at WHO disease stages 3 and 4 have a hazard of death 1.89 times compared to patients enrolled at stages 1 and 2.
| Association parameter coefficient | Standard error | 95% CI | p-value | |
|---|---|---|---|---|
| gender | -0.003 | 0.001 | (-0.001, -0.002) | 0.04 |
| ln(surv_time) | -9.48 | 1.15 | (-11.7, -7.23) | < 0.001 |
| place of residence | -0.66 | 0.56 | (-0.01, 0.003) | 0.001 |
| ln(surv_time) | -10 | 1.2 | (-12.4, -7.67) | < 0.001 |
| Age group | 0.003 | 0.002 | (0.0001, 0.01) | 0.04 |
| ln(surv_time) | -9.4 | 1.14 | (-11.6, -7.17) | < 0.001 |
Table 7: Joint longitudinal survival model.
A statistically significant direct effect of gender on survival was observed -0.003 (95% CI: -001, -0.002). Also, a highly negative significant association was observed -9.48 (95% CI: -11.7, -7.23), indicating that female patients with high levels of lncd4 had reduced hazard of death compared to male patients. Place of residents of the ART patient had a significant direct effect on survival -0.66 (95% CI: -0.01, 0.003). There is also a highly negative significant association -10.0 (95% CI: -12.4, -7.67), indicating that patients in urban areas and with high lncd4 cell counts had a reduced hazard of death compared to patients in rural areas. Age had a direct effect on survival as the hazard of death increases as we move from one age group to another. A highly negative significant association was observed -9.4 (95% CI: -11.6, -7.17) indicating that the hazard of death for patients with high lncd4 decreases as we who move down the age groups.
Discussion and Conclusions
In this paper, joint longitudinal-survival model was used to model the relationship between cd4 cell count and survival of HIV infected patients receiving ART. The linear mixed effects regression model was used to develop the longitudinal process and the Cox proportional hazards model was used to develop the survival process.
In our study we found out that there is a positive association between cd4 cell count and survival time of ART patients. This concurs with the results obtained by Qian Ye using the naive two-step method.17 Female ART patients with high cd4 cell counts have a reduced hazard of death. This result might be due to the over representation of females, since majority of the participants were females in the cohort. The other reason for overrepresentation of females is the high involvement of females in PMTCT services compared to their male counterparts. Male behaviors like alcohol drinking or smoking may be other exacerbating factors on their increased hazard of death compared to female patients.
Urban patients with higher cd4 cell count also had a reduced hazard of death. This might be due the difference in the living conditions and lifestyles of the urban and rural populations. The urban population has modest lifestyles and standards of living compared to the rural population. Since nutrition is known to be important in immunological response, the urban population is most likely to get better nutrition compared to the rural population. Therefore, the urban patients may respond better to treatment because of this difference in lifestyles and living conditions. Mostly urban population is comprised of highly educated population compared to the rural population and this influences adherence, hence affect survival of the patient.
7.
Age also influenced survival of ART patients, as the hazard of death varied across age groups. Patients below 15 years of age had least hazard of death compared to the patients in the 15 to 49 age group and those above 49 years of age. This is mainly due to the difference in the physiology of the young people compared to the old.
Changes in cd4 cell count were mainly defined by gender, age, patient condition and nutritional status. Female patients had their log cd4 count increasing compared to male patients. Patients in WHO disease stages 3 and 4 experienced a decrease in the log cd4 count compared to patients in the WHO disease stages 1 and 2. Underweight patients experienced the least increase in log cd4 count. Therefore gender, age patient condition and nutritional status are important in assessing CD4 cell count changes in ART patients.
References
-
Jean de DT, Shen ML, Wang CY (2011) Joint modeling of survival time and longitudinal data with subject-specific change points in the covariates. Statistics in Medicine 30(3): 232-249.
-
Guo X, Bradley P Carlin (2004) Separate and joint modelling of longitudinal and event time data using standard computer packages. The American Statistician 58(1): 16-24.
-
Michael JC, Keith RA, Lambert PA (2013) Joint modelling of longitudinal and survival data. The Stata Journal 13(1): 1-20.
-
Tsiatis AA, Degrutolla V, Wulfsohn MS (1995) Modelling the relationship of survival to longitudinal data measured with error, Applications to survival and CD4 counts in patients with AIDS. Journal of the American Statistical Association 90: 27-37.
-
Ramy AA, Lloyd AL, O’Brien TR (1999) A simple relationship between viral load and survival time in HIV-1 infection. Proceedings of the national academy of sciences of the United States of America 96(20): 11549- 1153.
-
Caroline SA, Phillips J, Elford (1993) The Progression of HIV disease in a haemophilic cohort followed for 12 years. British Journal of Haematology 83(2): 330-333. Bowen FE, Wilson P, Cope A, Sabin A (1996) Cytomegalovirus retinitis in AIDS patients: influence of cytomegaloviral load on response to ganciclovir, time to recurrence and survival. AIDS official journal of the international AIDS society 10(3): 1515-1520.
-
Freedberg KA, Losina E, Weinstein MC, Paltiel AD, Cohen CJ, et al. (2001): The Cost Effectiveness of Combination Antiretroviral Therapy for HIV Disease. N Engl J Med 344(11): 824-831.
-
Lundgren JD, Babiker AA, El-Sadr WW (2008) Strategies for Management of Antiretroviral Therapy (SMART) Study Group. The Journal of infectious diseases 197(8): 1145-1155.
-
Mauskopf J, Mari K, Teresa K (2005) HIV Antiretroviral Treatment: Early Versus Later. JAIDS Journal of Acquired Immune Deficiency Syndromes 39(5): 562-569.
-
Mocroft A, Schlomo S, Weber R (2007) Risk of discontinuation of Nevirapine due to toxicities in antiretroviral-naïve and experienced HIV infected patients with high and low CD4 T-cells counts. Antiretroviral therapy 12: 325-333.
-
Tsiatis A, Davidian M (2004) Joint modelling of longitudinal and time to event data: an overview. Statistica Sinica 14: 809-834.
-
Wulfsohn MS, Tsiatis AA (1997) A joint model for survival and longitudinal data measured with error, Biometrics 53(1): 330-339.
-
De Gruttola V, Tu XM (1994) Modelling progression of CD4-lymphocyte count and its relationship to survival time. Biometrics 50(4): 1003-1014.
-
Wang Y, Taylor JMG (2001) Jointly modeling longitudinal and event time data with application to acquired immunodeficiency syndrome, Journal of the American Statistical Association 96(455): 895-905.
-
Henderson R, Diggle P, Dobson A (2000) Joint modelling of longitudinal measurements and event time data, Biostatistics 1(4): 465-480.
-
Qian Ye (2012) Two step and likelihood methods for joint models. The university of British Columbia. pp: 1-92.
- Are the Vaccines the Only Solution to Prevent the COVID-19 Pandemic? Part Two
- Clinical Characteristics of Women in this New Global Immunodeficiency
- Cell Dynamics in HIV Pathogenesis: Insights and Implications
- Determination of the CDR (CDR1, CDR2) « Complementary- Determining Region Invertebrate Primitive Antibody from Sea Star »
- Prioritizing Care for High-Risk COVID-19 Patients in the EU: 10 Civic Recommendations to the Institutions
- Comprehensive Insights into ModRNA Vaccines: Persistent PP-Spike Recombinant Protein, Hyperimmune/Inflammatory Reactions, Thrombotic Vasculopathy, Chronic Organ Complications and Excess Deaths