Frequency of Prediabetes According to Optimal Cut-Points for Body Mass Index in Saudi Population
Background and Objective: The prevalence and incidence of prediabetes are increasing worldwide. Body mass index (BMI) cut-off for prediabetes can vary. The objective of this study is to identify the optimal BMI cut-off that is associated with prediabetes. Methods: For the present study, we analyzed participants who are equal to or older than 18 years old. A total of 5498 were selected to be enrolled for the present study. All patients were from the population of the primary health and diabetic Centers at King Fahad Armed Forces Hospital. Participants were defined as having prediabetes according to selfreport, clinical reports, use of antidiabetic agents and HbA1c (5.7-6.4). All data were collected by personal interview and on the basis of a review of electronic medical data. Weight (kg) and height (cm) were measured by physician and nurse interviewers and recorded. The optimal sensitivity and specificity using different BMI cut-off values to predict the presence of prediabetes were examined by receiver operating characteristic curve analysis.Results: Of the 5498 participants analyzed, 2049 (37.3%) were male and 3449 (62.7%) were female with female to male ratio 1.7:1. Age was 42.7 ± 15.8 (minimum 18 years and maximum 105 years ) and males were significantly older than females (45.3 ± 16.6 vs. 41.1 ± 15.1 respectively, p
Khan1 and Bandari K Aljabri2
Saudi Arabia
khalidsaljabri@yahoo.com with prediabetes.
presence of prediabetes were examined by receiver operating characteristic curve analysis.
cut-off values based on the lowest significant association between BMI and the risk factors from the logistic regression analysis showed that the risk of prediabetes was significantly increased at BMI values as low as 21 kg/m2 and has not been increased as BMI increased. Applying this criterion to identify the cut-off values resulted in improvements in sensitivity, false negative rate and worsening in specificity and false positive rate. Using these lower BMI cut-offs resulted in a very small false negative rate ranging from 0.07 to 0.09. A significant positive association for total population was observed with BMI values starting at 21 kg/m2 and non significant association with BMI values for both genders.
Conclusion: The diagnostic usefulness of BMI alone in defining obesity as risk for prediabetes is limited among men and women Saudi adults.
Keywords: Prediabetes; Body Mass Index
Introduction
Prediabetes is defined as blood glucose concentrations higher than normal, but lowers than established thresholds for diabetes itself [1]. According to the World Health Organization, high risk for developing diabetes relates to two distinct states, impaired fasting glucose defined as fasting plasma glucose of 6.1–6.9 mmol/L (in the absence of impaired glucose tolerance) and impaired glucose tolerance defined as post load plasma glucose of 7.8–11.0 mmol/L based on 2-h oral glucose tolerance test or a combination of both [2]. The American Diabetes Association, although applying the same thresholds for impaired glucose tolerance, uses a lower cut-off value for impaired glucose tolerance (fasting plasma glucose=5.6– 6.9 mmol/L) and has additionally introduced HbA1c levels of 5.7–6.4% as a new category of high diabetes risk [1]. Individuals with impaired fasting glucose and/or impaired glucose tolerance were referred as having prediabetes, showing the relatively high risk for the future development of diabetes and associated complications [1, 3]. Although complications and target organ disease is more common with hyperglycaemia at the levels associated with diabetes, vascular complications, nephropathy, retinopathy and neuropathies are more common in people with prediabetes than individuals at normal blood glucose levels [4, 5, 6, 7, 8]. In addition, previous studies have observed about 35-39% of impaired glucose tolerance was undiagnosed in acute heart attack patients [9, 10, 11]. Furthermore, a substantial number of individuals with prediabetes progress to diabetes [12]. In particular, between 5% and 10% of people with prediabetes progress to diabetes each year [13].
Globally, diabetes has been increasing, as has intermediate hyperglycaemia and by 2030, it can rise up to >470 million people suffering from it [14, 15]. In the USA, the prevalence of prediabetes has been steadily increasing [15]. The 2010 estimate of prediabetes among adults in the USA was 36.2%. Recent data have shown that in developed countries, such as the Unites States and the United Kingdom, more than one-third of adults have prediabetes, but most of these individuals are unaware they have the condition [14, 15, 16]. The 2010 prevalence of prediabetes among adults in China was even higher at 50.1% [16]. In Saudi Arabia, primary epidemiological diabetes features are not different. Statistics regarding the increasing trend of prediabetes in the world have also been observed in Saudi Arabia. As per the WHO country profile 2015, the prevalence of prediabetics was found to be 9.0% in Jeddah with 9.4% in men [17, 18]. Another study conducted in Saudi population revealed that the impaired fasting glucose was 25.5%. Once detected, prediabetes needs to be acknowledged with a treatment plan to prevent or slow the transition to diabetes [19, 20]. Treatment of prediabetes is associated with delay of the onset of diabetes [21]. Detection and treatment of prediabetes is therefore a fundamental strategy in diabetes prevention [1].
The most commonly used indicator to evaluate excess body fat and measurement of the degree of Obesity is body mass index (BMI) as a known risk factor of prediabetes [22, 23, 24]. Although this index has advantages in clinical and epidemiological practice, as a non-invasive and low-cost method, its predictive value for chronic diseases has been questioned, especially when applied to certain population groups [15, 16, 17]. Increasing evidence suggests that the excess body fat in overweight and obese people might lead to increased degradation of fat, which resulted in the production of large amounts of free fatty acids (FFAs). When the level of FFAs was higher in blood, the capacity of liver tissue for insulin-mediated glucose uptake and utilization was lower, so the blood glucose level was high in circulation [25]. In other words, high FFAs in the blood were one of the important pathogenic factors of obesity caused by insulin resistance [26].
Current recommendations for prediabetes screening by the American Diabetes Association focus nearly exclusively on adults who are overweight or obese as defined by BMI until the patient meets the age-oriented screening at 45 years [1]. Further, the recently released recommendation from the US Preventive Services Task Force regarding screening for abnormal glucose levels limits screening to individuals who are overweight or obese [27]. This focus on obese or overweight individuals, Although obesity and prediabetes have shown trends of increasing prevalence. Although obesity and prediabetes have shown trends of increasing prevalence. Identifying individuals likely to be affected by prediabetes using a simple indicator such as BMI is an important step toward reducing the burden of diabetes in Saudi communities. This focus on obese or overweight individuals, however, may lead to missed opportunities for investigation of undetected disease in healthy-weight individuals. It has not been fully investigated whether a BMI cut-off lower than 25 kg/m2 is feasible to indicate elevated likelihood of having prediabetes in population of Saudi Arabia. The objective of this study is to identify the optimal BMI cut- off that is associated with prediabetes.
Methods
For the present study, we analyzed participants who are equal to or older than 18 years old. A total of 5498 were selected to be enrolled for the present study. All patients were from the population of the primary health and diabetic Centres at King Fahad Armed Forces Hospital. Participants were defined as having prediabetes according to self-report, clinical reports, use of antidiabetic agents and HbA1c (5.7-6.4) [1]. All data were collected by personal interview and on the basis of a review of electronic medical data. Weight (kg) and height (cm) were measured by physician and nurse interviewers and recorded and BMI was calculated.
Statistical Analysis
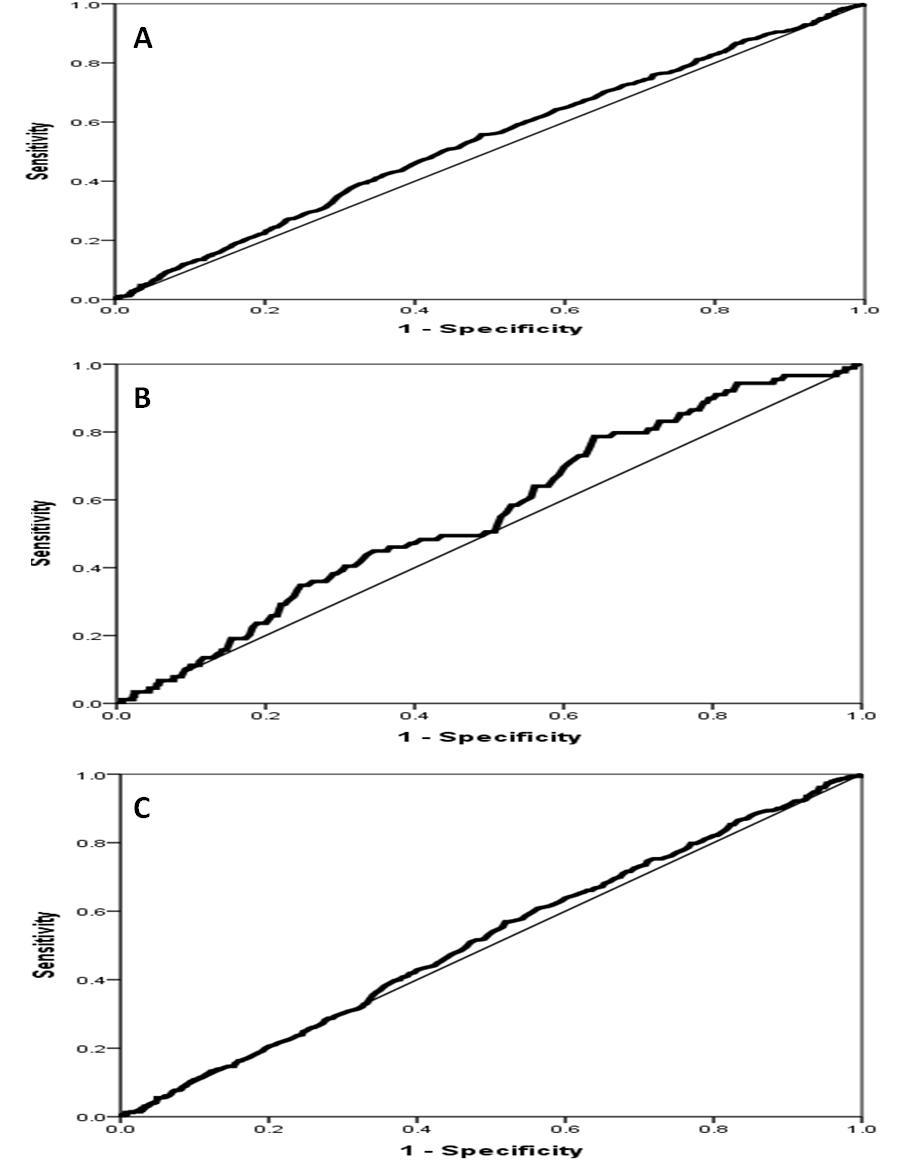
Univariate analysis of demographic and clinical laboratory was accomplished using unpaired t-test between variables, to estimate the significance of different between groups where appropriate. Chi square (X2) test were used for categorical data comparison. The optimal sensitivity and specificity using different BMI cut- off values to predict the presence of diabetes were examined by receiver operating characteristic curve (ROC) analysis. A greater area under the curve (AUC) indicates better predictive capability. An AUC=0.5 indicates that the test performs no better than chance, and an AUC=1.0 indicates perfect discrimination. An ideal test is one that reaches the upper left corner of the graph (100% true positives and no false positives). To determine the optimal BMI cutoff points, we computed and searched for the shortest distance between any point on the curve and the top left corner on the y-axis. Distance was estimated at each one-half unit of BMI according to the equation: Distance in ROC curve= (1−sensitivity)2+(1−specificity)2 [28, 29]. Additional criteria were also used to select cut-offs, including the greater sum of sensitivity and specificity, the smallest misclassification rate, and the significant associations between BMI and risk factors based on the logistic regression. Diagnostic performance of BMI in predicting diabetes was assessed by calculating AUC, sensitivity, specificity, likelihood ratios, false positive, false negative and the total misclassification rate. All results are presented as mean ± standard deviation or percentage, where applicable. Data analysis was performed in men and women separately. BMI was stratified in unit of 0.5 for both men and women. A BMI <15.0 was considered as the reference. Logistic regression analysis was used to examine the independent relationship between the stratified BMI and the odds ratio of having diabetes. All statistical analyses were performed using SPSS Version 22.0. The difference between groups was considered significant when P<0.05.
Results
Of the 5498 participants analyzed, 2049 (37.3%) were male and 3449 (62.7%) were female with female to male ratio 1.7:1. Age was 42.7 ± 15.8 (minimum 18 years and maximum 105 years) and males were significantly older than females (45.3 ± 16.6 vs. 41.1 ± 15.1 respectively, p<0.0001). BMI was 29.6 ± 6.9Vwhere females had higher BMI than males (30.1 ± 7.5 vs. 28.8 ± 5.5 respectively, p<0.0001), table 1. Prediabetes was present in 579 (10.5%), 89 (15.4%) were male and 490 (84.6%) were female with female to male ratio 5.5:1.
Khalid S Aljabri, et al. Frequency of Prediabetes According to Optimal Cut-Points for Body Mass Index in Saudi Population. Diabetes Obes Int J 2018, 3(3): 000183.
| Parameter | Total | Male | Female | P value |
| n(%) | 5498 | 2049(37.2) | 3449(62.7) | |
| Age(years) | 42.7±15.8 | 45.3±16.6 | 41.1±15.1 | <0.0001 |
| Body mass index(kg/m²) | 29.6±6.9 | 28.8±5.5 | 30.1±7.5 | <0.0001 |
| Prediabetes | 579(10.5) | 89(15.4) | 490(84.6) | <0.0001 |
Table 1: Population characteristics (means ± SD or number (%)).
| Parameters | Area under curve (95% CI) | Cut-offs BMI kg/m² | Sensitivity | Specificity | False positive rate | False negative rate | Positive likelihood ratio | Negative likelihood ratio | Misclassification rate |
| Total | 0.535(0.511-0.560) | 29.0 | 0.53 | 0.54 | 0.46 | 0.47 | 0.98 | 0.87 | 0.93 |
| Male | 0.560(0.503-0.617) | 28.0 | 0.52 | 0.50 | 0.50 | 0.48 | 1.04 | 0.96 | 0.98 |
| Female | 0.517(0.490-0.544) | 29.5 | 0.54 | 0.50 | 0.50 | 0.46 | 1.08 | 0.92 | 0.96 |
Table 2: Diagnostic performance of BMI in detecting prediabetes using optimal BMI cut-off values based on the shortest Table 2: D
| Parameters | Area under curve (95% CI) | Cut-offs BMI kg/m² | Sensitivity | Specificity | False positive rate | False negative rate | Positive likelihood ratio | Negative likelihood ratio | Misclassification rate |
| Total | 0.535 (0.511-0.560) | 21.0 | 0.917 | 0.09 | 0.91 | 0.083 | 1.01 | 0.92 | 0.99 |
| Male | 0.560 (0.503-0.617) | 21.0 | 0.908 | 0.102 | 0.898 | 0.092 | 1.03 | 0.92 | 0.99 |
| Female | 0.517 (0.490-0.544) | 21.0 | 0.966 | 0.062 | 0.928 | 0.072 | 1.04 | 0.86 | 1.00 |
Table 3: Diagnostic performance of BMI in detecting prediabetes using optimal BMI cut-off values based on the significant Table 3
Khalid S Aljabri, et al. Frequency of Prediabetes According to Optimal Cut-Points for Body Mass Index in Saudi Population. Diabetes Obes Int J 2018, 3(3): 000183.
Table 4 shows the odds ratios of the association between prediabetes and BMI in male and female. A significant positive association for total population was observed with BMI values starting at 21 kg/m2 and non significant association with BMI values for both genders.
| BMI (kg/m2) | Total | Male | Female | |||
| BMI (kg/m2) | Odd ratio (95% CI) | P | Odd ratio (95% CI) | P | Odd ratio (95% CI) | P |
| <15.0 | 0.6 (0.2-2.3) | 0.5 | - | - | 0.6 (0.2-2.4) | 0.5 |
| 15.0-15.9 | - | - | - | - | - | - |
| 16.0-16.9 | 2.0 (0.6-6.8) | 0.3 | - | - | 1.7 (0.5-5.7) | 0.4 |
| 17.0-17.9 | 1.9 (0.7-5.6) | 0.2 | 1.2 (0.1-12.1) | 0.9 | 1.8 (0.5-6.1) | 0.4 |
| 18.0-18.9 | 1.3 (0.6-2.9) | 0.5 | 1.4 (0.1-14.6) | 0.8 | 1.1 (0.5-2.6) | 0.8 |
| 19.0-19.9 | 1.3 (0.6-2.5) | 0.5 | 2.5 (0.3-25.0) | 0.4 | 0.8 (0.4-1.8) | 0.7 |
| 20.0-20.9 | 1.2 (0.6-2.1) | 0.6 | - | - | 0.9 (0.5-1.7) | 0.9 |
| 21.0-21.9 | 2.9 (1.4-6.0) | 0.005 | - | - | 1.8 (0.9-3.9) | 0.1 |
| 22.0-22.9 | 1.9 (1.0-3.5) | 0.05 | 2.4 (0.4-14.9) | 0.3 | 1.3 (0.7-2.6) | 0.4 |
| 23.0-23.9 | 1.2 (0.7-1.9) | 0.6 | 1.7 (0.3-8.9) | 0.5 | 0.9 (0.5-1.5) | 0.7 |
| 24.0-24.9 | 1.3 (0.8-2.0) | 0.3 | 1.3 (0.3-5.6) | 0.7 | 1.0 (0.6-1.7) | 1.0 |
| 25.0-25.9 | 1.8 (1.1-3.1) | 0.03 | 1.4 (0.3-6.2) | 0.6 | 1.5 (0.8-2.7) | 0.2 |
| 26.0-26.9 | 1.4 (0.9-2.2) | 0.2 | 1.7 (0.4-7.1) | 0.5 | 0.8 (0.5-1.4) | 0.5 |
| 27.0-27.9 | 1.5 (0.9-2.4) | 0.09 | 0.8 (0.2-2.9) | 0.7 | 1.3 (0.8-2.3) | 0.3 |
| 28.0-28.9 | 1.4 (0.9-2.3) | 0.1 | 1.1 (0.3-4.3) | 0.9 | 1.1 (0.7-1.9) | 0.7 |
| 29.0-29.9 | 1.5 (1.0-2.5) | 0.07 | 3.3 (0.6-16.6) | 0.2 | 1.0 (0.6-1.7) | 0.9 |
| 30.0-30.9 | 1.1 (0.7-1.8) | 0.6 | 1.7 (0.4-7.2) | 0.5 | 0.7 (0.5-1.2) | 0.2 |
| 31.0-31.9 | 1.6 (1.0-2.6) | 0.06 | 1.5 (0.4-6.6) | 0.6 | 1.3 (0.7-2.1) | 0.4 |
| 32.0-32.9 | 0.8 (0.5-1.2) | 0.3 | 0.7 (0.2-2.9) | 0.7 | 0.6 (0.4-1.0) | 0.05 |
| 33.0-33.9 | 1.4 (0.9-2.4) | 0.2 | 1.1 (0.3-4.6) | 0.9 | 1.2 (0.7-2.0) | 0.6 |
| 34.0-34.9 | 1.2 (0.7-1.9) | 0.5 | 0.9 (0.2-4.0) | 0.9 | 1.1 (0.6-1.8) | 0.8 |
| 35.0-35.9 | 1.3 (0.9-1.8) | 0.2 | 1.0 (0.2-5.1) | 0.9 | 1.1 (0.6-1.9) | 0.8 |
| 36.0-36.9 | 1.2 (0.7-2.1) | 0.6 | 1.0 (0.2-5.2) | 1.0 | 1.0 (0.6-2.0) | 0.9 |
| 37.0-37.9 | 1.6 (0.8-3.3) | 0.2 | 1.0 (0.2-6.3) | 0.3 | 1.5 (0.7-3.4) | 0.3 |
| 38.0-38.9 | 1.2 (0.6-2.4) | 0.5 | 2.1 (0.2-20.7) | 1.0 | 1.0 (0.5-2.0) | 0.6 |
| 39.0-39.9 | 1.1 (0.6-2.1) | 0.8 | - | 0.9 | 0.9 (0.5-1.8) | 0.9 |
Table 4: Risk of prediabetes associated with increasing BMI in Saudi adults based on regression analysis.
Khalid S Aljabri, et al. Frequency of Prediabetes According to Optimal Cut-Points for Body Mass Index in Saudi Population. Diabetes Obes Int J 2018, 3(3): 000183.
Discussion
In this hospital-based cohort of Saudi adults, we showed that Individuals with a BMI of ≤21 kg/m2 have been significantly associated with an increased frequency of prediabetes. Report of the Mex Diab study, among the 550 subjects with prediabetes, 16.7% were within normal weight; of these, 51 (9.3%) had impaired glucose tolerance [30]. Around 5–10% of people with prediabetes become diabetic annually although conversion rate varies by population characteristics and the definition of prediabetes [31].
The prevalence of obesity in the world is growing [32]. Obesity is a major concern as it is strongly related to multiple metabolic disorders [33]. General obesity measured by BMI is a known risk factor for prediabetes and diabetes [33]. The use of a reliable tool with optimal cut-off points for obesity diagnosis is very important to establish consequent public health policies, treatment protocols and to determine the correct optimal cut-off points of BMI for each population. As a known risk factor of diabetes, high BMI (> 30 kg/m2) is associated with 3-10 times greater risk of developing diabetes compared to low BMI (< 25 kg/m2) [34, 35, 36, 37, 38, 39, 40, 41]. The mean BMI of males in this study was significantly lower than that of females which is consistent with findings in other studies [34]. This ob- servation is similar to the findings among report in Saudi Arabia and could be explained by the fact that men are mostly taller than women, especially when the BMI Khalid S Aljabri, et al. Frequency of Prediabetes According to Optimal Cut-Points for Body Mass Index in Saudi Population. Diabetes Obes Int J 2018, 3(3): 000183.
calculation is mainly dependent on the net body weight and height, regardless of the distribution of muscle and bone mass [35]. We showed the optimal cutoff values for BMI were 28 kg/m2 for men and 29.5 kg/m2 for women for identifying the risk of prediabetes which was higher than previously reported [35]. Although BMI has advantages in clinical and epidemiological practice, as a non-invasive and low-cost method, its predictive value for chronic diseases has been questioned, especially when applied to certain population groups [15, 16, 17]. Although BMI is often advocated as a simple measure to determine disease risk, it has several limitations. First, lean mass and fat mass could not be differentiated for a given BMI across age, sex and race [42]. Second, fat distribution could not be distinguished by BMI, whilst it has been generally accepted that visceral adiposity plays more important role in developing insulin resistance and diabetes rather than overall adiposity [43, 44, 45, 46, 47].
The risk of prediabetes associated with each BMI level was estimated, adjusting for other covariates. To assess the impact of the other covariates, we estimated an unadjusted logistic regression model (with BMI level as the only covariate). The Odd Ratios (OR), which approximate the relative risks in the nested case-control analysis, are listed in Table 4. BMI cut-off of ≤21.0 kg/m2 was associated with the highest unadjusted and adjusted prevalence ratio. The unadjusted ORs were slightly higher than the adjusted ORs. This implies that some factors, such as age and gender, are associated with both increased BMI and increased risk of prediabetes, but the impact of these factors on the association between BMI and risk of prediabetes is limited. Moreover, BMI values were clinically measured in the current study, compared with BMI calculated from self reported height and weight in those earlier studies.
Pre-specified anthropometric cut-points serve to standardize comparisons of obesity within and between populations [32]. However, the currently used cut-points are derived from studies among subjects of European ancestry, and may not be applicable to other ethnic groups such as Asians, including Saudis [48]. A recent consultation by a World health organization expert group reviewed the scientific evidence for appropriate cut points for BMI in Asians and suggested that Asians have different associations between BMI, percentage of body fat, health risk of T2DM compared to European populations [48]. In this study, ROC curve analysis and associated sensitivity and specificity showed that, among Saudi men and women respectively, BMI values of 28.0 to 29.5 kg/m2, best characterize individuals’ optimal cut- points. Alternatively, the differences in cut-points may reflect real underlying differences in body fat percentages corresponding to a given BMI value between Saudis and Asians or Europe ethnic groups. Thus, the proposed cut- points need to be validated in other Arab populations of the Middle East.
The overall performance of the ROC curve can be quantified by estimating the AUC which ranged from 0.503 to 0.617, Table 3. An area of 1.0 is perfect and an area <0.5 is considered non-informative. Our results indicated that the ROC analysis was close to a non- informative test as shown in the Figure 1. ROC curve analysis showed that the corresponding sensitivities and specificities were poor (<0.53 and <0.54, respectively). This indicates that the percentage of people identified as having the risk factors and the percentage of people who were identified as not being at risk were less than 53% of total population. Both positive likelihood ratio and negative likelihood ratio were close to 1.0, indicating a minimal increase in the likelihood of the presence of the risk factor if the test is positive and a minimal decrease in the likelihood if the test is negative. The false positive and false negative rates were high and close to each other in both women and men. Several reasons may explain the weakness of BMI as a tool to classify obesity in the Saudi Arabian population. First, BMI does not reflect fatness uniformly in all populations and different ethnic groups [49]. This may suggest the importance of including a measure of abdominal obesity in classifying obesity in Saudi populations. Second, the short stature of Saudi women could be limiting the usefulness of BMI in this population [50].
The overall misclassification was high and exceeded 90% of the total population across all the selected BMI cut-off points. Most of the other previous studies that have been conducted in non-Caucasian populations did not assess the misclassification rate [51, 52, 53, 54, 55, 56, 57, 58]. However, one study conducted in Asian Indians indicated a high overall misclassification rate, particularly in women [49]. Those authors concluded that the BMI did not accurately predict overweight in that population. This is not the first study to suggest the presence of a significantly increased risk of prediabetes at BMI values less than 25. However, the use of such low cut-offs would lead to large misclassification of healthy people as being at risk, as indicted by the high values of sensitivities and false positive rates. This fact that could cause unnecessary and costly diagnostic testing. Overall the total misclassification rate was unacceptably high, even with the use of different BMI cut off points. These findings Khalid S Aljabri, et al. Frequency of Prediabetes According to Optimal Cut-Points for Body Mass Index in Saudi Population. Diabetes Obes Int J 2018, 3(3): 000183.
illustrate the significant limitations in using BMI alone for obesity diagnosis in the Saudi Arabian population.
Our results should be interpreted in light of the study’s limitations. First, and foremost, the use of a retrospective cohort design prevented us from understanding the causal effect of BMI on the risk of developing prediabetes. Selection bias due to the healthy volunteer effect may have affected this study. Another limitation of the present study was having considered only overall obesity (assessed by BMI) and not abdominal obesity (measured by waist circumference), which is known to bear a close relationship with the target diseases. Prospective studies should be done to identify the causes of the incidence of these diseases and explain the role of genetic, nutritional, and/or metabolic factors in the appearance of these diseases in Saudis. Our sample was drawn from a hospital based patients, therefore this study may not be comparable to other population studies and cannot strictly be generalized to the whole older Saudi population. Finally, generalization of these findings is limited, because the data are predominantly from those of Jeddah ancestry. Considering the goal population, a larger cohort would have probably provided a greater power of the statistical analyses.
Conclusion
The diagnostic usefulness of BMI alone in defining obesity as risk for prediabetes is limited among men and women Saudi adults.
Acknowledgment
We are grateful to the staffs from the diabetic centre at King Fahad Armed Forces Hospital for their valuable contributions in data collection. The authors have no conflict of interest to disclose
References
-
American Diabetes Association (2018) Classification and Diagnosis of Diabetes: Standards of Medical Care in Diabetes-2018. Diabetes Care 41(S1): S13-S27.
-
WHO/IDF (2006) Definition and diagnosis of diabetes mellitus and intermediate hyperglycaemia: report of a WHO/IDF consultation. World Health Organization, Geneva.
-
Shaw JE, Sicree RA, Zimmet PZ (2010) Global estimates of the prevalence of diabetes for 2010 and 2030. Diabetes Research and Clinical Practice 87(1): 4-14.
-
Ford ES, Zhao G, Li C (2010) Pre-diabetes and the risk for cardiovascular disease: a systematic review of the evidence. J Am Coll Cardiol 55(13): 1310-1317.
-
Cheng YJ, Gregg EW, Geiss LS, Imperatore G, Williams DE, et al. (2009) Association of A1C and fasting plasma glucose levels with diabetic retinopathy prevalence in the US population implications for diabetes diagnostic thresholds. Diabetes Care 32(11): 2027-2032.
-
Diabetes Prevention Program Research Group (2007) The prevalence of retinopathy in impaired glucose tolerance and recent-onset diabetes in the Diabetes Prevention Program. Diabetic Med 24(2): 137-144.
-
Ziegler D, Rathmann W, Dickhaus T, Meisinger C, Mielck A, et al. (2008) Prevalence of polyneuropathy in pre-diabetes and diabetes is associated with abdominal obesity and macroangiopathy: the MONICA/KORA Augsburg Surveys S2 and S3. Diabetes Care 31(3): 464-469.
-
Plantinga LC, Crews DC, Coresh J, Miller ER, Saran R, et al. (2010) Prevalence of chronic kidney disease in US adults with undiagnosed diabetes or prediabetes. Clin J Am Soc Nephrol 5(4): 673-682.
-
Hashimoto K, Ikewaki K, Yagi H, Nagasawa H, Imamoto S, et al. (2005) Glucose intolerance is common in Japanese patients with acute coronary syndrome who were not previously diagnosed with diabetes. Diabetes Care 28(5): 1182-1186.
-
Bartnik M, Rydén L, Ferrari R, Malmberg K, Pyö rälä K, et al. (2004) The prevalence of abnormal glucose regulation in patients with coronary artery disease across Europe: the Euro Heart Survey on diabetes and the heart. Eur Heart J 25(21): 1880-1890.
-
Okosieme OE, Suruliram P, Peter R, Geogre L, Usman M, et al. (2008) Can admission and fasting glucose reliably identify undiagnosed diabetes in patients with acute coronary syndrome? Diabetes Care 31(10): 1955-1959.
-
Morris DH, Khunti K, Achana F, Srinivasan B, Gray LJ, et al. (2013) Progression rates from HbA (1c) 6.0– 6.4% and other prediabetes definitions to type 2 Khalid S Aljabri, et al. Frequency of Prediabetes According to Optimal Cut-Points for Body Mass Index in Saudi Population. Diabetes Obes Int J 2018, 3(3): 000183. diabetes: a meta-analysis. Diabetologia 56(7): 1489- 1493.
-
Tabák AG, Herder C, Rathmann W, Brunner EJ, Kivimäki M (2012) Prediabetes: a high-risk state for diabetes development. Lancet 379(9833): 2279-2290.
-
Danaei G, Finucane MM, Lu Y, Singh GM, Cowan MJ, et al. (2011) National, regional, and global trends in fasting plasma glucose and diabetes prevalence since 1980: systematic analysis of health examination surveys and epidemiological studies with 370 country-years and 2.7 million participants. Lancet 378(9785): 31-40.
-
Bullard KM, Saydah SH, Imperatore G, Cowie CC, Gregg EW, et al. (2013) Secular changes in US prediabetes prevalence defined by hemoglobin A1c and fasting plasma glucose: National Health and Nutrition Examination Surveys, 1999-2010. Diabetes Care 36(8): 2286-2293.
-
Xu Y, Wang L, He J, Bi Y, Li M, et al. (2013) Prevalence and control of diabetes in Chinese adults. JAMA 310: 948-958.
-
WHO (2016) Diabetes profiles, Saudi Arabia.
-
Bahijri SM, Jambi HA, Al Raddadi RM, Ferns G, Tuomilehto J (2016) The prevalence of diabetes and prediabetes in the adult population of Jeddah, Saudi Arabia-a community based survey. PLoS One 11(4): e0152559.
-
Dunkley AJ, Bodicoat DH, Greaves CJ, Russell C, Yates T, et al. (2014) Diabetes prevention in the real world: effectiveness of pragmatic lifestyle interventions for the prevention of type 2 diabetes and of the impact of adherence to guideline recommendations: a systematic review and metaanalysis. Diabetes Care 37(4): 922-933.
-
Knowler WC, Barrett-Connor E, Fowler SE, Richard FH, John ML, et al. (2002) Reduction in the incidence of type 2 diabetes with lifestyle intervention or metformin. N Engl J Med 346(6): 393-403.
-
Selph S, Dana T, Blazina I, Bougatsos C, Patel H, et al. (2015) Screening for type 2 diabetes mellitus: a systematic review for the U.S. Preventive Services Task Force. Ann Intern Med 162(11): 765-766.
-
Pham NM, Eggleston K (2016) Prevalence and determinants of diabetes and prediabetes among vietnamesem adults. Diabetes Res Clin Pract 113: 116-124.
-
Li S, Guo S, He F, Zhang M, He J, et al. (2015) Prevalence of diabetes mellitus and impaired fasting glucose, associated with risk factors in rural kazakh adults in Xinjiang, China. Int J Environ Res Public Health 12(1): 554-565.
-
Tian H, Song G, Xie H, Zhang H, Tuomilehto J, et al. (2009) Prevalence of diabetes and impaired fasting glucose among 769,792 rural Chinese adults. Diabetes Res Clin Pract 84(3): 273-278.
-
Ni Y, Zhao L, Yu H, Ma X, Bao Y, et al. (2015) Circulating unsaturated fatty acids delineate the metabolic status of obese individuals. E Bio Medicine 2(1): 1513-1522.
-
Boden G (1997) Role of fatty acids in the pathogenesis of insulin resistance and NIDDM. Diabetes 46(1): 3-10.
-
US Preventive Services Task Force (2008) Screening: type 2 diabetes mellitus in adults.
-
Shan Kuan Z, Zi Mian W, Stanley H, Moonseong H, Faith M, et al. (2002) Waist circumference and obesity-associated risk factors among whites in the third National Health and Nutrition Examination Survey. Clinical action thresholds. Am J Clin Nutr 76(4): 743-749.
-
Weng X, Liu Y, Ma J, Wang W, Yang G, et al. (2006) Use of body mass index to identify obesity-related metabolic disorders in the Chinese population. Eur J Clin Nutr 60(8): 931-937.
-
Guerrero-Romero F, Rodríguez-Morán M, Pérez- Fuentes R, Sánchez-Guillén MC, González-Ortiz M, et al. (2008) Prediabetes and its Relationship with Obesity in Mexican Adults: The Mexican Diabetes Prevention (MexDiab) Study. Metab Syndr Relat Disord 6(1): 15-23.
-
Nathan DM, Davidson MB, DeFronzo RA, Heine RJ, Henry RR, et al. (2007) Impaired fasting glucose and impaired glucose tolerance: implications for care. Diabetes Care 30(3): 753-759. Khalid S Aljabri, et al. Frequency of Prediabetes According to Optimal Cut-Points for Body Mass Index in Saudi Population. Diabetes Obes Int J 2018, 3(3): 000183.
-
WHO (1999) Obesity: preventing and managing the global epidemic: report of a WHO consultation. Geneva, Switzerland.
-
Guh DP, Zhang W, Bansback N, Amarsi Z, Birmingham CL, et al. (2009) The incidence of co-morbidities related to obesity and overweight: a systematic review and meta-analysis. BMC Public Health 9: 88
-
Sabir AA (2008) Glucose tolerance among urban and rural Fulani. Dissertation submitted to the National Post Graduate Medical College of Nigeria. Lagos.
-
Al-Rubeaan K, Al-Manaa HA, Khoja TA, Ahmad NA, Al- Sharqawi AH, et al. (2015) Epidemiology of abnormal glucose metabolism in a country facing its epidemic: SAUDI-DM study. Journal of Diabetes 7(5): 622-632.
-
Chan JM, Rimm EB, Colditz GA, Stampfer MJ, Willett WC (1994) Obesity, fat distribution, and weight gain as risk factors for clinical diabetes in men. Diabetes Care 17(9): 961-969.
-
Colditz GA, Willett WC, Stampfer MJ, Manson JE, Hennekens CH, et al. (1990) Weight as a risk factor for clinical diabetes in women. Am J Epidemiol 132(3): 501-513.
-
de Mutsert R, Sun Q, Willett WC, Hu FB, van Dam RM (2014) Overweight in early adulthood, adult weight change, and risk of type 2 diabetes, cardiovascular diseases, and certain cancers in men: a cohort study. Am J Epidemiol 179(11): 1353-1365.
-
Nagaya T, Yoshida H, Takahashi H, Kawai M (2005) Increases in body mass index, even within non-obese levels, raise the risk for type 2 diabetes mellitus: a follow-up study in a Japanese population. Diabet Med 22(8): 1107-1111.
-
Perry IJ, Wannamethee SG, Walker MK, Thomson AG, Whincup PH (1995) Prospective study of risk factors for development of non-insulin dependent diabetes in middle aged British men. BMJ 310(6979): 560-564.
-
Wannamethee SG, Shaper AG, Walker M (2005) Overweight and obesity and weight change in middle aged men: impact on cardiovascular disease and diabetes. J Epidemiol Community Health 59(2): 134- 139.
-
Jackson AS, Stanforth PR, Gagnon J, Rankinen T, Leon AS, et al. (2002) The effect of sex, age and race on estimating percentage body fat from body mass index: The Heritage Family Study. Int J Obes Relat Metab Disord 26(6): 789-796.
-
Nevill AM, Stewart AD, Olds T, Holder R (2006) Relationship between adiposity and body size reveals limitations of BMI. Am J Phys Anthropol 129(1): 151- 156.
-
Heymsfield SB, Scherzer R, Pietrobelli A, Lewis CE, Grunfeld C (2009) Body mass index as a phenotypic expression of adiposity: quantitative contribution of muscularity in a population-based sample. Int J Obes(Lond) 33(12): 1363-1373.
-
Cornier MA, Després JP, Davis N, Grossniklaus DA, Klein S, et al. (2011) Assessing adiposity: a scientific statement from the American Heart Association. Circulation 124(18): 1996-2019.
-
Nyamdorj R, Qiao Q, Lam TH, Tuomilehto J, Ho SY, et al. (2008) BMI compared with central obesity indicators in relation to diabetes and hypertension in Asians. Obesity (Silver Spring) 16(7): 1622-1635.
-
Langenberg C, Sharp SJ, Schulze MB, Rolandsson O, Overvad K, et al. (2012) Long-term risk of incident type 2 diabetes and measures of overall and regional obesity: the EPIC-Inter Act case-cohort study. PLoS Med 9(6): e1001230.
-
WHO (1995) Physical status: the use and interpretation of anthropometry. World Health Organization, Geneva.
-
Dudeja V, Misra A, Pandey RM, Devina G, Kumar G, et al. (2001) BMI does not accurately predict overweight in Asian Indians in northern India. Br J Nutr 86(1): 105-112.
-
Almajwal AM, Al-Baghli NA, Batterham MJ, Williams PG, Al-Turki KA, et al. (2009) Performance of body mass index in predicting diabetes and hypertension in the Eastern Province of Saudi Arabia. Annals of Saudi Medicine 29(6): 437-445.
-
Al-Lawati JA, Jousilahti P (2007) Body mass index, waist circumference and waist-to-hip ratio cut-off points for categorisation of obesity among Omani Arabs. Public Health Nutr 11(1): 102-108.
-
Al-Lawati JA, Barakat NM, Al-Lawati AM, Mohammed AJ (2008) Optimal cut-points for body mass index, Khalid S Aljabri, et al. Frequency of Prediabetes According to Optimal Cut-Points for Body Mass Index in Saudi Population. Diabetes Obes Int J 2018, 3(3): 000183. waist circumference and waist-to-hip ratio using the Framingham coronary heart disease risk score in an Arab population of the Middle East. Diabetes Vasc Dis Res 5(4): 304-309.
-
Chen KW, Boyko EJ, Bergstrom RW, Leonetti DL, Newell-Morris L, et al. (1995) Earlier appearance of impaired insulin secretion than of visceral adiposity in the pathogenesis of NIDDM. 5-Year follow-up of initially non-diabetic Japanese- American men. Diabetes Care 18(6): 747-753.
-
Nguyen TT, Adair LS, He K, Popkin BM (2008) Optimal cutoff values for overweight: using body mass index to predict incidence of hypertension in 18- to 65-year-old Chinese adults. J Nutr 138(7): 1377-1382.
-
Chen YM, Ho SC, Lam SS, Chan SS (2006) Validity of body mass index and waist circumference in the classification of obesity as compared to percent body fat in Chinese middle-aged women. Int J Obes (Lond) 30(6): 918-925.
-
Pongchaiyakul C, Nguyen TV, Kosulwat V, Rojroongwasinkul N, Charoenkiatkul S, et al. (2006) Defining obesity by body mass index in the Thai population: an epidemiologic study. Asia Pac J Clin Nutr 15(3): 293-299.
-
Tazeen HJ, Nish C, Gregory P (2006) Prevalence of overweight and obesity and their association with hypertension and diabetes mellitus in an Indo-Asian population. Can Med Assoc J 175(9): 1071-1077.
-
Ko GT, Chan JC, Cockram CS, Woo J (1999) Prediction of hypertension, diabetes, dyslipidaemia or albuminuria using simple anthropometric indexes in Hong Kong Chinese. Int J Obes Relat Metab Disord 23(11): 1136-1142. Khalid S Aljabri, et al. Frequency of Prediabetes According to Optimal Cut-Points for Body Mass Index in Saudi Population. Diabetes Obes Int J 2018, 3(3): 000183.
- Investigation of Polymorphisms in PPAR-Ɣ and TRHR Genes and their Impact on Turkish Diabetic and Obese Individuals
- The Impact of Aircraft Noise Exposure on the Efficacy of Empagliflozin Therapy in an Animal Model of Obesity
- Rooibos Mitigates Metabolic and Inflammatory Dysfunctions in Mice Fed a High-Carbohydrate Diet
- Synergistic Effect of Combined Leaf Extract of Vernonia amygdalina, Ocimum gratissimum, and Zingiber officinale Tuber on Phytochemical Profile, Antioxidant Activity, Serum Insulin, and Biochemical Parameters in Streptozotocin-Induced Diabetic Rats
- Investigation of Cardiovascular Responses to Aerobic Exercise in Obese University Students
- A Look at the Phase Angle Obtained by Electrical Bioimpedance