Frequency of Metabolic Syndrome in Underweight Saudi Adults
Background and Objective: The global prevalence of underweight decreased from 14.6% to 9.7%. There is little information on the frequency of underweight with metabolic syndrome among Saudi adults. Therefore, the aim of this study was to determine the frequency of metabolic syndrome ( MetS) in underweight Saudi Adults. Methods: Out of 5498 participants, we analyzed 184 underweight participants who are equal to or older than 18 years old. All cases were from the population of the primary health at King Fahad Armed Forces Hospital. Results: Out of 5498 participants analyzed, 184 (2.7%) were underweight. MetsS was present in 13 (7.1%) of underweight cases. There were 50 (27.2%) male and 134 (72.8%) were female. Mean age was 29.7 ± 14.4 ( minimum 18 years and maximum 94 years ). Mean body mass index (kg/m2) (BMI) 16.7-1.3, type 2 diabetes (T2DM) and hypertension (HTN) were found in 18 (9.8%) and 9 (4.9%) respectively. Female patients were not significantly higher frequency of MetS compared to males, 10 (76.9)% vs. 3 (23.1%), respectively, p=0.7. Cases with MetS were significantly older, 55.6 ± 19.4 vs. 29.7 ± 14.4 respectively, p<0.0001. BMI was not significantly higher in MetS cases, 16.8-1.4 vs. 16.7-1.3 respectively, p=0.9. Patients with MetS were significantly have higher prevalences T2DM, HTN, low levels of high density lipoprotein (HDL) and high triglyceride. Patients with HbA1c>5.6 or T2DM [OR=4.3; 95% confidence interval (CI), p=0.06, 28.7, (p<0.0001)], elevated plasma TG levels [OR=6.7; 95% CI=3.0, 15.0, p<0.0001], or low levels of HDL [OR=3.1; 95% CI=1.3, 7.4, p<0.0001] were more likely to present. The frequency of MetS was significantly higher in age ≥30 years compared to younger ages, 84.6% vs. 7.7% for the other two age groups respectively, p<0.0001. The mean BMI was not significantly higher in age group 25-29 years, p=0.8. There were upward trend of MetS across each BMI unit with male predominant in BMI 17.0=18.4 kg/m2. Conclusion: It can be concluded from our study, the frequency of MetS in underweight Saudi adults is relatively low. Underweight with Mets might be associated with high risk for T2DM and HTN among older adults.
Patan M Khan1 Hesham M. bu Elsaoud1, Mohammad M Jalal1,
Rania F Safwat1, Rehab El Boraie1 and Bandari K Aljabri2
Kingdom of Saudi Arabia
khalidsaljabri@yahoo.com study was to determine the frequency of metabolic syndrome ( MetS) in underweight Saudi Adults.
old. All cases were from the population of the primary health at King Fahad Armed Forces Hospital.
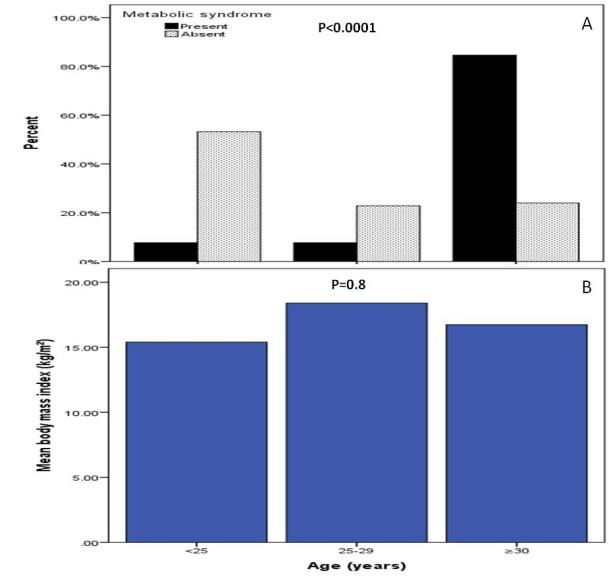
significantly higher in age group 25-29 years, p=0.8. There were upward trend of MetS across each BMI unit with male predominant in BMI 17.0=18.4 kg/m2.
Conclusion: It can be concluded from our study, the frequency of MetS in underweight Saudi adults is relatively low.
Underweight with Mets might be associated with high risk for T2DM and HTN among older adults.
Keywords: Metabolic Syndrome; Underweight; Saudi Arabia
Introduction
The global prevalence of underweight was reported to be 9.7% [1]. A study conducted in seven African countries has shown that the prevalence of being underweight ranged from 12.6% to 31.9%. 4 A study from the United States has shown that the prevalence of underweight children and adolescents in the period of 2007-2010 was 3.5% [2]. Moreover, a study was conducted in Peru in a randomly selected sample of 952 secondary school adolescents showed that the prevalence of underweight was 1.5% [3]. In Russia, the prevalence of underweight adolescents (14-17) was 3.6% [4]. A study from Japan showed the prevalence of underweight was 13.5% in 1976 through the 1980s; however, from 1996 to the 2000s, 23.7% were underweight [5]. In cross-sectional study, found that underweight may be an independent risk factor for cardiovascular disease (CVD) and CVD was more prominent in subjects under age 60 [6].
Metabolic syndrome (MetS) predisposes individuals to increased risk for developing type 2 diabetes (T2DM) and CVD [7]. The prevalence of MetS increased with increasing body mass index (BMI) for both sexes. While only about 6.8% of males and 9.3% of females were underweight and normal weight, they had three or more risk factors for MetS [8]. A study from China showed 4.6% were underweight and 16.4% of them were identified as metabolically abnormal. Metabolic features were comparable between underweight but metabolically abnormal participants and obese participants. Compared with participants with normal weight and normal metabolic features, the underweight but metabolically abnormal participants were more likely to have CVD and albuminuria, with an adjusted odds ratio of 2.33 (95% confidence interval (CI) 1.34-4.05) and 2.56 (95% CI 1.86- 3.52), respectively. Among underweight participants, factors associated with metabolic abnormal phenotype included leisure time physical inactivity, mild occupational physical activity, and waist circumference Khalid S Aljabri, et al. Frequency of Metabolic Syndrome in Underweight Saudi Adults. Diabetes Obes Int J 2018, 3(4): 000187.
[9]. Some epidemiological data suggest that being underweight as well as being overweight might be associated with the incidence of diabetes in the Japanese population [10, 11, 12].
However, little attention has been paid to nearly equally frequent problem of underweight in adults. Moreover, in many studies overweight individuals were compared to those with normal weight, while potential differences between normal weight and underweight subjects were not taken into consideration. Underweight in turn is associated with increased mortality of adults and elderly people when compared to normal weight or overweight individuals [13]. There is little information on the frequency of metabolic syndrome in underweight among adult Saudis. Therefore, the aim of this study was to determine the frequency of metabolic syndrome in underweight Saudi adults.
Methods
Out of 5498 participants, we analyzed 184 underweight participants who are equal to or older than 18 years old. All cases were from the population of the primary health at King Fahad Armed Forces Hospital. All data were collected by personal interview and on the basis of a review of electronic medical records. Physician and nurse interviewers measured and recorded weight (kg) and height (cm). Hypertension (HTN) was defined when the systolic blood pressure was ≥130 mm Hg and/or diastolic blood pressure was ≥85 mm Hg in addition to receiving any medication for hypertension [14]. BMI values classified as underweight if (body mass index) BMI < 18.5 kg/m2 [15]. Metabolic risk factors were defined using the 2006 IDF criteria that define elevated triglyceride as ≥150 mg/dL (≥1.7 mmol/L) and reduced high density lipoprotein cholesterol (HDL-cholesterol) as <50 mg/dL (<1.29 mmol/L) for female [16]. Abnormal glucose metabolism was considered when HbA1c (≥5.7). Participants were defined as having T2DM according to Copyright© Khalid S Aljabri, et al.
self-report, clinical reports, use of antidiabetic agents and HbA1c (≥6.5) [17]. A combination of two or more of these risk factors was used to define MetS [16]. The total number of cohort were separated on basis of age values into three groups: <25 years, 25-29 years and ≥30 years.
underweight cases. There were 50 (27.2%) male and 134 (72.8%) were female. Mean age was 29.7 ± 14.4 ( minimum 18 years and maximum 94 years ), (table 1). Mean BMI 16.7-1.3, T2DM and HTN were found in 18 (9.8%) and 9 (4.9%) respectively. Table 2 showed basic characteristics and comparison of different variables according the presence or absence of MetS for the population under study. Female patients showed not significantly higher frequency of MetS compared to males, 10 (76.9)% vs. 3 (23.1%), respectively, p=0.7. Cases with MetS were significantly older, 55.6 ± 19.4 vs. 29.7 ± 14.4 respectively, p<0.0001. BMI was not significantly higher in MetS cases, 16.8-1.4 vs. 16.7-1.3 respectively, p=0.9. Patients with MetS were significantly have higher prevalences of T2DM, HTN, low HDL and high triglyceride (table 2). Patients with HbA1c>5.6 or T2DM [OR=4.3; 95% confidence interval (CI), p=0.06, 28.7, (p<0.0001)], elevated plasma TG levels [OR=6.7; 95% CI=3.0, 15.0, p<0.0001], or low levels of HDL [OR=3.1; 95% CI=1.3, 7.4, p<0.0001] were more likely to present.
Statistical Analysis
Unpaired t-test analysis and Chi square (X2) test (categorical data comparison) were used between variables to estimate the significance of different between groups for demographic and clinical laboratory. All statistical analyses were performed using SPSS Version 23.0. The difference between groups was considered significant when P<0.05.
Results
Out of 5498 participants analyzed, 184 (2.7%) were underweight. MetsS was present in 13 (7.1%) of
| Parameters | Total | Metabolic syndrome | P value | ||
| Parameters | Total | Present | P value | Absent | |
| n (%) | 184 | 13(7.1) | 171(92.9) | ||
| Gender | Male | 50(27.2) | 3(23.1) | 47(27.5) | 0.7 |
| Gender | Female | 134(72.8) | 10(76.9) | 124(72.5) | 0.7 |
| Age (years) | 29.7±14.4 | 55.6±19.4 | 29.7±14.4 | <0.0001 | |
| Body mass index (kg/m2) | 16.7-1.3 | 16.8-1.4 | 16.7-1.3 | 0.9 | |
| Type 2 diabetes mellitus | 18(9.8) | 10(76.9) | 8(4.7) | <0.0001 | |
| Hypertension | 9(4.9) | 8(61.5) | 1(0.6) | <0.0001 | |
| HbA1c>5.6 or Type 2 diabetes mellitus | 19(67.9) | 9(90.0) | 10(55.6) | 0.06 | |
| Triglyceride (≥1.7 mmol/l) | 7(13.0) | 6(50.0) | 1(2.4) | <0.0001 | |
| High density lipoprotein (<1.29 mmol/l) | 10(31.3) | 7(58.3) | 3(15.0) | 0.01 |
Table 1: Basic characteristics of the underweight population under study in patients with and without the metabolic Table 1: Basi
| Parameters | Odd Ratio | P value |
| HbA1c>5.6 or Type 2 diabetes mellitus | 4.3 (0.6-28.7) | 0.06 |
| Triglyceride (≥1.7 mmol/l) | 6.7 (3.0-15.0) | <0.0001 |
| High density lipoprotein (<1.29 mmol/l) | 3.1 (1.3-7.4) | 0.01 |
Table 2: The odd ratio for underweight patients with metabolic syndrome in correlation to HbA1c>5.6 or Type 2 diabetes Table 2: T
Khalid S Aljabri, et al. Frequency of Metabolic Syndrome in Underweight Saudi Adults. Diabetes Obes Int J 2018, 3(4): 000187.
Copyright© Khalid S Aljabri, et al.
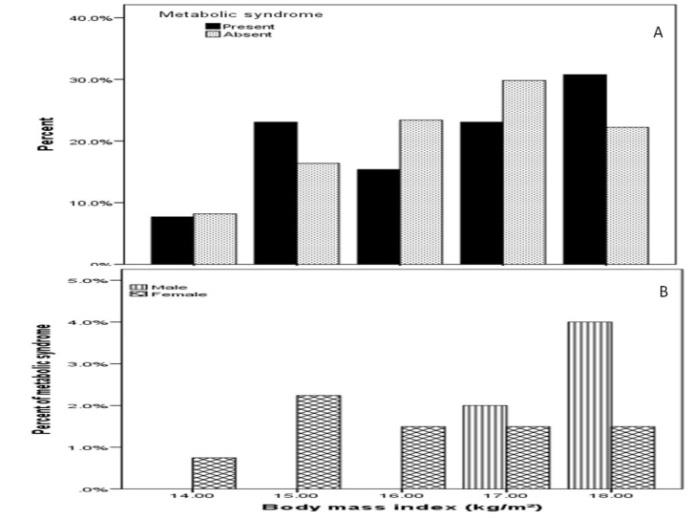
7.7% for the other two age groups, p<0.0001, figure 1 A. The mean BMI was not significantly higher in age group 25-29 years, p=0.8, figure 1 B. Figure 2 showed the frequency of metabolic syndrome of underweight cases across BMI groups and in relation to gender. There were upward trend of MetS across each BMI unit with male predominant for BMI 17.0=18.4 kg/m2, figure 1 A and B.
Khalid S Aljabri, et al. Frequency of Metabolic Syndrome in Underweight Saudi Adults. Diabetes Obes Int J 2018, 3(4): 000187.
Discussion
We found the frequency of underweight in our representative population using BMI criteria was 2.7%. Lower than other developing countries and slightly higher than developed countries. The underweight prevalence, worldwide, was projected to decline from 26.5% in 1990 to 17.6% in 2015. In developed countries, the prevalence was estimated to decrease from 1.6% to 0.9% while in developing regions, the prevalence was forecasted to decline from 30.2% to 19.3% [18]. Moreover, our study showed the mean age of underweight was 29.7 ± 14.4 years. Reasons for the high prevalence of underweight during early adulthood may be related to food insecurity and fear of being fat [19]. Some studies report an increase of an underweight body ideal and in eating disorders in Southeast Asia [20].
In the current study, the frequency of MetS was present in 7.1% out of 184 underweight cases. Underweight females with MetS in the study group was not significantly higher than males, 76.9% vs. 23.1% respectively, p=0.7. The results also showed that Mets was present in 7.7% of the study subjects aged <25 years and 25-29 years, while in age group ≥30 years was 84.6%, p<0.0001. In addition, the mean BMI was not significantly higher in age groups 25-29 years compared to subjects aged <25 years and ≥30 years. Moreover, There were upward trend of MetS across each BMI unit with male predominant for BMI 17.0=18.4 kg/m2. The largest Polish epidemiological study evaluating the health status of Poles is the WOBASZ study (Multi-center National Population Health Examination Survey), whose first edition was conducted in 2003–2005, and the second in 2013–2014. WOBASZ studies showed subjects with underweight with MetS occurred in women of childbearing age in about 4% [21, 22].
We showed that HbA1c>5.6 or T2DM was present no significantly in 90% of underweight with MetS, p=0.06. Mechanisms behind the association between underweight and T2DM among older adults are uncertain. Insulin secretion declines in older adults and lean diabetic older adults exhibit a profound impairment in glucose induced insulin release while obese diabetic older adults do not [23, 24]. Several experimental studies using rats showed that protein-calorie malnutrition and magnesium deficiency cause low insulin secretion and a low pancreatic insulin store [25]. In humans, a study of 556 older adult subjects reported that a poor nutritional status was associated with the prevalence of T2DM; mean Copyright© Khalid S Aljabri, et al.
serum albumin levels were lower among diabetic than nondiabetic subjects [26]. Furthermore, low dietary magnesium was associated with risk of T2DM [27].
We found HTN was present significantly in 61.5% of underweight with MetS, p<0.0001. To date, most of the studies that have linked body weight with blood pressure have been conducted on middle-aged subjects because age is positively related with blood pressure, and the occurrence of HTN has been observed to increase markedly from approximately 40 years of age [28, 29]. On the other hand, there are few such reports conducted on young adults [28]. Okasha, et al. [30] reported that BMI and body weight were positively associated with blood pressure in both males and females. Hirose, et al. [31] reported the presence of close positive correlations between changes in body weight and changes in blood pressure in 4976 university students during a 3-year follow-up period. Moreover, in a large nation-wide survey of health states on 323,517 university students in Japan, Kitamura et al. reported that BMI was positively correlated with systolic and diastolic blood pressure [32]. In an earlier study on 3686 university students, they also found that changes in body weight were positively correlated with changes in blood pressure [33]. The studies examining the association between HTN and body weight have been conducted on various age groups, especially middle-aged individuals, and have shown that BMI are positively associated with the risk for hypertension. However, most of these studies were cross- sectional. Among the few longitudinal studies, Huang et al. reported that weight gain dramatically increased the risk for HTN in study of 82,473 female registered nurses who were 30–55 years of age at study entry [34]. Field, et al. [35] described that for each 10 lb (4.5 kg) gain in weight, the risk of hypertension increased 30% in 46,224 females (the mean age of 39 years) who were participants in the Nurses’ Health Study II. However, these studies were conducted in middle-aged individuals, and there are few longitudinal studies in young adults. 9.5% females were found to be underweight in a study done by Atanasova V, et al. in foreign medical students [36]. On the other hand, Salve SB, et al. in their study found that 29.52% males and 31.73% females had less than normal BMI [37].
For prevention of underweight with MetS patients, it is important to investigate risk factors, especially lifestyles, because these can be modified. Lifestyle factors are associated with BMI; for instance, physical activity and eating behaviors were reported to be associated with BMI [38]. Therefore, it is necessary to consider both physical Khalid S Aljabri, et al. Frequency of Metabolic Syndrome in Underweight Saudi Adults. Diabetes Obes Int J 2018, 3(4): 000187.
activity and eating behaviors when examining lifestyle factors associated with underweight. Although the relationship between physical activity and underweight among adolescents has been investigated, eating behaviors such as eating speed, snacking, and breakfast were not considered in these studies. Under nutrition in adulthood can lead to increased morbidity and mortality and other adverse outcomes [39].
Strengths and Limitations
Our results should be interpreted in light of the study’s limitations. The first limitation is the small number of subjects which might not allowed us to explore trends within detailed clusters of sex, BMI and age. Most of the patients enrolled were already on treatment for HTN and T2DM which imposed some limitations on the study. We tried to overcome these by obtaining the necessary sample size and by using data documented before treatment. Another limitation of the present study was having considered only overall obesity (assessed by BMI) and not abdominal obesity (measured by waist circumference), which is known to bear a close relationship with the target diseases. Finally, as this was a hospital-based, retrospective study, the findings do not represent the whole Saudi population or the local community. Further larger population-based studies are necessary to support our findings.
Conclusion
It can be concluded from this study that the frequency of MetS IN underweight Saudi adults is relatively low. Mets with Underweight might be associated with risk for T2DM and HTN among older adults.
Acknowledgment
We are grateful to the staffs from the Primary care department at King Fahad Armed Forces Hospital for their valuable contributions in data collection. The authors have no conflict of interest to disclose
References
-
NCD Risk Factor Collaboration (NCD-RisC) (2016) Trends in adult body-mass index in 200 countries from 1975 to 2014: a pooled analysis of 1698 population-based measurement studies with 19_2 million participants. Lancet 387: 1377-1396. Copyright© Khalid S Aljabri, et al.
-
Fryar CD, Ogden CL (2010) Prevalence of Underweight among Children and Adolescents Aged 2-19 Years.
-
Nam EW, Sharma B, Kim HY, Paja D, Yoon M, et al. (2015) Obesity and Hypertension among School- going Adolescents in Peru. Journal of Lifestyle Medicine 5(2): 60-67.
-
Khasnutdinova SL, Grjibovski AM (2010) Prevalence of stunting, underweight, overweight and obesity in adolescents in Velsk district, north-west Russia: a cross-sectional study using both international and Russian growth references. Public Health 124(7): 392-397.
-
Takimoto H, Yoshiike N, Kaneda F, Yoshita K (2004) Thinness among young Japanese women. Am J Public Health 94(9): 1592-1595.
-
Park D, Lee JH, Han S (2017) Underweight: another risk factor for cardiovascular disease?: A cross- sectional 2013 Behavioral Risk Factor Surveillance System (BRFSS) study of 491,773 individuals in the USA. Medicine (Baltimore) 96(48): e8769.
-
Al-Sarraj T, Saadi H, Volek JS, Fernandez ML (2010) Metabolic syndrome prevalence, dietary intake, and cardiovascular risk profile among overweight and obese adults 18-50 years old from the United Arab Emirates. Metabolic Syndrome and Related Disorders 8(1): 39-46.
-
Ervin RB (2009) Prevalence of metabolic syndrome among adults 20 years of age and over, by sex, age, race and ethnicity, and body mass index: United States, 2003-2006. Natl Health Stat Report 13: 1-8.
-
Gao B, Zhang L, Zhao M (2016) Underweight but metabolically abnormal phenotype: Metabolic features and its association with cardiovascular disease. China National Survey of Chronic Kidney Disease Working Group Investigator Eur J Intern Med 29: 46-51.
-
Sairenchi T, Iso H, Irie F, Fukasawa N, Ota H, et al. (2008) Underweight as a predictor of diabetes in older adults: a large cohort study. Diabetes Care 31(3): 583-584.
-
Tsugane S, Sasaki S, Tsubono Y (2002) Under- and overweight impact on mortality among middle-aged Japanese men and women: a 10-y follow-up of JPHC Khalid S Aljabri, et al. Frequency of Metabolic Syndrome in Underweight Saudi Adults. Diabetes Obes Int J 2018, 3(4): 000187. study cohort I. Int J Obes Relat Metab Disord 26(4): 529-537.
-
Tatsumi Y, Ohno Y, Morimoto A, Nishigaki Y, Maejima F, et al. (2012) U-shaped relationship between body mass index and incidence of diabetes. Diabetol Int 3(2): 92-98.
-
Flegal KM, Graubard BI, Williamson DF, Gail MH (2005) Excess deaths associated with underweight, overweight, and obesity. JAMA 293(15): 1861-1867.
-
(2017) ACC/AHA/AAPA/ABC/ACPM/AGS/APhA/ASH/ASPC /NMA/PCNA Guideline for the Prevention, Detection, Evaluation, and Management of High Blood Pressure in Adults: A Report of the American College of Cardiology/American Heart Association Task Force on Clinical Practice Guidelines. J Am Coll Cardiol.
-
Chen YM, Ho SC, Lam SS, Chan SS (2006) Validity of body mass index and waist circumference in the classification of obesity as compared to percent body fat in Chinese middle-aged women. Int J Obes (Lond) 30(6): 918-925.
-
Alberti KG, Zimmet P, Shaw J (2006) Metabolic syndrome-a new world-wide definition. A Consensus Statement from the International Diabetes Federation. Diabet Med 23(5): 469-480.
-
American Diabetes Association (2018) Classification and Diagnosis of Diabetes: Standards of Medical Care in Diabetes-2018. Diabetes Care 41(S1): S13-S27.
-
Taru M, Hesham E, David T, Jason R (2014) The prevalence of underweight, overweight, obesity and associated risk factors among school-going adolescents in seven African countries. BMC Public Health 14: 887.
-
Patton GC, Selzer R, Coffey C, Carlin JB, Wolfe R (1999) Onset of adolescent eating disorders: population based cohort study over 3 years. BMJ 318(7186): 765-768.
-
Pike KM, Dunne PE (2015) The rise of eating disorders in Asia: a review. J Eat Disord 3: 33.
-
(2005) Health status of the Polish population aged 20-74 years in 2003-2005. The basic results of the cross-sectional study. The nationwide study of the Polish population. Institute of Cardiology, Warsaw. Copyright© Khalid S Aljabri, et al.
-
Niklas A, Flotyńska A, Puch-Walczak A, Polakowska M, Topór-Mądry R, et al. (2018) Prevalence, awareness, treatment and control of hypertension in the adult Polish population-Multi-center National Population Health Examination Surveys-WOBASZ studies. Archives of Medical Science. AMS 14(5): 951- 961.
-
Basu R, Breda E, Oberg AL, Powell CC, Dalla Man C, et al. (2003) Mechanisms of the age-associated deterioration in glucose tolerance: contribution of alterations in insulin secretion, action, and clearance. Diabetes 52(7): 1738-1748.
-
Meneilly GS, Elliott T, Tessier D, Hards L, Tildesley H (1996) NIDDM in the elderly. Diabetes Care 19(12): 1320-1325.
-
Okitolonda W, Brichard SM, Henquin JC (1987) Repercussions of chronic protein-calorie malnutrition on glucose homeostasis in the rat. Diabetologia 30(12): 946-951.
-
Castaneda C, Bermudez OI, Tucker KL (2000) Protein nutritional status and function are associated with type 2 diabetes in Hispanicelders. Am J Clin Nutr 72(1): 89-95.
-
Lopez-Ridaura R, Willett WC, Rimm EB, Liu S, Stampfer MJ, et al. (2004) Magnesium intake and risk of type 2 diabetes in men and women. Diabetes Care 27(1): 134-140.
-
National Institute of Health and Nutrition (1998) The State of National Nutrition in Japanese (The results of National Nutrition Survey, Japan in 1996). Dai-ichi Shuppan Publishing Co., Tokyo.
-
Chen Y, Rennie DC, Reeder BA (1995) Age-related association between body mass index and blood pressure: the Humboldt study. Int J Obes Relat Metab Disord 19(11): 825-831.
-
Okasha M, McCarron P, McEwen J, Davey Smith G (2000) Determinants of adolescent blood pressure: findings from the Glasgow university student cohort. J Hum Hypertens 14(2): 117-124. Khalid S Aljabri, et al. Frequency of Metabolic Syndrome in Underweight Saudi Adults. Diabetes Obes Int J 2018, 3(4): 000187.
-
Hirose H, Saito I, Tsujioka M, Kawabe H, Saruta T (2000) Effects of body weight control on change in blood pressure: three-year follow-up study in young Japanese individuals. Hypertens Res 23(5): 421-426.
-
Kitamura T, Kawamura T (20025) Associations with each examination value, in the Committee for Statistics of Student Health in the National University. White Paper: University Student Health 2000 (in Japanese). Nagoya University, Nagoya, pp: 74-79.
-
Uchiyama A, Yasui K, Usui W, Tang CY, Tanaka T (2003) The relationship of blood pressure change to body weight change in university students (in Japanese). Gakkou Hoken Kenkyu 45: 304-317.
-
Huang Z, Willet WC, Manson JE, Rosner B, Stampfer MJ, et al. (1998) Body weight, weight change, and risk for hypertension in women. Ann Intern Med 128(2): 81-88.
-
Field AE, Byers T, Hunter DJ, Laird NM, Manson JE, et al. (1999) Weight cycling, weight gain, and risk of hypertension in women. Am J Epidemiol 150(6): 573- 579.
-
Atanasova V, Gatseva P, Bivolarska A, Fronas G (2014) Body mass index and food frequency intake of foreign medical students. Trakia J Sci 12(1): 367-370.
-
Salve SB, Dase RK, Mahajan SM, Adchitre SA, Yadav VB (2010) Nutritional assessment of medical students. Int J Med Clin Res 1(2): 6-10.
-
Kumar BN, Holmboe-Ottesen G, Lien N, Wandel M (2004) Ethnic differences in body mass index and associated factors of adolescents from minorities in Oslo, Norway: a cross-sectional study. Public Health Nutr 7(8): 999-1008.
-
Elinder LS, Sundblom E, Rosendahl KI (2011) Low physical activity is a predictor of thinness and low self-rated health: gender differences in a Swedish cohort. J Adolesc Health 48(5): 481-486. Copyright© Khalid S Aljabri, et al.
- Investigation of Polymorphisms in PPAR-Ɣ and TRHR Genes and their Impact on Turkish Diabetic and Obese Individuals
- The Impact of Aircraft Noise Exposure on the Efficacy of Empagliflozin Therapy in an Animal Model of Obesity
- Rooibos Mitigates Metabolic and Inflammatory Dysfunctions in Mice Fed a High-Carbohydrate Diet
- Synergistic Effect of Combined Leaf Extract of Vernonia amygdalina, Ocimum gratissimum, and Zingiber officinale Tuber on Phytochemical Profile, Antioxidant Activity, Serum Insulin, and Biochemical Parameters in Streptozotocin-Induced Diabetic Rats
- Investigation of Cardiovascular Responses to Aerobic Exercise in Obese University Students
- A Look at the Phase Angle Obtained by Electrical Bioimpedance