Human Obesity: A Noxious Sequel of Inverse Intents of Ligands and Receptors
Diabetes and cardiovascular disease are the two most common deleterious side effects in the first line complications of chronic human obesity. Hyperleptinemia, hyperinsulinemia and hypercholesterolemia are the reported proximal outbreaks in progressive human obesity. Leptin, insulin and LDL remain interacted through their cognate receptors. A phase matched comparison has been conducted in present study between expressions of cognate receptors and plasma profile of their respective ligands in three human male groups viz. normal (18.5< BMI < 25), obese (25< BMI <40) and morbid obese (BMI > 40). Our study shows a declined leptin receptor concentration on peripheral blood mononuclear cells (PBMC) with a meagre change in its soluble counterpart (sOR/ OB-Re) in blood circulation, averring the outbreak of hyperleptinemia with obesity. Simultaneously, a cumulative decline of concentrations of LDL receptor (LDLR) and insulin receptor (IR) in PBMC are the reasons behind hypercholesterolemia and hyperinsulinemia cum insulin resistance in human obesity.
Introduction
Obesity is an emerging health pandemic in modern world. According to the Centers for Disease Control and Prevention, obesity is rapidly spreading across all regions and demographic groups. Besides genetic predisposition, high calorie intake and disease associated secondary outbreaks are also the reasons in precipitating human obesity. Obesity is an excess of total body fat, which normally results from high caloric intake that exceeds energy usage [1]. Body Mass Index (BMI) is a clinical guide to assess the risk of developing obesity. The American Obesity Association has reported 50-100% increased risk of death for obese individuals as compared to their normal counterparts. This substantial increase in health-risk has made obesity the second leading cause of preventable death. Type-2 diabetes mellitus and cardio- vascular atherosclerosis are the two most reported disorders among many other compounding risks in human obesity like arthritis, hypertension, anomalies in gallbladder, cancer (e.g. breast, uterine, colon), digestive disorders (e.g., gastroesophageal reflux disease, or GORD), breathing difficulties (e.g., sleep apnea, asthma), psychological problems such as depression, problems with fertility and pregnancy, and urinary incontinence. Studies in last decade have also included the evidence of leptin resistance oriented hyperleptinemia as an additional risk factor along with type-2 diabetes and cardiovascular complicities in human obesity [2, 3, 4, 5].
Leptin is a 16 kDa protein secreted by adipocytes [6]. Circulating plasma leptin levels correlate with the BMI in normal weight and obese humans [7]. Although leptin is a satiety factor that normally reduces appetite and promotes energy expenditure; obese individuals are found to be hyperleptinemic and are considered leptin resistant [8]. There are six isoforms of leptin receptor known as obese receptor (Ob-R). The long form of the receptor (Isoform-B or Ob-Rb) has a cytoplasmic tail and participates in intracellular signalling. The long form is highly expressed in hypothalamic neurons [9]. The other short forms are Ob-Ra, Ob-Rc, Ob-Rd and soluble form Ob- Re [10]. The short forms are present in different tissues and the soluble form is present in plasma and act as a carrier protein for leptin.
To understand the plausible interlink in obesity related complications and to aim the therapeutic intervention to the disease, the present study is intended to assess the expression of cognate receptors of three respective ligands viz. Insulin, LDL and leptin in normal, obese and morbid obese human subjects.
Materials
The primary antibodies [LDLR (N-17):SC-11822, Ob (H-146):SC-9014, Ob-R (M-18):SC-1834, INSULIN Rβ (C- 19): SC-711] and secondary antibodies( anti-goat, anti- rabbit and anti-mouse IgG-HRP conjugates) and Enhanced Chemi Luminescence reagent were purchased from Santacruz Biotechnology, Inc. CA, USA. Acrylamide, bis- acrylamide and colorburst protein molecular weight standards were purchased from Sigma, St. Louis , USA. Coomassie brilliant blue R-250 was purchased from Bio- Rad laboratories, Hercules, USA. Dab substrate kit for peroxidase enzyme and secondary antibodies with streptavidin peroxidase kit was brought from Vector, Laboratories, Inc,Burlingame, La, U.S.A. Optiprep solution was obtained from Axis-Shield PoC AS, Oslo Norway. Nitrocellulose membrane was a product of Genotech Incorporation, CA, USA. Kodak XK-5 X-Ray films were got from Kodak corporation, USA. The details of the kits used are as shown in parentheses: Cholesterol, LDL, HDL and triglyceride (Erba Diagnostics Mannheim Gmbh, Germany); glucose (Dia Sys Diagnostic Systems Gmbh, Holzheim, Germany); insulin (Mercodia Ab, Sylveniusgatan 8a, Se-754 50 Uppsala, Sweden); leptin (Diagnostics Biochem Canada Inc) and soluble leptin receptor (R&D Systems; USA and Canada).
Methods
Patient Selection Criteria
Male persons having 18-60 years of age were included in the study and classified into three groups according to their BMI (BMI = body weight in kg/ height in metre2). Control gr.: 25>BMI>18.5 and not suffering from any ailments. Obese gr.: 40 > BMI>25; Morbid obese gr.: BMI > 40. Besides obesity, these two later groups were also free from any ailments. The people with any acute illness or infection or medication were excluded from the study. The selection of subjects was cleared through the ethical guidelines of the AIIMS New Delhi, India, where the research work was conducted.
Peripheral Blood Mononuclear Cells Isolation
Solutions Required: A: Optiprep (Axis-Shield). B: Diluent: 1.0%(w/v) NaCl, 1mM EDTA,10 mM Hepes- NaOH, pH- 7.4, containing 0.5% (w/v) bovine serum albumin. C: 1.068 g/ml density solution prepared by mixing 1 vol of Optiprep and 4 vol of Solution B. D: 1.084 g/ml density solution prepared by mixing 1 vol of Optiprep and 3 vol of Solution B. Procedure: Whole blood was centrifuged at 400 x g at 20 oC for10 min. The buffy coat obtained was removed in a fresh falcon, over layered with 0.8 ml of B, 1.5 ml of D & 4 ml of C and centrifuged again at 800 x g for 25 min at 20oC without any brake. The two layers from the top were collected in a fresh falcon, mixed with an equal volume of RPMI and centrifuged at 2000 rpm for 10 min. The pellet was collected after repeating the process twice more and washed twice with ice cold 1X PBS by centrifuging at 2000 rpm for 10 min each. The lysate was prepared by treating the pellet with lysis buffer (containing 50 mM Tris–HCl (pH=7.4), 300 mM NaCl, 0.5% (v/v) Triton X- 100, 5 mM EDTA) in presence of proteinase inhibitors (2
mM PMSF, 10mg/mL leupeptin and 10U/mL aprotinin) and then lysed by strong vortexing. The volume of the lysis buffer used was approximately 5 – 10 times the volume of the pellet. This lysed suspension was kept on ice for 30 minutes and then centrifuged at 12000 rpm for 15 minutes at 40C. The supernatant was taken and stored at 40C.
Western Blotting
PBMC was isolated from blood and lysed as before. The lysate containing 30 – 100 µg protein was used for SDS-PAGE. For identification, the proteins were transferred onto nitrocellulose membranes. Transfer was performed at 35 V for 16 hours at 40C in a transfer buffer containing 48mM Tris Base, 39mM glycine, and 20% methanol, pre-chilled at 40C. The membranes were incubated with blocking buffer [1.5% BSA in 0.01 M PBS containing 0.05% Tween-20] for 2 hours to 4 hours at room temperature on a gel rocker and then washed thrice in 0.01 M PBS–0.1% Tween-20, for 10 min each. Anti LDLR mouse monoclonal antibody, anti-insulin receptor β chain rabbit polyclonal antibody, anti Leptin receptor goat polyclonal antibody and β-actin mouse monoclonal antibody diluted in 0.01 M PBS–0.1% - Tween-20 were added at 1: 3000, 1: 8000, 1: 750 and 1: 2000 dilutions respectively as per the appropriate blots and the membrane was incubated at room temperature for 2 hours. The membrane was then rinsed thrice with 0.01 M PBS–0.1% -Tween-20, for 10 min each. Anti-mouse HRP conjugate, anti-rabbit HRP conjugate and anti-goat HRP conjugate were added at 1: 8000(anti mouse) and 1:10000 (both anti-rabbit and anti-goat) dilutions and incubated for 2 hours at room temperature. This was followed by three washes in the same PBS–Tween buffer. The blots were then developed by Enhanced Chemi Luminescence in the dark and the bands were captured on a Kodak XK-5 X-Ray film. Immunohistochemistry: Surgically removed adipose tissue was obtained from the Department of SURGERY, AIIMS and MAX HOSPITAL, New Delhi, India. All samples were carried in ice during transportation. The tissues were rinsed thoroughly in normal saline to remove the adhered blood. For immunohistochemistry (IHC), small 1cm3 cubes were dissected out of the adipose tissue. They were then immediately stored frozen in liquid nitrogen and then used for block preparation using the cryogel at (- ) 250C. Once the blocks were ready, 5μm – 10μm thick sections were cut and lifted on glass slides. The slides were then air-dried and fixed with absolute acetone at 40C for 10 minutes. After fixation, they were again rinsed thrice with PBS, each for 5 minutes at room temp. Endogenous peroxidase activity was quenched by treating the cells with 4% H2O2 in methanol for 30 min at room temp. Following three PBS wash, non-specific blocking was performed with 1% BSA in PBS for 1 hour at room temp. Washing was carried out thrice with 0.01M PBS – 0.01% Triton X-100 (PBST), each wash for 5 minutes, at room temp. Anti-insulin receptor rabbit polyclonal antibody (1: 10 dilution in PBS) or anti leptin rabbit polyclonal antibody(1:50 dilution in PBS) were added on respective tissues followed by 2 hr incubation at room temp or overnight at 40C in a humid chamber. The incubation was followed by 3x PBST wash. The sections were then incubated with biotinylated secondary antibody for 1 hour at room temp. Following three times PBST wash, the sections were incubated half an hour with avidin–HRP followed by PBST wash and treatment with DAB buffer [0.06% DAB, 50 mM Tris–HCl, (pH=7.6), 1% H2O2] for 3–5 min at room temperature for visualization of antigen–antibody complex. Finally, the slides were counterstained with Mayer's hematoxylin for 1 min and after clearing the excess stain with water the slides were mounted with a DPX mountant after air-drying and dehydrating in xylene for 5 min. Photographs were taken after observation at a fixed magnification by a Nikon DXM 1200 digital camera attached to a Nikon Microphot FXA microscope. The quantitative evaluation of the protein- stain on the histogram was performed by determining the integrated optical density (IOD) of the protein-stain as reported previously [11]. Kit based estimation: Respective kits were used for the estimation of plasma glucose (glucose oxidase method) [12]_, total cholesterol (_modified Roeschlau’s method) [13, 14], triglycerides (Wako and the modification by mcgowan, et al. and Fossati, et al.) [15, 16] and HDL- cholesterol concentrations (Burstein et al.) [17]. Concentration of LDL-cholesterol was determined by Fredrickson-Freidwald formula [18]. Elisa based kits (see materials) were used for the estimation of insulin, leptin and soluble leptin receptor concentrations.
Results
A pilot study was conducted on total 60 male human subjects including normal, obese and morbid obese having 20 subjects in each group. The aim of this study was to verify the existence of any inter-relation between the observed plasma leptin profile and associated other plasma risk factors, normally gets predominant in human obesity, alongwith their respective cognate receptors.
Plasma Variants
Male subjects of normal (BMI: 21.72 ± 1.98), obese (BMI: 29.59 ± 3.4) and morbid (BMI: 45.8 ± 5.14) class in the age group of 18 to 60 years were included in this study. Our study had shown a trend of increasing plasma parameters like glucose, triacylglycerol and LDL- cholesterol concentration (Table 1A) on the progress of obesity from normal to morbid class. In addition, a 2-3 fold increase in plasma leptin concentration was also reflected in the obese groups as compared to the normal counterparts (Table 1A & 1B). Leptin, a 16 kD protein secreted by fat cells, was reported earlier as a major regulator of adiposity and energy balance [8, 9]. On the other hand the existing level of the leptin binder, the soluble leptin receptor (sOR / OB-Re), was found to remain practically unchanged with minor variation in the blood circulation of all the three groups of participants (Table 1A). A shift of plasma insulin concentration to its upper limit was also noticed in the obese group in parallel to their acquired leptin value (Table 1A). Comparison of plasma insulin and leptin concentrations among the study groups using Kruskal Wallis test [multiple comparison was done by using Wilkonson Ranksum’s test with Bonferroni correction] gave a signal of developing insulin resistance or the sign of type-2 diabetes with progress of obesity and hyperleptinemia (Table 1B). While increase of triacylglycerol from normal to obese groups was an earmark of developing obesity, the changing profile of LDL-cholesterol among the gruoups assigned the tint of atherogenesity with the wake of obesity (Table 1A). Plasma parameters in different study groups.
| Parameters (n=20) | Normal range | 1.Normal | 2.Obese | 3.Morbid | P Value (1 vs 3) | ||||||
|---|---|---|---|---|---|---|---|---|---|---|---|
| (Mean±SD) | (Mean±SD) | (Mean±SD) | |||||||||
| BMI: 21.72 ± 1.98 | BMI: 29.59 ± 3.4 | BMI: 45.8 ± 5.14 | |||||||||
| GLU | 70-110mg/dL | 96.52 ±34.72 | 112.45 ±39.82 | 119.74 ±57.14 | 0.428 | ||||||
| T.chol | 25-160mg/dL | 164.5± 53.91 | 172.32± 45.55 | 169.84± 39.02 | 0.9032 | ||||||
| TAG | 140-250mg/dL | 108.82±42.86 | 157.88± 66.8 | 187.89±89.8 | 0.017* | ||||||
| HDL | 30-65mg/dL | 37.70 ±12.8 | 32.4 ±13.5 | 29.02 ±12.60 | 0.2836 | ||||||
| LDL | <130 mg/dL. | 104.99± 47.10 | 108.29 ± 42.27 | 124.11 ±38.70 | 0.5199 | ||||||
| sOR | 12.6-49.6ng/mL | 38.95± 11.74 | 35.216 ±9.31 | 31.60 ±10.65 | 0.253 | ||||||
| Leptin | 2.0-5.6 ng/mL | 4.37± 3.55 | 15.23± 15.75 | 10.6 ±3.5 | 0.003* | ||||||
| Insulin | 2-25mU/L | 17.06± 17.3 | 21.04± 14.6 | 25.8± 12.6 | 0.384 |
p value calculated using ANOVA (1vs 3). *p < 0.05: significant. Table 1A: Triacylglycerol has been increased significantly in obese and morbid obese subjects. A trend on increase has been observed also for plasma glucose, total cholesterol, leptin and insulin concentrations with the progress of obesity. Conversely soluble leptin receptor concentration remained more or less constant or slightly decreased with the advancement of obesity. Comparison of plasma insulin and leptin concentrations among various study groups using Kruskal Wallis test.
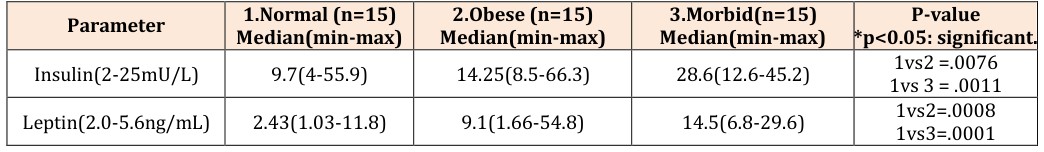
Table 1B: A trend on parallel increase of insulin and leptin concentration has been observed as the obesity advances towards morbid side. The parentheses show the range of data obtained in each case. Multiple comparisons done by using Wilkonson Ranksum’s test with Bonferroni correction.
Leptin in Adipocytes
The principal site of biosynthesis of leptin is white adipose tissue. Immunohistochemistry was performed for identification of leptin protein within white adipose tissue. Concentration of leptin was determined by measuring the IOD (integral optical density) of protein stain [11]. It was apparent that intracellular leptin concentration was gradually fallen down as compared to normal in obese to morbid obese sbujects (Figure 1A). On the other hand, in the extracellular environment of adipocytes the leptin concentration was elevated with the enhancement of obesity (Figure 1B). Therefore, it was clear from the histogram that with the advancement of obesity leptin came out of the fat vaccuoles and thus became responsible for its increase in blood stream. Hence, hyperleptinemia was found to be an associated incidence of obesity. A positive correlation was observed between plasma levels of triacylglycerol (sign of obesity) and leptin among different groups of study subjects (Figure 2).
Immunohistochemistry of Storage of leptin in adipose tissue among the groups.
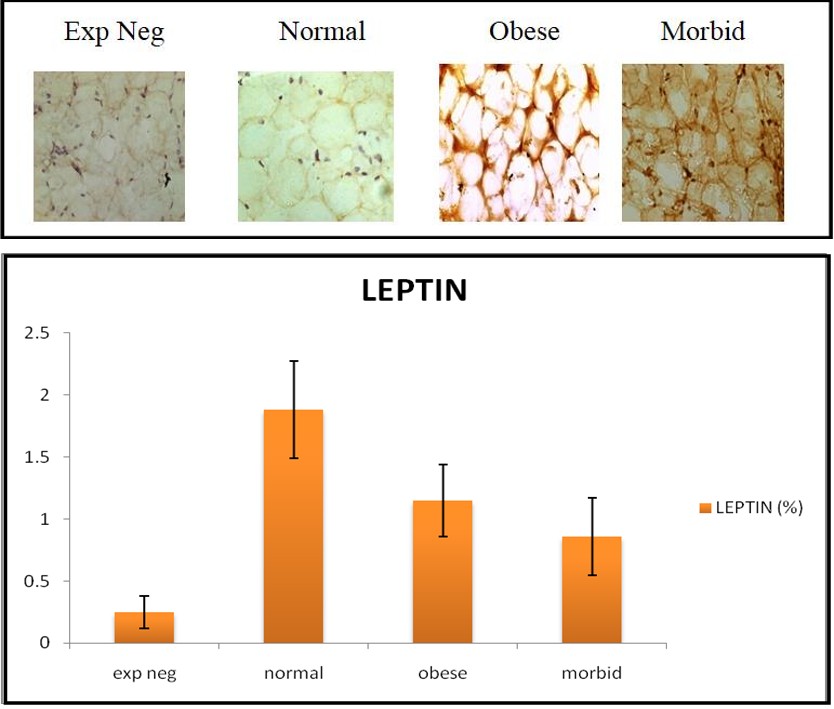
(A)
Extracellular leptin in adipose tissue mass with increasing obesity.
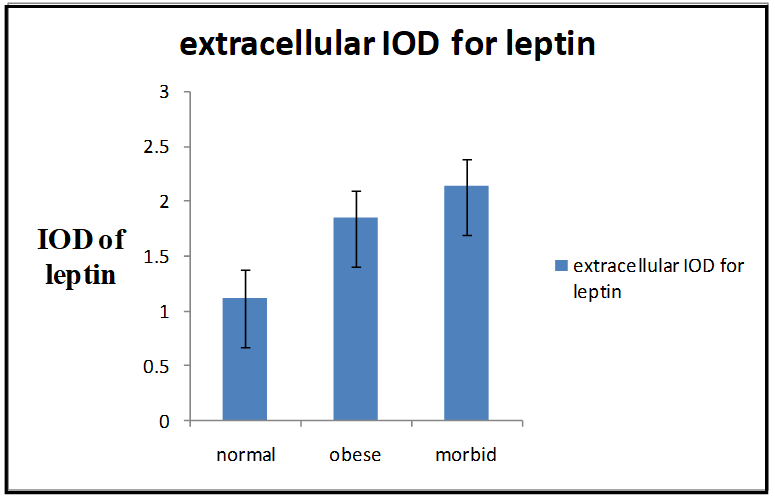
Figure 1: Immunohistochemistry was performed to see leptin level in adipose tissue. Intracellular leptin level was found declining with an increase at extracellular surface as the obesity advances to more severe stage viz. obese to morbid obese. Intracellular leptin: po,n = 0.005 pm,n = 0.001. Extracellular leptin: po,n = 0.008 pm,n = 0.003. n: Normal, o: Obese, m: Morbid obese. p < 0.05: significant.
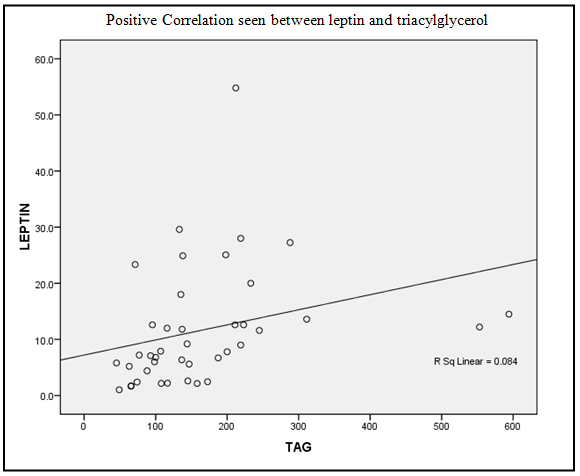
Correlation between leptin and triacylglycerol
| Leptin (Mean± SD) | Triacylglycerol (Mean± SD) | Correlation Coefficient(r) | p-value p < 0.05: significant |
|---|---|---|---|
| 11.6 ±10.60 | 165 ±114.32 | 0.54 | 0.0002 |
Receptor Protein Expressions on Peripheral Blood Mononuclear Cells
Densitometry was done to assess the expression of different receptor proteins on the surface of peripheral blood mononuclear cells (PBMC) isolated from the blood samples of the subjects under study. Expressioin of receptor proteins were compared on western blot after capturing their band by treatment with specific antibodies followed by HRP (horse raddish peroxidase) mediated femtoluminicent reaction. Expression of insulin receptor (IR) was found to be increased in obese subjects as compared to normal group and morbid group had the maximum expression among the three classes (Figure 3).
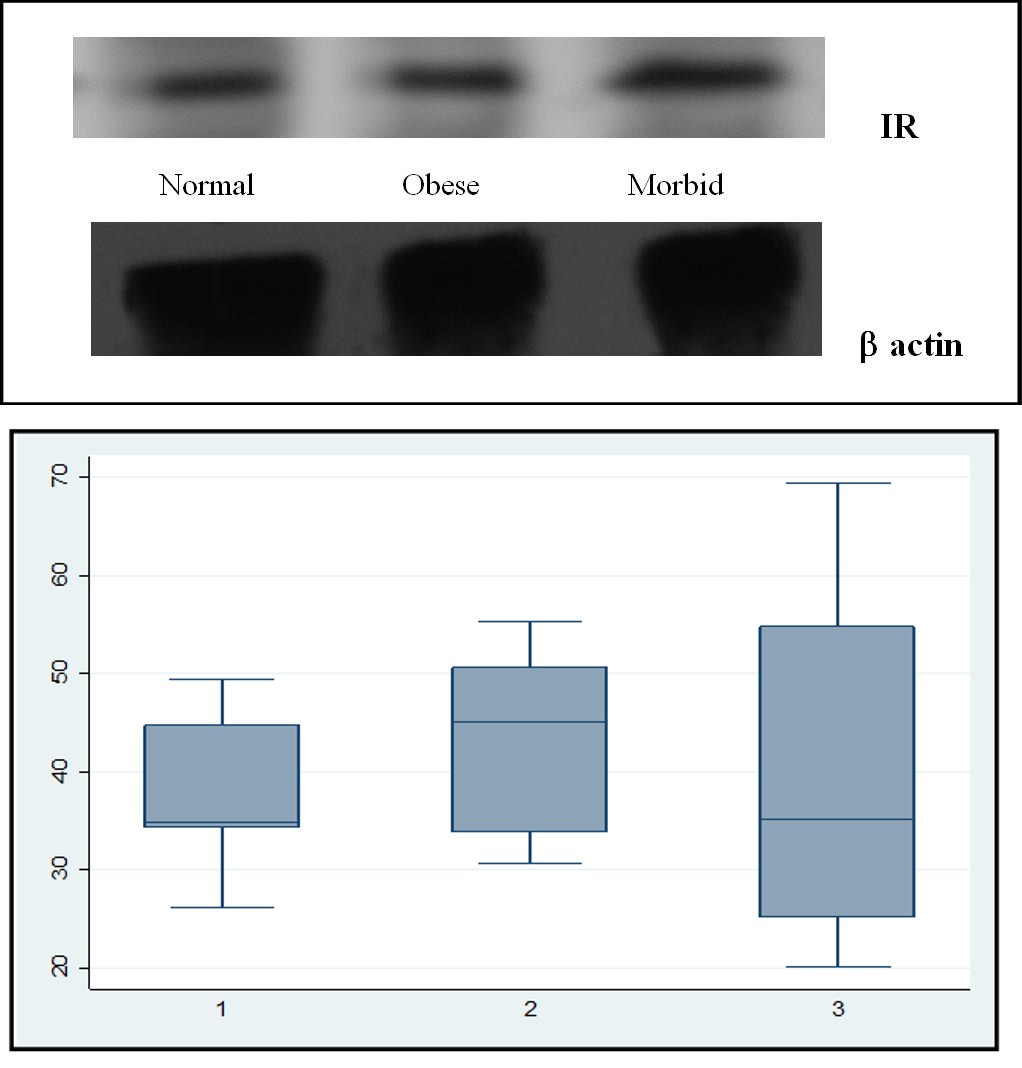
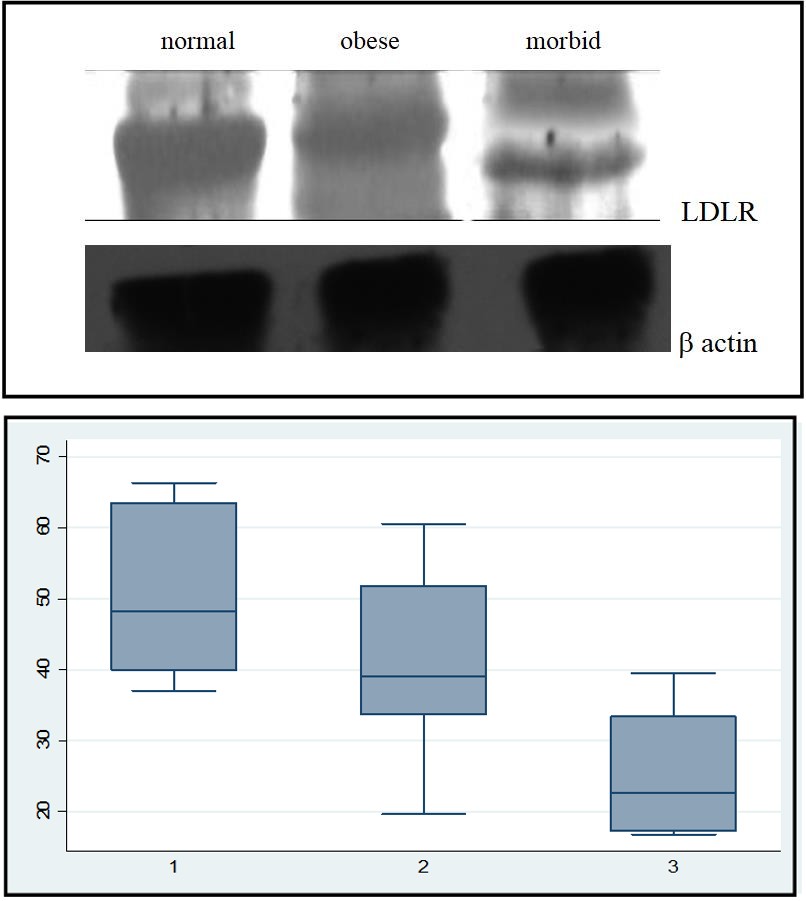
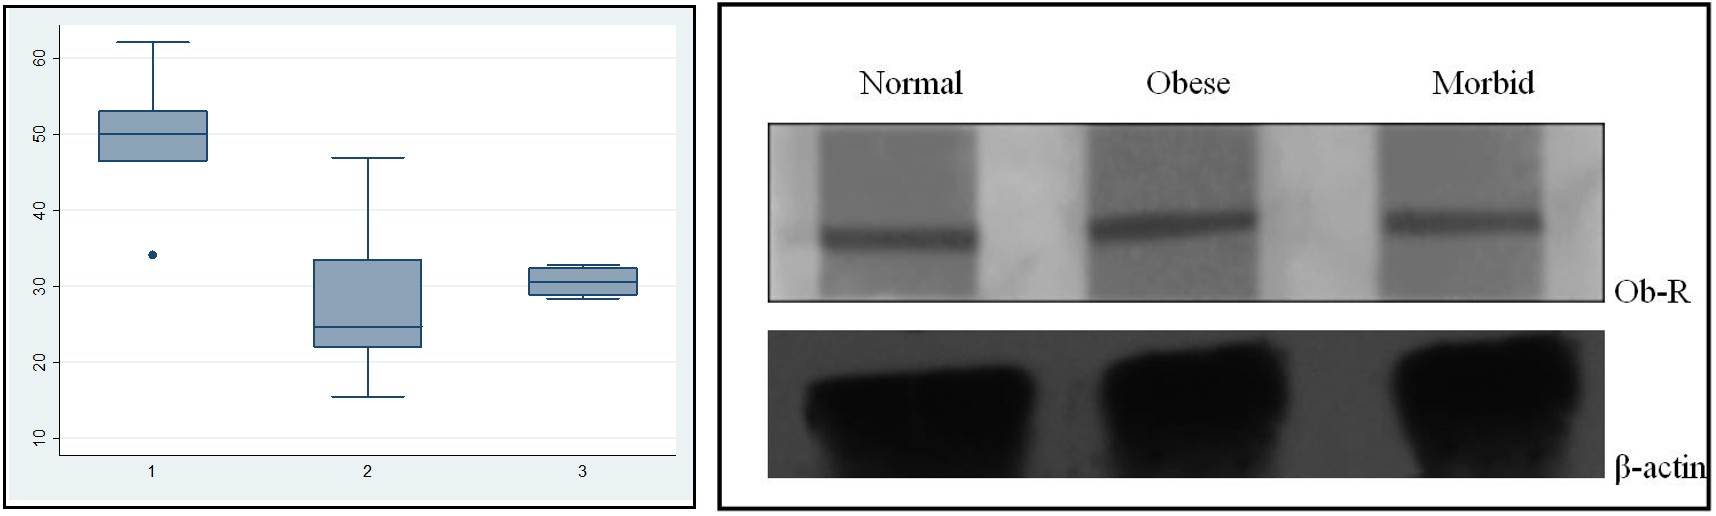
Since the variation in relative expression density (RED) among the subjects was relatively large, non- parametric analysis was done considering the median and extreme values of the series. Expression of beta-actin was used as internal standard in this evaluation process. Although insulin receptor (IR) protein was highly expressed in obese subjects, the earlier report [19] from our laboraory had shown a remarkable reduction of tyrosine phosphorylation of IR in obese group than normal subjects. Decreased tyrosine phosphorylation antagonizes IR from sensing its ligand and thus the ligand becomes incapable in sending intracellular signal to gene activation. On the other hand, the relative expression density of LDLR was found to be significantly decreased on the PBMCs of the obese and especially in morbid subjects as compared to normal group (Figure 4). Again the significance of data has been represented by non- parametric analysis as subject to subject variation was inappropriate for parametric analysis. These differences could be related to the gene regulated biological variations. The continuing decreased expression of LDLR with the advancement of obesity would be responsible for the poor clearance of vessel LDL. The non-parametric analysis of leptin receptor (Ob-R) expression on PBMC also showed a steep fall in obese groups (Figure 5) indicating less interaction of vessel leptin with its cognate receptors on the surface of PBMCs with the advancement of obesity. Also the soluble leptin receptor (sOR) concentration was found to be remained, on an average, to a constant limit in normal and obese groups; rather there was a slight deline in receptor (sOR) concentration with the progress of obesity. In contrast of having a mere fall of sOR in blood plasma between normal and obese group, the plasma leptin level increased 2-3 fold in obese groups as of its concentration in control subjects (Table- 1A). Therefore, development of human obesity alongwith of having a propensity of diabetes and atherosclerosis was found to be due to the capture of vessel-leptinemia, insulin receptor hypophosphorylation [19] and declined expression of leptin receptor on PBMC surface.
Discussion
Hyperleptinemia in human obesity is the consequences of a state of imbalance of body mass equilibrium by the newly found 16 kDa cytokine LEPTIN and considered to be as one of the diagnostic parameters of obesity in late last decade [20]. Animal studies on obesity had shown leptin as a master regulator of body’s energy balance [21] and serum leptin concentration was taken as a biological monitor of adipose mass [22-24 ].
The in vivo studies have confirmed the inate ability of leptin to reduce adipose fat mass through its potent interaction with a hypothalamic receptor protein known as Ob-Rb or leptin receptor [25]. Although it is apparent from model animal studies that the raised serum leptin level would reduce the energy intake by the body and thus facilitates hydrolysis of adipose fat to regain the normal body mass; the scenerio is different in human obesity [26, 27, 28]. Keeping untamed the high adipose mass, leptin resistance and hyperleptinemia are the common existing features in human obesity. Since hypothalamic leptin receptor was beyond the scope of approach in live human subjects, the present study was restricted only with the peripheral blood mononuclear cells (PBMC) isolated from collected blood samples. In addition to target the Ob-Ra (isoform of leptin receptor), the other proteins of interest of this study included the expression of insulin- and LDL-receptors on PBMC (Figure 3 and Figure 4) The main purpose of this study was to explore the reasons of occurrence of insulin resistence and atherorosclerosis in human obesity side by side with the outbreak of leptin resistance.
The estimation of plasma constituents in normal and obese subjects had shown an increase of four components viz. glucose, triacylglycerol, Leptin and LDL-cholesterol in obese subjects as compared to control group (Table 1). Increase of glucose relates to diabetes melitus, whereas triacylglycerol and LDL-cholesterol precipitate dyslipidimia and hyperlipoproteinimia. Dyslipidimia and hyperlipoproteinimia are the predecessors of the onset of atherosclerosis. The increase of leptin concentration in human obesity infers an incidence of imbalance in energy metabolism. Although an onshore consequence of diabetes melitus (commonly type-2 DM) and atherosclerosis with the occurrence of leptin resistance in human obesity has been documented in the latter half of the last decade [28, 29, 30], the pixel(s) of molecular impediment(s) for these associated outbreaks remained dizzy till the date.
It is only the complete Ob-Rb at the hypothalamic base, which is functionally compatible for sending signal from leptin to reduce energy intake by increasing the systemic satiety [10, 31]. No other isoforms of Ob-R on other tissues are equally competent for leptin generated signal transport . The only known Ob-R next to Ob-Rb that has been partially characterized for its functional activity is soluble leptin receptor [Ob-Re] [32, 33]. Ob-Re is basically a leptin transporter available in blood circulation as a carrier protein to ferry the leptin molecules to the periphery of blood brain barrier (BBB) so that it can cross BBB for its interaction with hypothalamic Ob-Rb [34, 35]. Leptin cannot be transported in free state through the blood vessel. We found no significant change in the plasma level of soluble leptin receptors in obese subjects as compared to control group. This tendered stagnate leptin crowd in the situation of leptin resistance or hyperleptinimia. Since adipose tissue is the sole place of origin for leptin; abundance of adipose mass with developing obesity acts as a supplier of excess leptin in blood vessels (Figure 1). A positive correlation was found between accumulation of triacylglycerol and leptin in blood vessels (Figure 2). Eventually the quantitative analysis of leptin concentration in adipose tissue in present study has shown a fall of the intracellular leptin level with the booming of obesity (Figure 1A). On the other hand, the extracellular leptin concentration was increased (Figure 1B). This impress the event of leptin secretion from the intracellular cavity of fat cells to extracellular medium and hence in blood circulation. The declined expression of PBMC bound leptin receptors [Ob-Ra] (Figure 5) in obesity may be the reason for declination of transpoter leptin receptor (truncated form) level, the soluble leptin receptor, in blood circulation. Thus vascular transportation of leptin gets detained and may remain responsible for stagnation of leptin in blood vessels. This situation refrains vascular leptin molecules to interact with its hypothalamic receptor.
Previous reports have shown the inductive effect of leptin on insulin secretion [36, 37, 38]. Joslin studies [5] and reports from other laboratories have also shown the incidence of insulin resistance along with hyperleptinimia in human obesity. Our study has also shown a higher median for the insulin lelvel of the obese group (Table 1B) compared against normal humans. Our earliar report had shown declined tyrosine-phosphorylation of insulin receptor in the PBMC of obese subjects [19]. This shows the reason of hyperinsulinemia and insulin resistance in obese subjects. Although future studies are needed to confirm whether high leptin concentration has any negative role on the phosphorylation of tyrosine residue in insulin receptor; our study has atleast shown that the reason of type-2 diabetes in human obesity might be the result of inactive insulin receptor to process the signal from insulin to intracellular cytosolic components. In addition, declined LDL receptor expression was observed in PBMC among the obese as compared to normo group (Figure 4). Recent studies from our laboratory has shown the insulin dependency of LDL receptor activity for LDL clearance from extracellular space [19, 39, 40]. Declined LDL receptor expression and inability of inactive insulin receptor for sending signal from insulin to activate LDL receptor promote deposition of LDL particles in blood vessels. The increased LDL concentration in blood vessels with the progress of obesity makes the subject prone to athero-thrombosis related disorder. Thus the risque troika in human obesity are insulinemia, leptinemia and hypercholesterolemia, which are originated from the impaired cognate receptors of respective ligands. These receptors are insulin receptor (IR), LDL receptor (LDLR), and leptin receptor (LR). A more detail study to understand the interrelation of the trio may help to evict the risk of human obisity in forcible future.
References
-
Astrup A, Raben A (1992) ‘Obesity: An inherited metabolic deficiency in the control of macronutrient balance?’ Eur J Clin Nutr 46(9): 611-620.
-
Eckel RH (1997) Obesity and heart disease: a statement for healthcare professionals from the Nutrition Committee. American Heart Association. Circulation 96(9): 3248-3250.
-
McGill HC Jr, McMahan CA, Herderick EE, Zieske AW, Malcom GT, et al. (2002) Obesity accelerates the progression of coronary atherosclerosis in young men_._ Circulation 105(23): 2712-2718.
-
Mundi MS, Karpyak MV, Koutsari C, Votruba SB, O’Brien PC, et al. (2010) Body fat distribution. Adipocyte size and metabolic characteristics of non- diabetic adults. J Clin Endocrinol Metab 95(1): 67-73.
-
Kahn CR, Weir GC, George L King GL, Moses AC, Smith RJ, et al. (2005) Joslin’s Diabetes Mellitus, 14th (Edn.), Lippincott Williams & Wilkins.
-
Margetic S, Gazzola C, Pegg GG, Hill RA (2002) Leptin: a review of its peripheral actions and interactions. Int J Obes Relat Metab Disord 26(11): 1407-1433.
-
Imagawa K, Numata Y, Katsuura G, Sakaguchi I, Morita A, et al. (1998) Structure-function studies of human leptin. J Biol Chem 273(52): 35245-35249.
-
Beltowski J (2006) Leptin and atherosclerosis. Atherosclerosis 189(1): 47-60.
-
Ahima RS, Prabakaran D, Mantzoros C, Qu D, Lowell B, et al. (1996) Role of leptin in the neuroendocrine response to fasting. Nature 382(6588): 250-252.
-
Tartaglia LA (1997) The leptin receptor. J Biol Chem 272(10): 6093-6096.
-
Nabi G, Seth A, Dinda AK, Gupta NP (2004) Computer based receptogram approach: an objective way of assessing immunohistochemistry of androgen receptor staining and its correlation with hormonal response in metastatic carcinoma of prostate. J Clin Pathol 57(2): 146-150.
-
Barham D, Trinder P (1972) An improved color reagent for the determination of blood glucose by the oxidase system. Analyst 97(151): 142-145.
-
Allain CC, Poon LS, Chan CS, Richmond W, Fu PC (1974) Enzymatic determination of total serum cholesterol. Clin Chem 20(4): 470-475.
-
Roeschlau P, Bernt E, Gruber W (1974) Enzymatic determination of total cholesterol in serum. Z Klin Chem Klin Biochem 12(5): 226.
-
McGowan MW, Artiss JD, Strandbergh DR, Zak B (1983) A peroxidase-coupled method for the colorimetric determination of serum triglycerides. Clin Chem 29(3): 538-542.
-
Fossati P, Prencipe L (1982) Serum triglycerides determined colorimetrically with an enzyme that produces hydrogen peroxide. Clin Chem 28(10): 2077-2080.
-
Burstein M, Scholnic HR, Morfin R (1970) Rapid method for the isolation of lipoproteins from human serum by precipitation with polyanion. J Lipid Res 11(6): 583-595.
-
Friedewald WT, Levy RI, Fredrickson DS (1972) Estimation of the concentration of low-density lipoprotein cholesterol in plasma without use of preparative ultracentrifuge. Clin Chem 18(6): 499- 502.
-
Ramakrishnan G, Beriwal P, Sangam, Chandra NC (2019) Low density lipoproteinemia in obese and type-2 diabetics from association of IR and LDLR. Diabetes Obes Int J 4(1): 16000194.
-
Cederholm T, Arner P, Palmblad J (1997) Low circulating leptin levels in protein-energy malnourished chronically ill elderly patients. Journal of Internal Medicine 242(5): 377-382.
-
Ishioka K, Soliman MM, Sagawa M, Nakadomo F, Shibata H, et al. (2002) Experimental and clinical studies on plasma leptin in obese dogs. J Vet Med Sci 64(4): 349-353.
-
Tritos NA, Mantzoros CS (1997) Leptin: its role in obesity and beyond. Diabetologia 40(12): 1371-1379.
-
Flier JS (1997) Leptin expression and action: New experimental paradigms. Proc Natl Acad Sci USA 94(9): 4242-4245.
-
Kolaczynski JW, Ohannesian JP, Considine RV, Marco CC, Caro JF (1996) Response of leptin to short-term and prolonged overfeeding in humans. J Clin Endocrine Metab 81(11): 4162-4165.
-
Jin X, Fukuda N, Su J, Takagi H, Lai Y, et al (2003) Effects of leptin on endothelial function with OB-Rb gene transfer in Zucker fatty rats. Atherosclerosis 169(2): 225-233.
-
John B Qven, Janet L Treasure and David A (2001) Animal models disorder of eating behavior and body composition, Collier Kluna Academic Publishers.
-
Hukshorn C, Dielen Fv, Buurman WA, Westerterp- Plantenga MS, Campfield LA, et al. (2002) The effect of pegylated recombinant human leptin (PEG-OB) on weight loss and inflammatory status in obese subjects. Int J Obesity 26(4): 504- 509.
-
Wang J, Obici S, Morgan K, Barzilai N, Feng Z, et al. (2001) Overfeeding rapidly induces leptin and insulin resistance. Diabetes 50(12): 2786- 2791.
-
Kang SM, Kwon HM, Hong BK, Kim D, Kim IJ, et al. (2000) Expression of leptin receptor (Ob-R) in human atherosclerotic lesions: potential role in intimal neovascularisation. Yonsei Med J 41(1): 68-75.
-
Ramos MA, Kuzuya M, Esaki T, Miura S, Satake S, et al. (1998) Induction of macrophage VEGF in response to oxidized LDL and VEGF accumulation in human atherosclerotic lesions. Arterioscler Thromb Vasc Biol 18(7): 1188-1196.
-
Chua SC Jr, Koutras IK, Han L, Liu SM, Kay J, et al. (1997) Fine structure of the murine leptin receptor gene: splice site suppression is required to form two alternatively spliced transcripts. Genomics 45(2): 264-270.
-
Ge H, Huang L, Pourbahrami T, Li C (2002) Generation of soluble leptin receptor by ectodomain shedding of membrane-spanning receptors in vitro and in vivo. J Biol Chem 277(48): 45898-45903.
-
Sinha MK, Opentanova I, Ohannesian JP, Kolaczynski JW, Heiman ML, et al. (1996) Evidence of free and bound leptin in human circulation. Studies in lean and obese subjects and during short-term fasting. J Clin Invest 98(6): 1277-1282.
-
Golden PL, Maccagnan TJ, Pardridge WM (1997) Human blood-brain barrier leptin receptor. Binding and endocytosis in isolated human brain microvessels. J Clin Invest 99(1): 14-18.
-
Lynn RB, Cao GY, Considine RV, Hyde TM, Caro JF (1996) Autoradiographic localization of leptin binding in the choroid plexus of ob/ob and db/db mice. Biochem Biophys Res Commun 219(3): 884- 889.
-
Caro JF (1991) Clinical review 26: Insulin resistance in obese and nonobese man. J Clin Endocrinol Metab 73(4): 691-695.
-
Muzumdar R, Ma X, Yang X, Atzmon G, Bernstein J, et al. (2003) Physiologic effect of leptin on insulin secretion is mediated mainly through central mechanisms. FASEB 17(9): 1130-1132.
-
German JP, Wisse BE, Thaler JP, Oh-I S, Sarruf DA, et al. (2010) Leptin Deficiency Causes Insulin Resistance Induced by Uncontrolled Diabetes. Diabetes 59(7): 1626-1634.
-
Ramakrishnan G, Arjuman A, Suneja S, Das C, Chandra NC (2012) The association between insulin and low- density lipoprotein receptors. Diab Vasc Dis Res 9(3): 196-204.
-
Suneja S, Ramakrishnan G, Tandon N, Chandra NC (2011) Modulation by insulin of the co-localized LDL receptor in normal and Type-I Diabetic subjects. Int J Clinical Medicine 2(3): 231-245.
- Investigation of Polymorphisms in PPAR-Ɣ and TRHR Genes and their Impact on Turkish Diabetic and Obese Individuals
- The Impact of Aircraft Noise Exposure on the Efficacy of Empagliflozin Therapy in an Animal Model of Obesity
- Rooibos Mitigates Metabolic and Inflammatory Dysfunctions in Mice Fed a High-Carbohydrate Diet
- Synergistic Effect of Combined Leaf Extract of Vernonia amygdalina, Ocimum gratissimum, and Zingiber officinale Tuber on Phytochemical Profile, Antioxidant Activity, Serum Insulin, and Biochemical Parameters in Streptozotocin-Induced Diabetic Rats
- Investigation of Cardiovascular Responses to Aerobic Exercise in Obese University Students
- A Look at the Phase Angle Obtained by Electrical Bioimpedance