Modifications in Body Composition of Overweight or Obese Type 1 Diabetics after the Intervention of a Program Bringing Changes in Their Lifestyle
Measurements such as weight and body mass index (BMI) have been considered practical and sensitive for predicting risks and health outcomes, however, they are not related to muscle mass. Therapeutic weight loss inevitably leads to the loss of variable amounts of skeletal muscle mass. We evaluated changes in body composition and estimated glucose disposal rate (eGDR) after 48 weeks of a program of lifestyle changes in overweight/obese patients with type 1 diabetes. The patients were invited to participate in a lifestyle change program (diet, daily steps, and resistance exercises without supervision at home). Body composition was evaluated by DXA, body weight, BMI, waist circumference (WC), and insulin sensitivity measured by eGDR at the beginning and at the end of the intervention. Continuous variables were expressed as mean ± standard deviation. For comparisons, Student's t-test was used. To determine correlations, the Pearson correlation coefficient was used. P<0.05 were considered significant. We included 13 T1D patients, aged 43.6 ±13.7 years, with a disease duration of 21.7 ± 11.6 years. The lifestyle intervention significantly reduced body weight 86.6±10.9 kg vs. 81.9±11.2 kg (p=0.018), BMI 29.2±3.04 kg/m2 vs. 27.5±2.36 kg/m2 (p=0.017), CC 95.4±8.8 cm vs. 88.8±8.4 cm (p=0.0001), fat mass index 10.1±2.85 kg/m2 vs. 8.9±2.24 kg/m2 (p=0.031), with increased the eGDR 7.61±1.5 mg/kg/min vs. 8.20±1.6mg/kg/min (p=0.026). But also, there was a reduction in the appendicular musculoskeletal index 8.3±0.8 kg/m2 vs. 8.06±0.8 kg/m2 (p=0.016). In conclusion, our lifestyle change program for people with T1D and overweight/obesity achieved a positive impact on body weight, BMI, waist circumference, fat mass, and eGDR, but not a positive impact on skeletal muscle, maybe for low adherence to resistance exercise. The knowledge of body composition is necessary to plan personalized nutritional and physical exercise interventions for the preservation of muscle tissue and avoid sarcopenia in this population.
Introduction
In the last 20 years, the prevalence of obesity has tripled throughout the world, which is why it is already considered a true epidemic [1]. Although the traditional idea has been that patients with type 1 Diabetes Mellitus (T1D) are thin, the prevalence of overweight and obesity has increased in parallel with the general population. Some authors even refer to a faster rate of increase than general population [2]. In a study of 415 adult patients with T1D, we found that 44% were overweight/obese [3]. Although insulin resistance does not participate in the pathophysiology of DM1, a growing number of people with T1D associated with metabolic syndrome criteria have been described, which has been called “Double Diabetes”. The term “Double Diabetes” was first used in 1991 to describe a combination of T1D with clinical features of T2D and exacerbation of insulin resistance [4].
Body mass measures such as weight and body mass index (BMI) have long been considered practical and sensitive for predicting health risks and outcomes. Although valuable, these measures do not represent an individual’s variability in body composition (i.e, lean tissue and adipose tissue). Abnormalities in body composition, such as low muscle mass, are powerful predictors of morbidity and mortality [5].
Body composition in patients with T1D can change at the beginning and during the disease. Although standards of medical care in diabetes do not recommend assessing body composition, analysis of fat mass and fat-free mass can provide useful information [6].
Skeletal muscle mass (SMM) is a key component of body composition, accounting for 30-40% of total body weight. It correlates with physical functions and health status. Approximately 75% of the SMM is in the appendicular region (legs and arms) called the appendicular skeletal muscle mass (ASMM), and the reduction of this leads to negative health consequences, such as weakness, disability, deterioration of the quality of life and mortality resulting in a greater burden of medical care [7].
Sarcopenia is a progressive and generalized disorder of the skeletal muscle that is associated with a higher probability of adverse outcomes (falls, fractures, physical disability and mortality), being recognized as a disease by the WHO since 2016 [8]. Studies carried out in patients with T1D show that they have a high prevalence of sarcopenia, and that hyperglycemia is related to low muscle function [9]. Importantly, therapeutic weight loss directed at excess fat, inevitably leads to loss of variable amounts of SMM, which may be enhanced in people with catabolic predisposing conditions (chronic disease, aging) or in the presence of inappropriate dietary restrictions (specifically low protein intake) or cyclic weight changes [10].
Sarcopenic obesity (SO) is a clinical and functional condition in which obesity coexists, characterized by excess of fat mass and sarcopenia [11]. Recently, the European Society for Clinical Nutrition and Metabolism (ESPEN) and the European Association for the Study of Obesity (EASO) established criteria for its diagnosis [10]. Obesity can independently lead to loss of muscle mass and function, due to the negative impact of adipose tissue-dependent metabolic disorders, such as oxidative stress, inflammation, and insulin resistance, which negatively affect muscle mass [12].
Sedentary lifestyle can also play a relevant role, being a primary cause as well because of both sarcopenia and obesity, which can be exacerbated by comorbidities [10].
Therefore, our objective was to evaluate changes in body composition after 48 weeks of a lifestyle change program in overweight/obese patients with T1D. The secondary objectives were:
- To evaluate the skeletal muscle index, fat mass index, visceral adipose tissue (VAT) and muscle quality index at the beginning and at 48 weeks.
- Know the association between body composition and the estimated rate of glucose disposal (eGDR).
- Evaluate the presence of sarcopenia/sarcopenic obesity.
- Assess the association between steps, strength- endurance exercises, and nutrition with body composition.
Material and Methods
A prospective intervention study was carried out from December 2020 to April 2022.
Inclusion Criteria
- Diagnosis of T1D over 5 years of evolution.
- Age over 18 years and under 65 years.
- BMI ≥27 kg/m2.
- Written informed consent signed prior to any procedure.
Exclusion Criteria
- Blood pressure >160/100 mmHg.
- Severe untreated proliferative or non-proliferative retinopathy.
- Wagner stage diabetic foot > 2.
- Orthostatic hypotension >20mmHg systolic blood pressure.
- Infectious or acute inflammatory process at the time of evaluation.
- Factors that may limit adherence to study interventions, disability or inability to give informed consent.
- Any severe orthopedic problem that precludes scheduled physical activity.
- Comorbidities with reduced life expectancy.
- Currently pregnant, breastfeeding or cancer in the last 5 years (except basal cell and squamous cell skin cancer).
- Cardiovascular event in the last 12 months.
- Documented history of pulmonary embolism.
- Angina pectoris, complex ventricular arrhythmia at rest or with exercise, atrial fibrillation, heart failure, aortic stenosis, left bundle branch block or pacemaker, history of aortic aneurysm.
- Kidney disease: MDRD-estimated glomerular filtration rate <30 mL/min.
- Chronic obstructive pulmonary disease that limits the ability to follow the protocol.
Anthropometric Parameters
Weight, height, and waist circumference (WC) were measured at baseline and at 48 weeks. Body weight was measured on a scale (150 kg capacity and 50 g precision, C.A.M. brand, model P-1004, Buenos Aires, Argentina) and height on the stadiometer scale, with a scale of 1 to 200 cm. and a precision of 0.5 cm. WC was measured at the level of the midaxillary line, at the midpoint between the costal margin and the iliac crest. The patient was in a standing position and at the end of a normal expiration. An inextensible metallic tape measure of 0.5 to 1 cm wide by 2 meters long was produced, with a scale of 10 mm (1 mm error). BMI was calculated by dividing weight in kg by height in meters squared.
Hand-Grip Strength
It was measured with a Camry brand digital dynamometer (model EH101 maximum capacity 90 kg), at the beginning and at 48 weeks. The subjects were seated, with the arm down and the wrist in a neutral position. They were asked to squeeze the dynamometer as hard as possible. The test was repeated three times for the dominant hand with 60 seconds of rest between each measurement. The highest value was used. The cut-off points to define low muscle strength are <27 kg for men and <16 kg for women [10].
Body Composition
It was measured at baseline and at 48 weeks by whole- body dual-energy X-ray absorptiometry (DXA) (Lunar Prodigy Primo model, General Electric). Measurements were made with participants positioned on the scanner table with soft tissues completely within the field of view of the densitometer.
The sum of lean soft tissue from both arms and legs was used as a measure of appendicular skeletal muscle mass (ASMM, kg) and the appendicular skeletal muscle index (ASMI= ASMM kg/height m2) was calculated. The cut-off point to define low muscle mass is <7 kg/m2 in men and <5.5 kg/m2 in women [8].
Appendicular lean soft tissue is the portion of body mass that is largely fat-free skeletal muscle and is highly correlated with total body muscle mass as measured by MRI [13].
The fat mass index was estimated from the fat mass in kilograms divided by height squared [14]. The muscle quality index, defined as muscle strength per unit of muscle mass, was calculated using the grip strength of the dominant hand obtained by dynamometry divided by the appendicular muscle mass. The cut-off point to define a low value is 1.7 kg/ kg and extremely low 1.5 kg/kg in men and 1.6 kg/kg and 1.3 kg/kg respectively in women [15].
Sarcopenic Obesity
The evaluation of people with suspected SO was structured in two levels: screening and diagnosis. Detection is based on the concomitant presence of a high BMI (>30 kg/m2) or WC >88 cm in women and >102 cm in men and indirect indicators of sarcopenia. The diagnosis is made in two steps evaluating sequentially:
- Skeletal muscle functional parameters: grip strength (dynamometry), if low values <27 kg in men and <16 kg in women are detected, the diagnostic algorithm will continue with the evaluation of body composition.
- Body composition: assessment by DXA or bioelectrical impedance as a second alternative. An increase in fat mass and a decrease in muscle mass should be observed [10].
Estimated Glucose Disposal Rate (eGDR)
It was estimated at the beginning and at 48 weeks, being a method that allows for evaluating insulin resistance [16]. Insulin sensitivity was calculated through the Estimated Glucose Disposition Rate according to the William and Orchard formula: eGDR (mg/kg/min) = 21.158 + (-0.09xWC) + (-3.407xHBP) + (-0.551xHbA1c) (WC is Waist Circumference in cm; HBP Yes 1, No 0).
Physical Activity
The prescription, monitoring and evaluation of physical activity were performed by a Physical Education graduate. The intervention plan consisted of the indication of 10,000 daily steps and 12 strength-resistance exercises to be performed 3 times a week without supervision at home.
Dietary Intervention
A Nutritionist conducted the training using a healthy plate, 22 cm in diameter, consisting of half of the plate of vegetables, quarter of the plate of protein, and quarter of the plate of complex carbohydrates. It was evaluated by means of 0, 1 and 2, being 0 the absence of the healthy dish, 1 the presence at lunch or dinner and 2 at lunch and dinner. In addition, the indication was made to consume 1 fruit before breakfast, lunch, and dinner, thus guaranteeing the consumption of 5 portions of fruits and vegetables daily.
The study was approved by the Ethics and Research Committee of the Hospital Universitario, Universidad Nacional de Cuyo.
Statistical Analysis
Continuous variables were expressed as mean ± standard deviation or median, depending on its distribution. For comparisons, Student’s t-test was used. Categorical variables were summarized in terms of frequencies and percentages. To determine correlations, the Pearson correlation coefficient was used. In all cases, p<0.05 was considered significant. The data was analyzed in the statistical program SPSS 15.0 to Windows©.
Results
13 patients with T1D were included, 61.5% male, age 43.6±13.7 years old, with a disease duration of 21.7±11.6 years. Table 1 shows the anthropometric parameters, body composition, grip strength, HbA1c and eGDR.
| Parameter | Baseline | 48 weeks | p |
|---|---|---|---|
| Body weight (kg) | 86.6 ± 10.9 | 81.9 ± 11.2* | 0.018 |
| BMI (kg/m2) | 29.2 ± 3.04 | 27.5 ± 2.36* | 0.017 |
| WC (cm) | 95.4 ± 8.8 | 88.8 ± 8.4* | 0.0001 |
| HbA1c (%) | 7.9 ± 1.01 | 7.9 ± 1.4 | 0.97 |
| eGDR (mg/kg/min) | 7.61 ± 1.5 | 8.20 ± 1.6* | 0.026 |
| Fat mass (%) | 35.3 ± 7.07 | 33.2 ± 6.4 | 0.053 |
| Fat mass index (kg/m2) | 10.1 ± 2.85 | 8.9 ± 2.24* | 0.031 |
| Appendicular skeletal muscle mass index (kg/m2) | 8.3 ± 0.8 | 8.06 ± 0.8* | 0.016 |
| Visceral adipose tissue (cm3) | 867.9 ± 531.9 | 753.8 ± 502.3 | 0.27 |
| Grip strength (kg) | 34.08 ± 9.4 | 33.42 ± 9.5 | 0.39 |
| Muscle quality index (kg/kg) | 1.47 ± 0.29 | 1.03 ± 0.74* | 0.041 |
Table 1: ** Anthropometric parameters, body composition, grip strength, HbA1c and eGDR at baseline and at 48 weeks.
BMI: Body Mass Index; WC: Waist Circumference; eGDR: Estimated Glucose Disposal Rate Data are mean ± SEM. Difference between baseline values (0 weeks) and 48 weeks were compared using a paired Student’s t-test (two-tailed). p values <0.05 were considered statistically significant. The BMI was positively correlated with percentage of fat mass (r=0.58; p=0.03), fat mass index (r=0.82; p=0.001) and waist circumference (r=0.67; p=0.01). Table 1: Anthropometric parameters, body composition, grip strength, HbA1c and eGDR at baseline and at 48 weeks.
A significant decrease in ASMI was observed 48 weeks after the intervention (p=0.016) (Figure 1). ASMI correlated with grip strength (r=0.89; p=0.001) and inversely with HbA1c (r=-0.57; p=0.03).
La eGDR was correlated negatively with Visceral adipose tissue (VAT) (r=-0.70; p=0.011 vs. r=-0.73; p=0.006) at the beginning and after the intervention (Figure 2). The VAT vas correlated with age, body weight and WC (Table 2).
| r | p | |
|---|---|---|
| Age (year) | 0.58 | 0.04 |
| Body weight (kg) | 0.76 | 0.004 |
| BMI (kg/m2) | 0.52 | 0.08 |
| WC (cm) | 0.66 | 0.018 |
| eGDR (mg/kg/min) | -0.7 | 0.011 |
Table 2: Correlation between visceral adipose tissue and age, anthropometric parameters and eGDR.
BMI: body mass index; WC: waist circumference; eGDR: estimated glucose disposal rate
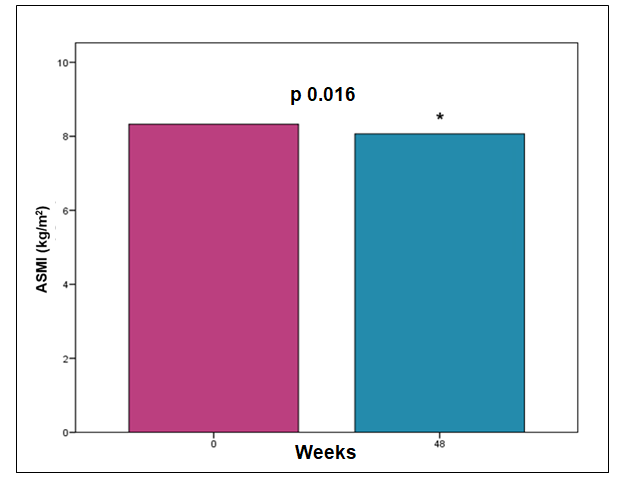
ASMI: Appendicular skeletal muscle mass index. Figure 1: Changes in appendicular skeletal muscle index.
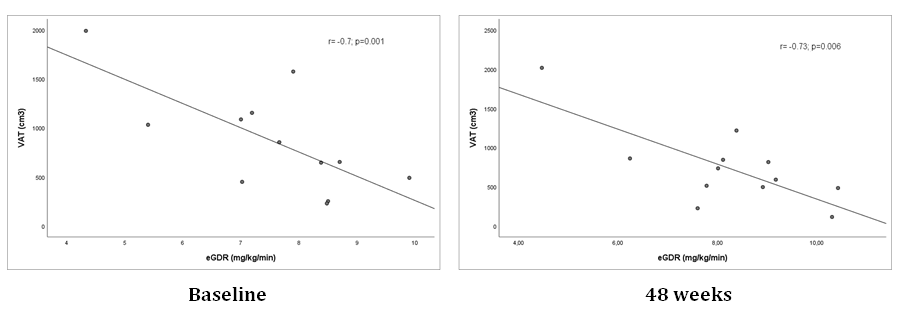
eGDR: Estimated Glucose Disposal Rate; VAT: Visceral Adipose Tissue Figure 2: Correlation between eGDR and VAT at the baseline and at 48 weeks.
The muscle quality index was 1.5±0.3 kg/kg in men and 1.3±0.2 kg/kg in women. 60% and 37.5% of women and men, respectively, presented positive screening for sarcopenic obesity. Muscle function was evaluated, observing that none met the criteria to advance to the next diagnostic step. The daily average of steps was 8233±2644 and of exercises 3.5±2.7, showing a compliance of 30% for the latter. The healthy plate was present in 1.6±0.2 of the daily main meals and fruit consumption was 2.3±0.6 portions per day. The number of steps, strength-resistance exercises and the healthy plate were not associated with the ASMI (p=0.61; p=0.67; p=0.091), fat mass (p=0.58; p=0.28; p=0.86) and VAT (p=0.29; p=0.81; p=0.27).
Discussion
Our study shows that patients with T1D and overweight/ obesity after a program of lifestyle changes presented changes in their body composition, reducing fat mass and appendicular skeletal muscle mass. Several studies show that weight loss leads to decreased lean mass. Rossi, et al. [17], showed that voluntary weight loss in people with obesity is accompanied by a decrease in lean mass and muscle strength, increasing the risk of sarcopenic obesity. In a randomized controlled trial, Beavers, et al. [18] evaluated a population of postmenopausal women with abdominal obesity that underwent energy restriction for 5 months, observing a decrease in fat and lean mass by DXA during follow-up.
In the Look AHEAD study, in patients with T2D, after one year of follow-up, a reduction in fat mass (5.6±0.2 kg) and lean mass (2.3±0.1 kg) was observed in the diet and exercise intervention group [19]. Our results show that, after one year, the loss of fat and lean mass was 3.4 kg and 2 kg, respectively (results not shown).
In our population, we found an association between glycemic control and muscle tissue, but not with fat mass. A systematic review evaluated body composition in young people with T1D, observing that those with higher values of fat mass had poor glycemic control, dyslipidemia or higher blood pressure [6]. Recent studies showed that people with T1D had structural and metabolic alterations in muscle mass [20], decreased muscle function [21], and impaired fat-to- muscle tissue ratio associated with poor glycemic control [22].
The quality muscle index in our study was extremely low in both men and women, which is of interest given that it is considered a predictor of risk of disability and mortality [23, 24].
Recent research concludes that greater WC is related to lower muscle quality in overweight and obese adults [25]. The accumulation of fat, particularly in the abdominal region, favors the development of resistance to exogenous insulin, the so-called “double diabetes”, which leads to long- term cardiovascular complications [6]. We found that VAT was associated with age, consistent with results reported in a large European cohort [26]. We also observed that eGDR was inversely correlated with TAV. A study conducted in Brazil in patients with DM1 without obesity showed an inverse association between eGDR and android fat distribution and WC [27].
Adherence to the healthy plate, fruit consumption and daily steps was 80%, while for strength-resistance exercises it was only 30%. Low exercise adherence probably contributed to loss of lean mass, although we found no such association. Multiple studies have shown that resistance training increases muscle mass, muscle strength and physical performance [28, 29], and it is necessary to improve the prescription of physical exercise to promote adherence.
Our study has several strengths and weaknesses. The strong points are the novelty of studying the change in body composition in patients with type 1 diabetes using the DXA method and, to our knowledge; it is the first study in our setting that applies the new diagnostic criteria for sarcopenic obesity.
The main limitation is the relatively small sample size and a single center, so the associations of various variables should be considered with caution. The lack of reference values by age, sex and specific for the Argentine population of the parameters of body composition and grip strength continue to be obstacles to their use in routine clinical practice. The grip strength measurement was not performed with the Jamar hydraulic dynamometer, considered the gold standard, but recently Díaz G, et al. [30] concluded that the Camry dynamometer cannot be interchanged with the Jamar, but reports close values, making it suitable for use in daily practice.
Conclusion
Our lifestyle change program in people with T1D and overweight/obesity achieved a positive impact on body weight, BMI, waist circumference, fat mass, and eGDR, but a negative impact on skeletal muscle. Knowing body composition opens a window of opportunity to plan personalized nutritional and physical exercise interventions that favor the preservation of muscle tissue, given the recognized concern about sarcopenia in this population. Further studies with a larger number of patients are necessary to corroborate these results.
References
-
Kjaer IG, Kolle E, Hansen BH, Anderssen SA, Torstveit MK (2015) Obesity prevalence in Norwegian adults assessed by body mass index, waist circumference and fat mass percentage. Clin Obes 5(4): 211-218.
-
Szadkowska A, Madej A, Ziółkowska K, Madej A, Szymańska M, et al. (2015) Gender and Age - Dependent effect of type 1 diabetes on obesity and altered body composition in young adults. Ann Agric Environ Med 22(1): 124-128.
-
Rodríguez M, Cicchitti A, Bertona C, González J, Carrasco N, et al. (2019) Overweight and obesity in adults with type 1 Diabetes Mellitus. Rev Soc Argent Diabetes 53(3): 109.
-
Teupe B, Bergis K (1991) Epidemiological evidence for “double diabetes”. Lancet 337(8737): 361-362.
-
Prado CM, Purcell SA, Alish C, Pereira LS, Duetz NE, et al. (2018) Implications of low muscle mass across the continuum of care: a narrative review. Ann Med 50(8): 675-693.
-
Calella P, Gallè F, Fornelli G, Liguori G, Valerio G (2020) Type 1 diabetes and body composition in youth: A systematic review. Diabetes Metab Res Rev 36(1): e3211.
-
Rathnayake N, Alwis G, Lenora J, Lekamwasam S (2018) Concordance between appendicular skeletal muscle mass measured with DXA and estimated with mathematical models in middle-aged women. J Physiol Anthropol 37(1): 19.
-
Jentoft CAJ, Bahat G, Bauer J, Boirie Y, Vandewoude M, et al. (2019) Sarcopenia: revised European consensus on definition and diagnosis. Age Ageing 48(1): 16-31.
-
An HJ, Tizaoui K, Terrazzino S, Cargnin S, Lee KH, et al. (2020) Sarcopenia in Autoimmune and Rheumatic Diseases: A Comprehensive Review. Int J Mol Sci 21(16): 5678.
-
Donini LM, Busetto L, Bischoff SC, Cederholm T, Pomar MDB, et al. (2022) Definition and Diagnostic Criteria for Sarcopenic Obesity: ESPEN and EASO Consensus Statement. Obes Facts 15(3): 321-335.
-
Barazzoni R, Bischoff SC, Boirie Y, Busetto L, Cederholm T, et al. (2018) Sarcopenic obesity: Time to meet the challenge. Clin Nutr 37(6 Pt A): 1787-1793.
-
Hong SH, Choi KM (2020) Sarcopenic Obesity, Insulin Resistance, and Their Implications in Cardiovascular and Metabolic Consequences. Int J Mol Sci 21(2): 494.
-
Kim J, Wang Z, Heymsfield SB, Baumgartner RN, Gallagher D (2002) Total-body skeletal muscle mass: estimation by a new dual-energy X-ray absorptiometry method. Am J Clin Nutr 76(2): 378-83.
-
Schutz Y, Kyle UU, Pichard C (2002) Fat-free mass index and fat mass index percentiles in Caucasians aged 18-98 y. Int J Obes Relat Metab Disord 26(7): 953-960.
-
Lopes LCC, Gonçalves VL, Schincaglia RM, Gonzalez MC, Prado MC, et al. (2022) Sex and population-specific cutoff values of muscle quality index: Results from NHANES 2011-2014. Clin Nutr 41(6): 1328-1334.
-
Williams KV, Erbey JR, Becker D, Arslanian S, Orchard TJ (2000) Can clinical factors estimate insulin resistance in type 1 diabetes?. Diabetes 49(4): 626-632.
-
Rossi AP, Rubele S, Calugi S, Caliari C, Pedelini F, et al. (2019) Weight Cycling as a Risk Factor for Low Muscle Mass and Strength in a Population of Males and Females with Obesity. Obesity (Silver Spring) 27(7): 1068-1075.
-
Beavers KM, Lyles MF, Davis CC, Wang X, Beavers DP, et al. (2011) Is lost lean mass from intentional weight loss recovered during weight regain in postmenopausal women?. Am J Clin Nutr 94(3): 767-774.
-
Pownall HJ, Bray GA, Wagenknecht LE, Walkup MP, Johnson KC, et al. (2015) Changes in body composition over 8 years in a randomized trial of a lifestyle intervention: the look AHEAD study. Obesity (Silver Spring) 23(3): 565-572.
-
Monaco CMF, Gingrich MA, Hawke TJ (2019) Considering type 1 diabetes as a form of accelerated muscle aging. Exerc Sport Sci Rev 47(2): 98-107.
-
Shu J, Matarese A, Santulli G (2019) Diabetes, body fat, skeletal muscle, and hypertension: the ominous chiasmus?. J Clin Hypertens 21(2): 239-242.
-
Wierzbicka E, Swiercz A, Pludowski P, Jaworski M, Szalecki M (2018) Skeletal Status, Body Composition, and Glycaemic Control in Adolescents with Type 1 Diabetes Mellitus. J Diabetes Res 2018: 8121634.
-
Reinders I, Murphy RA, Koster A, Brouwer IA, Visser M, et al. (2015) Muscle Quality and Muscle Fat Infiltration in Relation to Incident Mobility Disability and Gait Speed Decline: the Age, Gene/Environment Susceptibility- Reykjavik Study. J Gerontol A Biol Sci Med Sci 70(8): 1030-1036.
-
Hairi NN, Cumming RG, Naganathan V, Handelsman DJ, Le Couteur GJ, et al. (2010) Loss of muscle strength, mass (sarcopenia), and quality (specific force) and its relationship with functional limitation and physical disability: the Concord Health and Ageing in Men Project. J Am Geriatr Soc 58(11): 2055-2062.
-
Valenzuela PL, Maffiuletti NA, Tringali G, De Col A, Sartorio A (2020) Obesity-associated poor muscle quality: prevalence and association with age, sex, and body mass index. BMC Musculoskelet Disord 21(1): 200.
-
Ofenheimer A, Kohansal BR, Hartl S, Burghuber OC, Krach F, et al. (2020) Reference values of body composition parameters and visceral adipose tissue (VAT) by DXA in adults aged 18-81 years-results from the LEAD cohort. Eur J Clin Nutr 74(8): 1181-1191.
-
Momesso DP, Bussade I, Lima GA, Fonseca LP, Russo LA, et al. (2011) Body composition, metabolic syndrome and insulin resistance in type 1 diabetes mellitus. Arq Bras Endocrinol Metabol 55(3): 189-193.
-
Argyropoulou D, Geladas ND, Nomikos T, Paschalis V (2022) Exercise and Nutrition Strategies for Combating Sarcopenia and Type 2 Diabetes Mellitus in Older Adults. J Funct Morphol Kinesiol 7(2): 48.
-
Weinheimer EM, Sands LP, Campbell WW (2010) A systematic review of the separate and combined effects of energy restriction and exercise on fat-free mass in middle-aged and older adults: implications for sarcopenic obesity. Nutr Rev 68(7): 375-388.
-
Díaz G, Callejas P, Cuesta V, Calvera S (2018) Concordance- conformity within Camry and Jamar hand dynamometers in adults. Rev Nutr Clin Metab 1(1): 35-41.
- Investigation of Polymorphisms in PPAR-Ɣ and TRHR Genes and their Impact on Turkish Diabetic and Obese Individuals
- The Impact of Aircraft Noise Exposure on the Efficacy of Empagliflozin Therapy in an Animal Model of Obesity
- Rooibos Mitigates Metabolic and Inflammatory Dysfunctions in Mice Fed a High-Carbohydrate Diet
- Synergistic Effect of Combined Leaf Extract of Vernonia amygdalina, Ocimum gratissimum, and Zingiber officinale Tuber on Phytochemical Profile, Antioxidant Activity, Serum Insulin, and Biochemical Parameters in Streptozotocin-Induced Diabetic Rats
- Investigation of Cardiovascular Responses to Aerobic Exercise in Obese University Students
- A Look at the Phase Angle Obtained by Electrical Bioimpedance