Less Sugar by Default: A Nudge Methodology to Reduce Sugar Consumption in a Coffee Bar
The present study aimed to reduce the sugar intake among the customers who purchased coffee in a coffee shop inside a gym in Catania, Italy. We hypothesised that people would frame their choice about the amount of sugar to put in their coffee in units (number of packets) and not in amount (grams). Thus, we expected a significant decrease in sugar intake among the customers in the experimental phase. The customers of the coffee shop were observed for two weeks (N=213) and just the data about those who put sugar in their coffee were analysed (N=96). During both the first (control phase) and the second week (experimental phase), sugar consumption was measured. During the experimental phase, however, the packets originally used in the coffee shop (7.5g) were replaced with packets that contain less sugar (4g). Results supported the hypothesis, showing a significant reduction in the sugar consumption during the second week.
Paolina Stoyanova3, Marianna Vaccaro3, Mariateresa Volpe3,
Francesco Pozzi1,3 and Paolo Moderato1,3
Keywords: Sugar; Nudge; Default Rule; Coffee
Introduction
In 2015, the World Health Organization (WHO) [1] recommended that the intake of free sugars should not exceed 10% of the total daily intake of calories1. The literature provides evidence that a prolonged overconsumption of sugar can increase the chance to develop several health issues and diseases such as diabetes, coronary heart disease and obesity [2, 3, 4, 5, 6]. Among the factors that in general influence food consumption, packaging and portion sizes have been found to play a significant role [7, 8, 9].
Despite these evidences worldwide the last 30-40 years have been characterised by a general increase in package size of products [10].
Nudging is a policy program developed by Richard Thaler and Cass Sunstein starting from the principles of Behavioral Economics in order to help people to act in a way that is more functional with their goals without using punishments or bans. That is achieved by working on the environment in which people act and take decisions [11]. The literature about Nudging shows that one of the most effective strategy to promote desirable behaviors is the use of the default option [12, 13]. Setting a default option means setting an option that will be automatically chosen unless people actively choose to behave in a different way. Many examples can be listed. Smartphones and digital device are sold with predefined setting that people can eventually change. Many subscriptions get automatically renewed unless the customer actively decides to unsubscribe. According to Sunstein, however, the default rule should be the one that is in line with people's preferences in order to be considered as a nudge.
The present study aimed to reduce the intake of sugar in a coffee shop working on offering reduced amount sugar in the package. We assumed that people frame their choice about the amount of sugar to put in their coffee in units, (number of packets) rather than considering the effective amount (grams) contained in the packets. It has been hypothesised that by replacing the original packets of sugar with ones that contains a smaller amount of it would have reduced the average of sugar intake per person.
Material and Methods
Setting
The intervention took place in a gym in Catania, Italy. Participants were the self-selected customers of the gym’s coffee shop. The data was collected for twelve days (from Monday to Saturday), between 3pm and 4pm.
Material
Packets with 7,5g of sugar were used during the control phase, replaced with 4g packets during the experimental one.
Measures
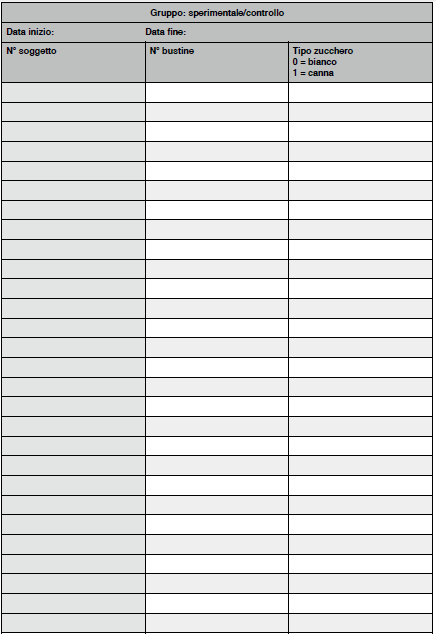
An observational grid was used in order to note how many packets of sugar each client was pouring in their drinks (Figure 1).
Procedure
The experimenter observed just the customers who purchased coffee. After the client's finished to drink it, the experimenter takes note of the number of packets used. Four possible sources of data were recorded:
• When people did not use any sugar, a 0 was noted on the grid;
• When one or more packets were empty the number of used packets were noted on the grid;
• When the packet was not empty, it was arbitrary choose to consider it as half full packet;
• When were used a certain number of packets plus a part of another, it was noted the number of packet plus half.
For the data analysis, were considered just the clients who used brown or white sugar, while those who used other kinds of sweeteners were excluded.
Outcome Measure
The average of grams consumed per person among the customers who put sugar in their coffee was the outcome measure of the experiment. In order to do it, packets have been converted in grams.
Results
During the control phase 102 customers were observed; among them 52 (51%) put sugar in their coffee while 50 (49%) did not. During the experimental phase 111 customers were observed; among them, 44 (40%) put sugar in their coffee while 67 (60%) did not;
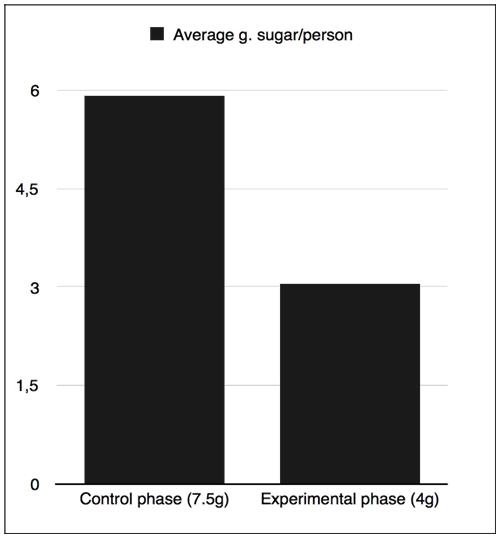
To evaluate the amount of sugar consumed in the two phases an independent t-test was performed excluding participants who did not put any sugar in the coffee. The average intake of sugar per person was 5.91g (SD=1.87) during the control observation, reducing to 3.05g (SD=1.01) during the experimental one (Figure 2). The difference between the average of sugar consumed during the control phase and the experimental one was statistically significant (t(94)=9.10; p<0.001; Cohen’s D=1.37).
Discussion
The results confirmed the initial hypothesis, showing a significant reduction in the average of sugar intake during the experimental phase. The study seems to support the effectiveness of manipulating the default rule when facing with unhealthy behaviors that are assumed to be “mindless”. Results seem to be in line with the idea that customers, when choosing the amount of sugar base their choice on units instead of on real amount. Further experiments could assess the generalisability of this finding in other cultural contexts and with different kind of goods.
The intervention has some main limitations. First, due to the experimental design, it is not possible to exclude that some of the clients were regular customers and so, present in both the control and the experimental condition. Second, the choice to consider as half the non- empty packets of sugar was arbitrary. However, the same measurement was kept in both conditions. In further studies it could be useful to measure the non-empty packets in order to have more precise data.
Ethical Approval
All procedures performed in the study were in accordance to the ethical standards of the institutional and/or national research committee and with the 1964 Helsinki declaration and its later amendments or comparable ethical standards. Acknowledgement: The present text is part of the 7th chapter of the first author’s PhD thesis.
References
-
WHO (2015) Guideline: sugars intake for adults and children. World Health Organization.
-
Vecchia C, Franceschi S, Bidoli E, Barbone F, Dolara P (1993) Refined-sugar intake and the risk of colorectal cancer in humans. International Journal of Cancer 55(3): 386-389.
-
Janket S, Manson J, Sesso H, Buring J, Liu S (2003) A prospective study of sugar intake and risk of type 2 diabetes in women. Diabetes Care 26(4): 1008-1015.
-
Johnson R, Appel L, Brands M, Howard B, Lefevre M, et al. (2009) Dietary sugars intake and cardiovascular health: A scientific statement From the American Heart Association. Circulation 120(11): 1011-1020.
-
Lustig R, Schmidt L, Brindis C (2012) Public health: The toxic truth about sugar. Nature 482(7383): 27- 29.
-
Yang Q, Zhang Z, Gregg E, Flanders W, Merritt R, et al. (2014) Added Sugar Intake and Cardiovascular Diseases Mortality Among US Adults. JAMA Internal Medicine 174(4): 516.
-
Rolls BJ, Morris EL, Roe LS (2002) Portion size of food affects energy intake in normal-weight and overweight men and women. The American journal of clinical nutrition 76(6): 1207-1213.
-
Aerts G, Smits T (2017) The package size effect: How package size affects young children’s consumption of snacks differing in sweetness. Food Quality and Preference 60: 72-80.
-
Poelman M, Eyles H, Dunford E, Schermel A, L’Abbe M, et al. (2015) Package size and manufacturer- recommended serving size of sweet beverages: a cross-sectional study across four high-income countries. Public Health Nutrition 19(6): 1008-1016.
-
Smiciklas-Wright H, Mitchell D, Mickle S, Goldman J, Cook A (2003) Foods commonly eaten in the United States, 1989-1991 and 1994-1996: Are portion sizes changing? Journal of the American Dietetic Association 103(1): 41-47.
-
Thaler RH, Sunstein CR (2008) Nudge: Improving Decisions about Health, Wealth, Happiness. New Haven, CT: Yale University Press.
-
Johnson EJ, Goldstein D (2004) Defaults and donation decisions. Transplantation 78(12): 1713-1716.
-
Thaler RH, Benartzi S (2004) Save More Tomorrow™: Using behavioral Economics to increase employee saving. Journal of Political Economy 112(1): 164-187.
- The Expanding Landscape of Road Rage: A Systematic Review of Conflicts Involving Drivers, Pedestrians, and Micromobility
- Validating Cognitive Models of Royal Navy Performance on Control Systems
- Comparing Standard and State-of-the-art Firefighter Coats on Postural Balance and Gait in a Live Burn Environment
- Investigating the Integration of Telemedicine into Clinicians Workflow: A Review of Methods
- Risk Assessment of Ergonomic Factors in a Textile Firm by RULA, REBA and Fine Kinney Methods
- Impact of Self-Esteem Training on Individuals with Disabilities Aged 17-30