Effects on the Tactile Affections of Touch Behavior and Product Material
This study examines the degree of influence specific tactile properties have by investigating user behavior when the epidermal skin layer comes into contact with various tactile samples. Although there have been various studies on user sensitivity for consumer products, there has not been an in-depth examination of tactile stimulus on users particularly in utilizing a measurement system to evaluate specific tactile properties and how this influences the user. This study observed how the user perceived the concept of roughness and how this perception changed as tactile properties were altered. There was an analysis of variance for subjective roughness of 6 different types of tactile material contacted by 3 touch behaviors (press, rub and grasp). There was significant difference between the subjective roughness according to different tactile material and touch behavior. However, there was no significant difference between the luxuriousness according to the types of tactile material and touch behaviors. Post-hoc analysis results for the different tactile material indicated that subjective roughness was judged differently according to the increase of roughness properties. In addition, subjects could not accurately judge the difference when the size of the tactile material was small even if subjective roughness was high. Post-hoc analysis results of the touch behavior indicated that feeling friction allowed users to easily distinguish pressure, but pressing made users not feel roughness well. This study suggests a tactile guideline for measuring roughness through certain design parameters.
Introduction
As the products become more sophisticated and complex, the demands of customers are increasing. Also, companies manufacturing products have been trying to secure competitiveness by studying user affections. The components that make up the product have been improved for design, functional and technological aspects so that the affection is applied as a way to enhance the competitiveness of the products [1, 2, 3]. In particular, the objects that users manipulate and interact with products are related to indoor factors [4].
However, most of the affective research on the internal parts focuses on the visual emotional evaluation, so the tactile research is still insufficient [5, 6, 7]. Recently, studies on the luxurious feeling of indoor interior materials have been attempted in terms of tactile sense. However, there is a limit to the detailed evaluation by simplifying the measured values of the design variables related to the tactile sense of the internal parts. In addition, there is a lack of consideration of the measurement method only by directly utilizing the measured values of the design variables.
Although there are various parameters for tactile sense, there are four physical characteristics that can be typically measured in the interior of the product as hardness, roughness, flexibility and coolness. Among these physical characteristics, hardness and roughness can be measured in common for all internal parts. Roughness is one of the representative tactile evaluation variables used in the field of electronics, automobiles and clothing.
While the physical characteristics of a material are characteristics of a product, the act of contacting a product can be seen as a human’s characteristics that affects evaluation. Therefore, considering touch behavior in tactile affective evaluation can be a criterion that can enhance measurement reliability and validity. This study investigates into the material and contact method which affect roughness, which is one of the tactile variables related to the luxuriousness. Based on this, we propose an appropriate evaluation method based on factors considering tactile affective evaluation of products.
Methods
Feeling the Tactile Sense
The lexical meaning of tactile is defined as the sense of contact stimulation of the skin senses. Previous research has defined various for the terms of tactile [8]. As defined in most studies, tactile sense has touch and interaction with skin senses. The term of haptic which has been popular recently is also the same in this context, but represents a comprehensive representation of contact by temperature, pressure, and vibration.
There are many mechanical receptors in the skin that feel the tactile sense. Meissner corposcule, Pacinian corposcule, Ruffini corposcule, Krause corposcule and Free nerve ending feel the vibration, pressure, warm, cooling and apperception, respectively. In other words, the way to feel the tactile means that it is felt by four stimuli of vibration, pressure, coolness and apperception. Therefore, the roughness dealt with in this study is perceived by vibration and pressure.
Measurement of Roughness
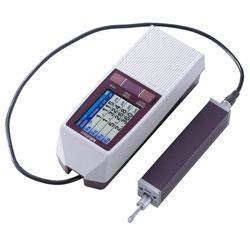
Subjects: A total of ten subjects who had no history of tactile disorders and disease were participated in this experiment. The average age of the subjects was 27.90 (±3.35) years old, and a calibration test was conducted as a preliminary experiment to determine if there is an ability to evaluate tactile stimulus. Subjects who passed the preliminary experiment explained the purpose, contents, and risks of the main experiment, and expressed written consent before the participation. Experimental apparatus and environment: To measure roughness, one of the tactile parameters of the indoor parts, SJ-210 surface roughness tester released by Mitutoyo Co. was used (Figure 1). The measuring system adopted 4mN equipment which can measure various range from soft to hard material. The probe (drive unit) of the measuring system repeatedly moves on the surface surrounding the area (12.5 mm × 12.5 mm) of the sample to measure the roughness.
The surface roughness tester can obtain Ra and Rz values, which are roughness standards. Ra is average roughness of centreline calculated by the average of the deviation of all crests and troughs across the average line over the reference length from the roughness curve. Rz is the mean roughness of 10 points and is measured by the reference length in the roughness section curve. In other words, the average difference in distance between the highest 5 crests and the lowest 5 troughs from the baseline parallel to the mean line of the section curve. The materials used in this experiment were selected based on 32 samples of commercially available products. As a result, Ra was 1.677 ~ 21.660 and Rz was 12.572 ~ 123.740. Experimental design: Types of materials and touch behavior were selected as independent variable. The levels of materials included six types and three levels of touch behavior were established by press, rub and grasp. Thus, repeated measurements were made through a total of 18(6 × 3) combinations. The values of Ra and Rz according to each material type are shown in Table 1. Each value was used by averaging the values measured three times repeatedly. The touch behaviors were derived from the three ways of press, rub and grasp based on the object recognition behaviors presented by research on Lederman and Klatzky [9]. Dependent variables were measured by the Likert 7-point scale for subjective roughness and luxuriousness.
| No. | Tactile material | R a | R z |
|---|---|---|---|
| 1 | A | 2.981 | 15.767 |
| 2 | B | 3.799 | 18.323 |
| 3 | C | 7.417 | 29.798 |
| 4 | D | 6.150 | 23.021 |
| 5 | E | 8.550 | 30.389 |
| 6 | F | 12.054 | 44.155 |
Table 1: Roughness properties of tactile material.
Table 1: Roughness properties of tactile material. Experimental procedure: Prior to the experiment, subjects were asked to explain the purpose and precautions and to participate in the main experiment after questioning about the physical condition. Subjects who passed the calibration test participated in the experiment, and none of the subjects were found to be inappropriate. Three different touch behaviors were then trained for each of the six materials with different roughness. In order to minimize the visual effect of the material, the subjects performed touch behavior through As a result of ANOVA for subjective roughness, the type of material (p<0.0001) and touch behavior (p=0.0004) were commonly significant at the significance level of 5%. The interaction effect of two factors between type of material and touch behavior was not significant (p=0.3276). Table 2 indicates the results of ANOVA for subjective roughness.
a box that was visually intercepted. Figure 2 shows the experimental environment and stimulus applied to this experiment.
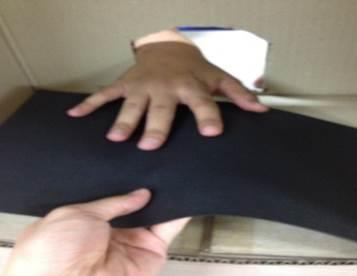
To ensure sufficient tactile stimulation, all samples provided with the subjects were to be at least 100 mm × 100 mm in size. The effect on apperception could not facilitate by not touching the corner part while presenting the stimulus. The surface temperature was set to be 24 degrees in order to exclude the effect on coolness. Subjects who rubbed for more than 30 seconds provided 30 seconds of rest to prevent dulling of the sensation due to changes of skin temperature. The order of the experimental conditions was arranged in a method of Latin square for counter balancing in order to prevent learning effects on the stimulus [10].
Results
| Source | DF | SS | MS | F-Value | Pr>F |
| Tactile material | 5 | 126.733 | 25.347 | 13.500 | <0.0001* |
| Touch behavior | 2 | 16.533 | 8.267 | 12.730 | 0.0004* |
| Tactile material×Touch behavior | 10 | 6.933 | 0.693 | 1.098 | 0.3276 |
| *: significant at α=0.01 | |||||
|---|---|---|---|---|---|
Table 2: ANOVA table for subjective roughness.
As a result of the post-hoc analysis on the types of materials and touch behavior, there was a significant difference according to the difference of Ra value. The average of subjective roughness among the types of materials indicates in the order of A, D, B, C, E and F. Table 3 describes the average subjective roughness between the levels of the material types. This result means that the level of subjective roughness is similar to the Ra value except for the D type. In the case of D types, the subjective roughness is low even though the values of Ra and Rz, which are the physical properties of the roughness, are medium level.
| SNK Grouping | Mean | N | Tactile materials |
|---|---|---|---|
| A | 4.50 | 30 | F |
| A | 4.10 | 30 | E |
| A | 3.97 | 30 | C |
| B | 3.33 | 30 | B |
| C | 2.37 | 30 | D |
| C | 2.33 | 30 | A |
Table 3: Post-hoc analysis results of subjective roughness for six tactile materials (Unit: score).
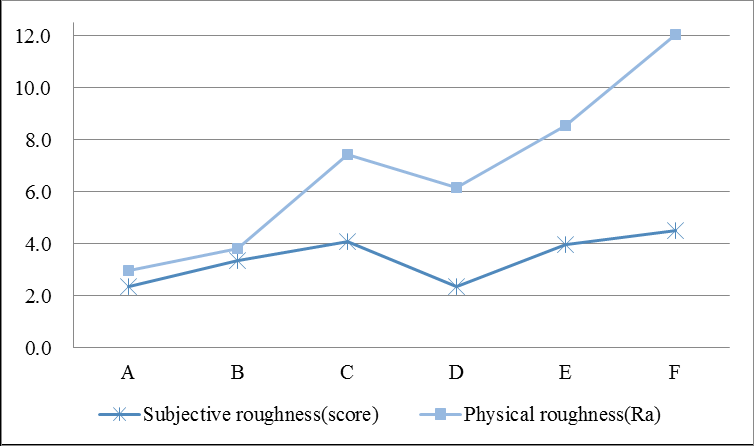
The comparison of Ra value and subjective roughness was conducted as seen in Figure 3. The result revealed that there is a similar pattern except for material D. Also, it can be seen that the variation of the subjective roughness is not relatively large compared to the variation of Ra value. The surface of the material D was characterized by many and small size of the embossing as shown in Figure 4.

As a result of ANOVA for the luxuriousness, the type of material (p=0.6517) and touch behavior (p=0.7456) were all not statistically significant. The interaction effect of two factors between type of material and touch behavior was not significant (p=0.7655). Table 4 indicates the results of ANOVA for luxuriousness.
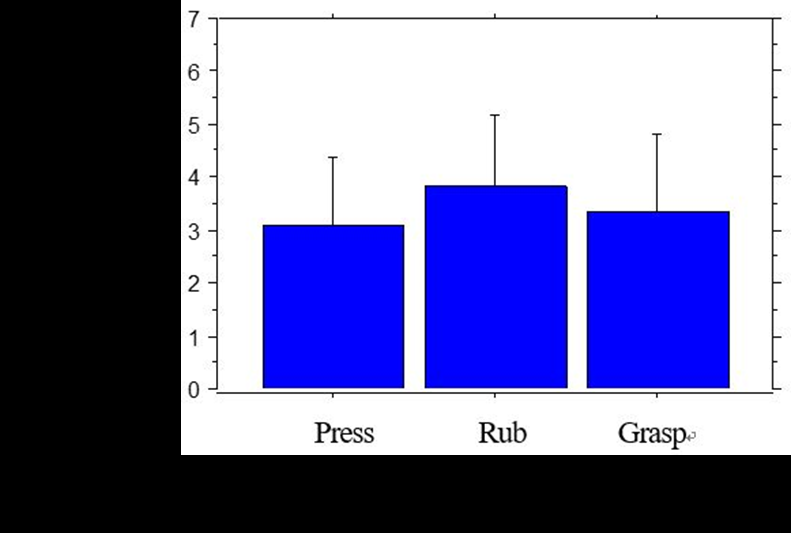
As an aspect of touch behavior, there was no significant difference between press and grasp. The subjective roughness for the rub was a significant difference in the press and grasp, respectively. Especially, when the rubbing action is performed, the degree of roughness is higher than other touch behavior. Figure 5 depicts the average subjective roughness among the level of touch behavior.
| Source | DF | SS | MS | F-Value | Pr>F |
|---|---|---|---|---|---|
| Tactile material | 5 | 10.428 | 2.086 | 0.665 | 0.6517 |
| Touch behavior | 2 | 0.578 | 0.289 | 0.298 | 0.7456 |
| Tactile material×Touch behavior | 10 | 5.222 | 0.522 | 0.652 | 0.7655 |
| *: significant at α=0.01 | |||||
Table 4: ANOVA table for subjective luxuriousness.
Discussion and Conclusion
The purpose of this study was to investigate the effect of the types of materials and touch behavior on subjective roughness and luxuriousness for the interior materials of the products. For the classification of materials, the degree of roughness, one of the tactile properties, was measured using Ra and Rz values. As a result of ANOVA, it was found that the effect of the types of materials and touch behavior were significant on subjective roughness. This means that it can be applied as an evaluation variable because there is a relation between the physical characteristics of roughness and subjective roughness. However, luxuriousness, one of the most important factors in the affective evaluation, was less relevant to the physical characteristics of roughness. It seems to be difficult to judge for evaluation using only the tactile sense. Therefore, it is necessary to consider both visual and tactile assessments for luxuriousness of products material.
As the results of post-hoc analysis on the subjective roughness, the D material showed that the surface roughness could not be distinguished by the human fingerprint because of the small embo characteristic. In this case, the embo is designed to be smaller than a certain level such as Nissan's automobile and it seems to have felt a soft touch [11]. It is considered to be useful when differentiating visually and tactile affection while designing interior materials.
During the touch behavior, the rubbing with friction provides a clear sense of roughness compared to pressing and grasping. Therefore, it is important to maintain consistent touch behavior for tactile evaluation. This study shows that roughness, one of the physical characteristics of tactile sense, is applicable to subjective evaluation of affection. In addition, there was a difference in tactile affection due to touch behavior, which was considered as a factor in the process of affective evaluation.
References
-
Jindo T, Hirasago K (1997) Application studies to car interior of Kansei engineering. International Journal of Industrial Ergonomics 19(2): 105-114.
-
Park J, Park S (2018) Optimization of Tactile Material Properties to Improve Affection Satisfaction of Vehicle Interior Materials. Journal of Ergonomics Society of Korea 37(4): 445-457.
-
Xu L, Eo H, Park S, Lee S (2019) A Study on User Cognitive and Affective Information Supporting System Development for Product Design. In: Chung W, Shin C, (Eds.), Advances in Interdisciplinary Practice in Industrial Design. AHFE 2018. Advances in Intelligent Systems and Computing, Springer, Cham 790: 267-278.
-
Kim KS, Lee EJ (2011) A Study on the Materials of Automotive Interior Design. Bulletin of Korean Society of Basic Design & Art 12(6): 27-35.
-
Oh K, Ryu T, You H, Yun MH (2002) A Kansei evaluation for passenger car interior materials. Proceeding of the 2002 Fall Conference of the Ergonomics Society of Korea, Kangwon, Korea, pp: 179-182.
-
Bahn S, Lee C, Nam CS, Yun MH (2009) Incorporating affective customer needs for luxuriousness into product design attributes. Human Factors and Ergonomics in Manufacturing & Service Industries 19(2): 105-127.
-
Jung G, Kim SM, Kim SY, Jung ES, Park S (2010) Effects of design factors of the instrument cluster panel on consumers’ affection. Proceedings of the International Multi Conference of Engineers and Computer Scientists, Hong Kong.
-
Choe DM (2010) A study on sensory and emotional responses according to tactile attributes of surface texture-With emphasis on the application of surface texture on mobile devices. Master thesis, KAIST.
-
Lederman SJ, Klatzky RL (1987) Hand movements: A window into haptic object recognition. Cognitive Psychology 19(3): 342-368.
-
Williams EJ (1949) Experimental designs balanced for the estimation of residual effects of treatments. Australian Journal of Chemistry 2(2): 149-168.
-
Ban A, Tamuraya M, Takeuchi T, Kang YY, Fujimoto H, et al. (2009) Surface structure of article, U.S. Patent Application 13/129,217.
- The Expanding Landscape of Road Rage: A Systematic Review of Conflicts Involving Drivers, Pedestrians, and Micromobility
- Validating Cognitive Models of Royal Navy Performance on Control Systems
- Comparing Standard and State-of-the-art Firefighter Coats on Postural Balance and Gait in a Live Burn Environment
- Investigating the Integration of Telemedicine into Clinicians Workflow: A Review of Methods
- Risk Assessment of Ergonomic Factors in a Textile Firm by RULA, REBA and Fine Kinney Methods
- Impact of Self-Esteem Training on Individuals with Disabilities Aged 17-30