Comparison of different Parameters of Heart Rate Frequency of Tasks Performed during Aircraft Open-Basket Ground Deicing Activities
Plane deicing is mandatory to insure safe plane take-off. Previous human factors studies have shown that open-basket deicing activity can be improved. The objective of the paper is to compare heart rate assessment models within a field study with numerous influencing variables and small sample size as well as to deepen our understanding of the most demanding openbasket tasks using cardiac output. A field study in a Canadian centered plane deicing facility was conducted in 2016-2017. 12 participants contributed to a thorough description and analysis of open-basket deicing activities. Respiratory and cardiac output of these participants was collected using Hexoskin vests. Working heart rate, heart rate reserves as well as calculations of absolute cardiac cost were done. Working heart rate (WHR), Heart Rate Reserve (HRR) and Absolute Cardiac Cost (ACC) do not behave uniformly for the majority of participants. In field studies with a large number of influencing variables on the heart rate, it is usually not sufficient to consider one single evaluation measure like WHR. In the interest of protecting employees, it seems to make sense to use the more cautious measures HRR or ACC as parameters instead of WHR. Superimposed activities (e.g. forced postures and dynamic use of upper body) have a significant effect on heart rate increases. In 8 out of 11 cases we have fatigue-related increases in heart rate over the observation period. Similar studies need to be conducted in other aircraft deicing facilities.
Introduction
Method Problem
For almost a hundred years, analyses of the heart rate have been used to assess individual stress, fatigue and recovery. There are a number of review articles on this subject, which also deal with the validity, objectivity or inter-rater reliability of heart rate measurements and their interpretation in case studies [1, 2, 3, 4, 5, 6, 7]. Particularly in the case of small practical case studies in companies, numerous factors influence the results. The contributing factors - e.g. climatic influences - can only be controlled or eliminated in rare cases. This was the reason for us to investigate a data set from aircraft de-icing - which indeed contains a wealth of contributing factors - with regard to its suitability for the interpretation of derived assessment measures of heart rate. We concentrated on Working Heart Rate (WHR), Heart Rate Reserve (HRR) and Absolute Cardiac Cost (ACC).
Real Problem
Under icy, snowy or cold conditions, plane de-icing is mandatory to insure safe plane take-off [8, 9]. Ground de- icing activities are performed by de-icing technicians who make sure all ice or snow contaminants have been completely removed prior to take-off [10, 11]. Staff are trained, tested and retested each de-icing season on processes, icing/anti- icing glycols, planes specific needs and others [11, 12]. In centralized de-icing facilities, plane de-icing involves up to four open or closed-baskets trucks that move around each plane [10]. Multiple interactions occur, making this work system a complex one [10]. De-icing organizations are high reliable organizations [12] focused on delivering an excellent and safe service to an airport (fast de-icing, clean plane) as well as keeping their technicians healthy and safe. When accidents occur [8], it could be fatal for de-icing technicians [8]. Technicians are exposed to multiple risks factors simultaneously of which basket-plane collisions and injuries of various kinds, i.a. including possible contacts with aircraft propellers [13]. There is also a whole range of possible work-related illnesses: discomfort or diseases of the musculoskeletal system, danger of severe frostbite due to weather-related effects of cold, snow, rain and freezing rain, noise and vibration induced diseases and others. A research report [10] provides an overview of the current state of research and the results of ergonomic/human factors studies in de-icing. Of the 22 tasks performed in open-basket de-icing, the physically fatiguing [10, 14] ones were identified and analyzed by Le Floch, et al. [15]. Time and motion studies of aircraft de-icing work were reported in Landau, et al. [16]. Energy turnover for each tasks was measured [16] and varied – among some peaks up to 21 kJ/min - between 4 and 13 kJ/min. More details and further information on risks of musculoskeletal disorders are reported in Nadeau, et al.
[17]. From our previous studies, one can conclude that open- basket de-icing work can be improved [18]. More precisely, more attention should be paid to work design and work organisation when spraying anti-icing and de-icing fluids, performing ground control and moving the basket and truck [15].
Consequences for Heart Rate Measurements
When it comes to de-icing, one must notice that we are dealing with a large number of possible influencing factors. The most important are:
- Type, severity and difficulty of tasks,
- Weather conditions,
- Other conditions of the physico-chemical working environment,
- Work organisation, in particular shift allocation,
- Type and number of aircraft per time unit,
- Operators’ characteristics, skills and abilities,
- Hormonal disturbances or stimulus conducting processes.
The number of factors influencing the heart rate is therefore large. Sammito, et al. [7] list a total of 17 major factors influencing heart rate and heart rate variability. They range from chronic alcohol consumption to the human circadian rhythm. If heart rate is to be interpreted in terms of workload, great caution is therefore required. Not all influencing factors mentioned in Sammito, et al. [7] are relevant for our study. Table 1 shows the main influencing factors. In field work, controlling all variables is difficult. In some cases, the sample sizes were too small to be able to apply statistical testing methods sensibly. Severe weather conditions and organizational changes were drawbacks for our initial sampling plan.
| Effect on Heart Rate | In Case of Deicing | |
|---|---|---|
| Respiration | Respiratory sinus arrhythmia | Respiration strongly dependent on psycho-physical stress and weather conditions |
| Physical performance | Endurance training reduces the resting heart rate and lowers the rate of increase during physical exertion [19-22] | Physical performance of the operator is instrumental in determining performance during de-icing, stress, fatigue and recovery |
| Gender | Increased parasympathetic activity in women. Resting heart rate and slope under load higher for women than for men [19-22] | To be considered for the two female operators (04 and 06 ) |
| Cold | Low ambient temperatures lead to an increase in heart rate [23] | Adaptation to cold to be considered |
| Body Fat Content / Body Weight | Higher free fat mass and higher BMI often increase the resting heart rate. The angle of rise of the heart rate curve over load duration and load level becomes larger [19-22] | For operators 03, 010 to consider |
| Noise | Heart rate may increase with noise, but study situation inconsistent [7] | Noise influence is present in all cases (aural - despite hearing protection - and non-aural effects possible, but not further discussed due to lack of scientific evidence) |
| Age | With age the resting heart rate and the maximum heart rate drop [7] | To be considered for the two subsamples (i.e. Age between 20 and 26 years) |
| Age | With age the resting heart rate and the maximum heart rate drop [7] | (01, 03, 04, 05, 06, 07, 09), age over 40 (02, 08, 010, 011)) |
| Pollutants | Influences on the cardiovascular balance are proven, but statements on the heart rate during shift-oriented exposure are inconsistent [24] | Pollutant influences (liquid, gaseous) are present during the entire shift |
| Shift work and circadian rhythm | Years of shift work are correlated with cardiovascular diseases. Short-term effects inconsistent [25] | Influences of shift work are present for all operators |
| Mental/emotional tension | Increase of resting heart rate and slope of heart rate under load well secured [7] | Mental and emotional tension are present for critical tasks |
Table 1: Factors influencing the individual heart rate.
On the basis of the measurement data we examined the following questions:
- Are there trendy results when considering all operator studies?
- Does the type of the operator activities have significant impact on Working Heart Rate (WHR), Heart Rate Reserve (HRR) and Absolute Cardiac Cost (ACC)?
- Does the sequence of activities during each study influence WHR, HRR and ACC?
- Are there (linear) trends in heart rate frequency indicating central fatigue?
- Given the large number of influencing variables (see above), are heart rate field studies at all suitable for evaluating a relatively?
State of Research
The heart rate frequency as an indicator of psycho- physical stress has long been known, well established in ergonomics and occupational physiology [1, 2, 20, 21]. The heart rate responds primarily to dynamic work, static holding work, forced postures, psychological stress and thermal influences.
For the de-icing activity, as for other working activities, some interesting cardiac outputs are:
- The course of heart rate frequency,
- The rise of the heart rate above the resting heart rate and the quantities derived therefrom, such as the absolute cardiac cost (ACC),
- The possible exceedance of recognized permanent occupational exposure limits and their consequences for the long-term health of workers [26].
• Heart rate variability is a result of the superimposition of different sources of variation which are systemized [3, 7, 24, 25]. Certain influences on the variation of the heart rate frequency, for example age, gender or physical- chemical environmental conditions, are discussed in Vogt, et al. [4], Nardolillo, et al. [27]. A separation of the load-related individual components of the heart rate is usually only possible under controlled (lab-) conditions, but rarely in field studies.
Working Heart Rate and Heart Rate at Rest
To eliminate part of these different influences in field studies, it is advisable to deal with the heart rate increase or the working heart rate (WHR).The working heart rate is the difference between the current heart rate and the heart rate at rest:
WHR (t) = HR (t) – HRrest
Resting heart rate is usually determined prior to a strain study in a break or lab room. However, for organizational and safety reasons, it is not always possible to measure the resting heart rate prior to the start of the data collection. In those cases, one can use the minimum heart rate value of each participant during the study as a resting value.
Depending on the posture adopted, the continuous endurance limits are determined. The amount of workload to be handled without increasing fatigue (i.e., a steady-state condition) is referred to as a continuous endurance limit [28]. If the load exceeds this steady- state value, fatigue progresses. The maximum endurance limit is defined in ergonomics as the highest possible performance, which can be provided over a whole working day without additional rest periods.
When measuring heart rate at rest, the participant can lie, sit or stand. If the resting heart rate is measured while lying down, one assumes an energetic continuous endurance limit of 40 beats per minute [20]. If the resting heart rate frequency is measured while sitting, the continuous power limit is 35 beats per minute, while standing, 30 beat per minute. All values refer to an 8-hour shift. These limits are only to be considered as rough reference points, as the physical characteristics and training state of the person influence the continuous endurance limit.
A largely linear relation exists between heart rate and oxygen consumption [19, 29]. Thus, endurance limits correspond to work energy rates of approximately 17 kJ / min in males and 12 kJ / min in females.
Heart Rate Reserve
The heart rate reserve (HRR) is sometimes calculated instead of the WHR [22]. HRR is a validated objective measure of the balance between the work demands and resources of the worker (“Karvonen formula”) [5].
$$ H R r e s e r v e = \frac {H R w o r k - H R r e s t}{H R \max - H R r e s t}. 1 0 0 $$ The physical strain is then expressed with the current heart rate as a percentage of the HRR. As confirmed knowledge, the threshold of 33% HRR is used for the maximum energetic load during an 8-hour workday [30]. Working below this threshold will most likely lead to a healthy balance between work demands and physical resources. Meanwhile, exceeding the threshold will result in fatigue and exhaustion in many workers.
Absolute Cardiac Cost
Related to WHR and HRR is the calculation of the absolute cardiac cost (ACC): beats per min above resting heart rate (RHR):
ACCi = HRi-RHR
HRi is the heart rate averaged over a certain period of time. It makes sense to average over the respective operator activities i.
Frimat, et al. [6] has defined the following range limits of ACCi (Table 2):
| Intensity of Work | |
|---|---|
| 0=ACC<10 | Very light |
| 10<=ACC<20 | Light |
| 20<=ACC<30 | Moderate |
| 30<=ACC<40 | Rather heavy |
| 40<=ACC<50 | Heavy |
| 50<=ACC<60 | Very heavy |
| 60<=ACC<70 | Intense |
Table 2: Absolute cardiac cost and intensity of work.
ACC thus differs only slightly from WHR. While we related WHR to the instantaneous heart rates f(t), we calculate ACC for the individual operator activities. For WHR we determine the exceeding of energetic continuous endurance limits. For ACC, on the other hand, we perform a classification according to Frimat range limits.
Relative Cardiac Cost
Besides the absolute cardiac cost one can also compute relative values. It is useful to refer to the 99th percentile of the frequency distribution of the heart rate frequency [31]. This means that the peak stress of one percent of the heart rate frequency is ignored. Relative cardiac cost according to the Karvonen formula mentioned above is a percentage value with Meunier [31]:
$$ R C C _ {99 \%} = H R _ {99 \%} - \frac {H R _ {rest}}{H R _ {\max} - H R _ {re}} $$ [ ] 99% 99% max *100 % rest rest HRmax is calculated according to Astrand, et al. [26] to HRmax = 220-age±10% where “age” is the age of the subject. There are approaches to improve this simple formula, but they have not always been successful [32]:
HRmax = 207-0.7*age
The continuous endurance limit of RCC is stated by various authors as follows (Table 3)
| Continuous endurance limit | |
|---|---|
| Monod [21] | 50 % for a maximum of 30 minutes |
| INRS [33] | 60 % for a maximum of 5 minutes |
| Boudet, et al. [23] | 80 % must not be exceeded |
Table 3: Continuous endurance limit according to different source.
Recovery Heart Rate
The recovery heart rate can also be used as an indicator of previous exercise. It characterizes the recovery ability of the cardiovascular and metabolic system. It decreases exponentially after the end of exertion. However, since the employees continued to work after our measurement intervals and no rest phase occurred, we did not evaluate the recovery heart rate in our study.
Materials and Methods1
In this study we focus solely on the suitability of different evaluation models for heart rate. The influences of aircraft type and meteorological conditions are discussed in Nadeau, et al. [10]. We used Hexoskin smart shirts (https://www. hexoskin.com/pages/health-research) to collect cardiac output of 12 open-basket de-icing technicians at a Canadian airport during the winter of 2016-2017. These vests were adjusted to the size of each participant and worn directly in contact with the skin.
The test subjects worked in two shift systems (Table 4).
| Shifts | Participants |
|---|---|
| Day shift (5h-14h) | 01, 05, 06, 07, 08, 09, 010, 011 |
| Evening shift (14h-23h) | 02, 03, 04, 014 |
Table 4: Shifts observed.
The personal characteristics of the participants are compiled in Table 5 [10, 16].
| Sex | Number | Age (years) | Weight (kg) | Stature (m) | ||||||
|---|---|---|---|---|---|---|---|---|---|---|
| Mean | Min | Max | Mean | Min | Max | Mean | Min | Max | ||
| Male | 10 | 33 | 21 | 54 | 81.1 | 68 | 90.7 | 1.83 | 1.64 | 1.95 |
| Female | 2 | 24 | 56.5 | 52 | 61 | 1.64 | 1.57 | 1.7 |
Table 5: Participants data.
As many factors influence cardiac output in de-icing activities, work processes were documented in terms of content and video-supported [16] by three cameras. The value of the heart rate is updated every second with Hexoskin shirts. The heart rate was read and displayed together with the operator’s activities and the related aircraft type in time- dependent Excel sheets. We skipped on average the first 30 minutes of heart rate measurements to discard the possible initial emotional adaptive reactions of the participants This field study and data collection are detailed in Nadeau, et al.
[10]; Landau, et al. [16]. Briefly, participants were observed for 59 to 96 minutes, of which 13 to 58 minutes were de- icing activities performed in open-baskets, the main focus of this study. 36,720s of data were collected. Due to irregular weather and working conditions one of the 12 participants’ data could not be collected in a useful way, resting a data size of 25,711. The individual data of the participants have different weights. The reasons for the different data sizes are mainly in the very different (and challenging) weather conditions, but also in organizational conditions (Table 6).
| Subject | O1 | O2 | O3 | O4 | O5 | O6 | O7 | O8 | O9 | O10 | O11 | Total |
|---|---|---|---|---|---|---|---|---|---|---|---|---|
| Sample size | 1,238 | 3,671 | 2,156 | 2,534 | 3,462 | 802 | 2,669 | 3,036 | 1,926 | 1,796 | 2,421 | 25,711 |
Table 6: Sample sizes.
Table 7 presents the 22 tasks included in open-basket de- icing activities:
| Task | N° | Task | |
|---|---|---|---|
| 1 | Raise basket | 12 | Put away type-4 spray gun |
| 2 | Wait time in basket | 13 | Move basket laterally |
| 3 | Unidentified task | 14 | Enter basket |
| 4 | Drive truck (included 5 and 6 below) | 15 | Exit basket |
| 5 | Advance truck (from within basket) | 16 | Lower basket |
| 6 | Back truck (from within basket) | 17 | Tactile control |
| 7 | Spray type-1 fluid (deicing) | 18 | Special ground control (outside of basket) |
| 8 | Take out type-1 spray gun | 19 | Radio contact |
| 9 | Put away the type-1 spray gun | 20 | Supplementary tasks |
| 10 | Spray type-4 fluid (anti-icing) | 21 | Visual control |
| 11 | Take out type-4 spray gun | 22 | Enter data on flat screen |
Table 7: List and numerical code of the 22, observable open-basket tasks presented in the research of Landau, et al. [16].
1 Our methods were duly approved by the ethics committee for research with human participants of École de technologie supérieure
The “unidentified tasks” are those that could not be identified using the video recordings, either due to poor visibility or poor viewing angle. The “supplementary tasks” are those performed individually; they are either non- representative of the actual de-icing activity, or too rare to base general conclusions for the entire group of participants. The “special ground control” task is performed outside of the basket, thus beyond the camera’s scope and is intended to assess the quality of de-icing at ground level. Radio contact as well as visual control were not coded as the observation of these tasks are also difficult in normal de-icing conditions.
Using the recordings and the identification of the tasks of Table 7 deicing activity was divided chronologically at approximately one-second intervals.
Results
Heart Rate and Test Subjects
Working Heart Rate (WHR): The following box plot diagram shows the frequency distributions of working heart rate WHR (Figure 1).
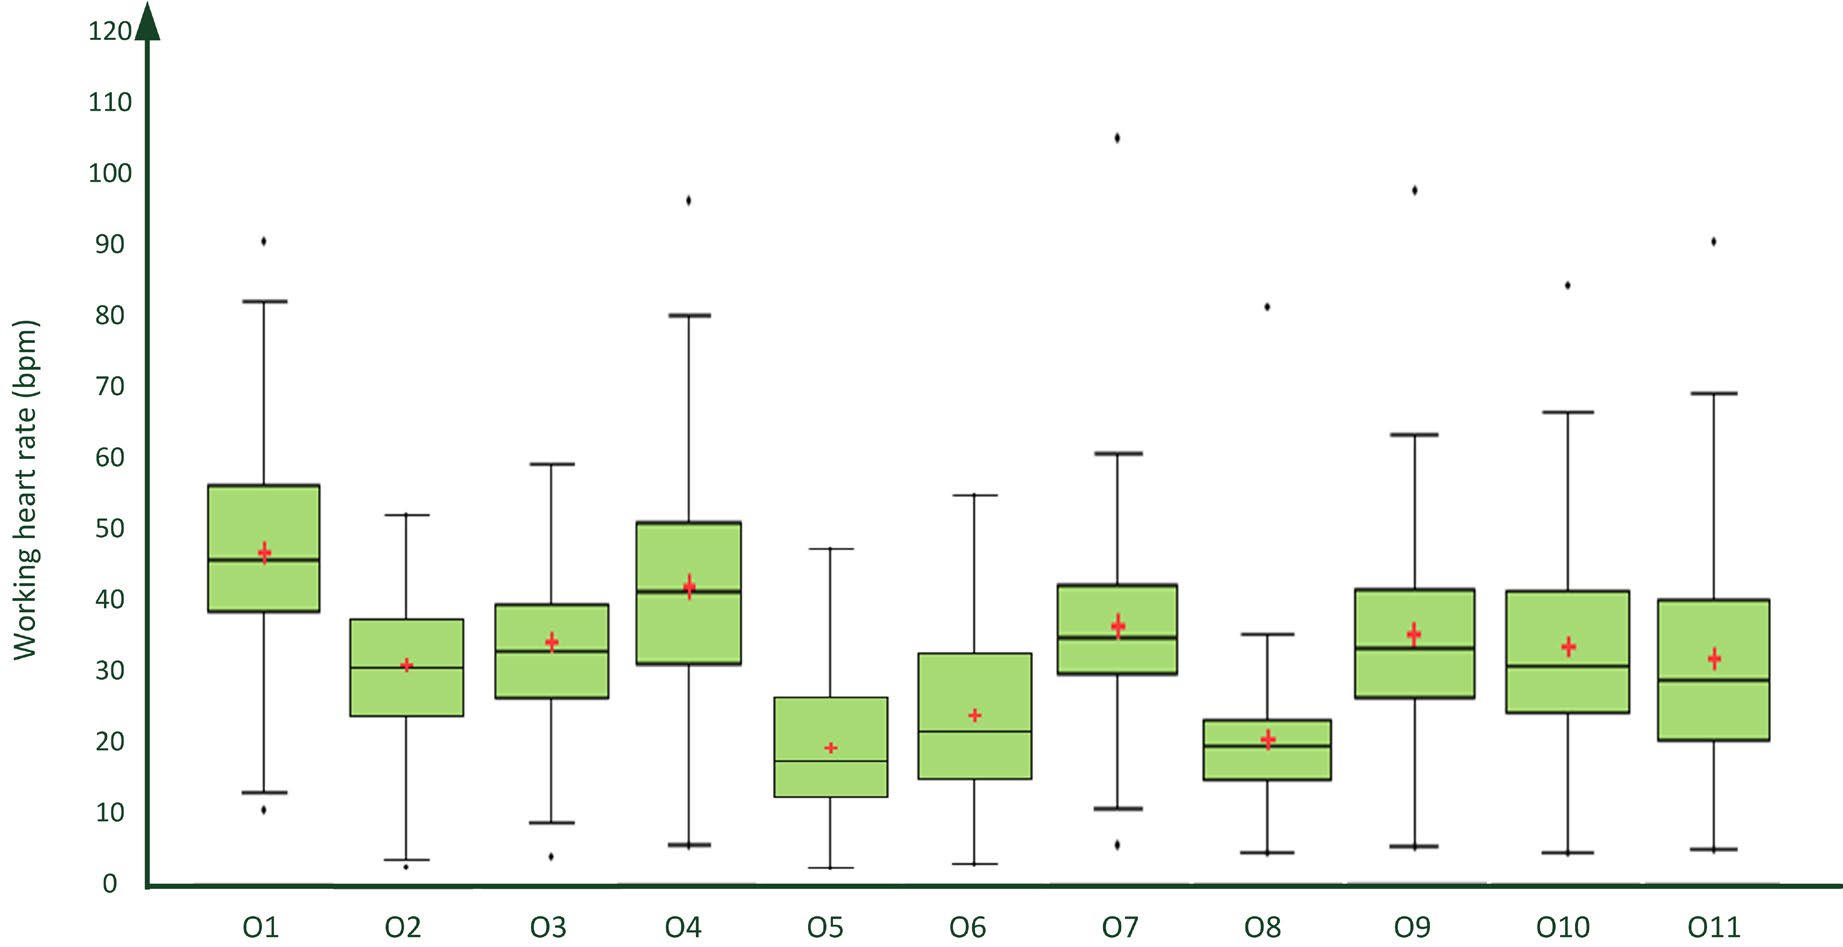
Arithmetic mean is between 16.9 and 45.0 bpm for samples O1 to O11, for the whole data set 28,95±12,28 bpm. O1 and O4 have the highest mean; O5, O6 and O8 have the lowest mean of working heart rate.
We calculated the working heart rate frequency and tested for transgression of the threshold 35 bpm. Tab 8 shows the number of exceedances WHR >= 35 bpm [19, 20] for the individual probands. For O1, O4 and O7 it is likely that the 35 limit value is often exceeded during the shift. Of course, physical fatigue or even cardiovascular damage cannot yet be inferred from this. Short-term exceeding of the limit values can be compensated by a subsequent recovery phase.
| 01 | 02 | 03 | 04* | 05 | 06* | 07 | 08 | 09 | 010 | 011 | Total | |
|---|---|---|---|---|---|---|---|---|---|---|---|---|
| No. observations | 1,238 | 3,671 | 969 | 2,534 | 3,462 | 802 | 2,669 | 3,036 | 1,926 | 1,796 | 2,421 | 25,711 |
| No. of observations with high aerobic load (WHR >= 35 bpm) | 729 | 1,076 | 969 | 1,619 | 144 | 59 | 1,233 | 102 | 560 | 452 | 574 | 7,473 |
| Percentage | 58.9 | 29.3 | 44.9 | 63.9 | 4.2 | 7.4 | 46.2 | 3.4 | 29.1 | 25.2 | 23.7 | Mean 30.6 |
Table 8: Observations with high aerobic load with respect to WHR. *O4 and O6 are female.
On average, in about 30.4 % of cases, the threshold 35 bpm is exceeded. Noteworthy is the large fluctuation range (from 3.4 % up to 63.9 %) in the individual experiments.
Heart Rate Reserve (HRR): Arithmetic mean is between
0.206 and 0.573 for samples O1 to O11, for the whole data set 0.372 ±0.158. The following box plot diagram shows the frequency distributions of heart rate reserve HRR (Figure 2).
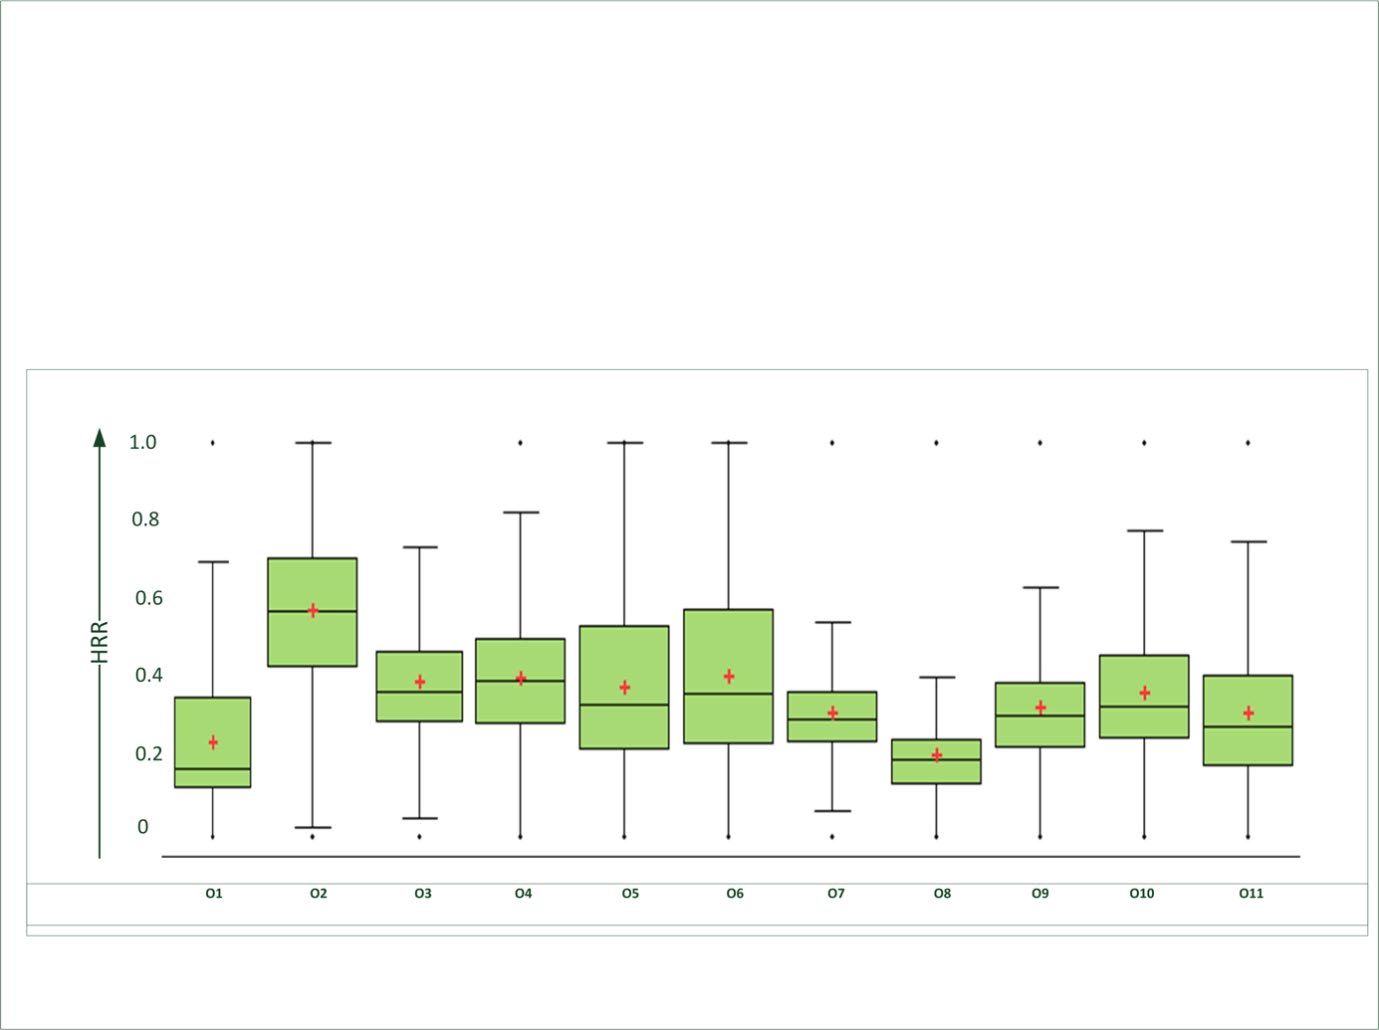
13,725 out of 25,711 observations (=55.99 %) show high aerobic load with respect to HRR (Table 9). Again, there is the large fluctuation range (from 8.2 % up to 95.8 %) in the individual samples.
| Subject | O1 | O2 | O3 | O4* | O5 | O6* | O7 | O8 | O9 | O10 | O11 | Total |
|---|---|---|---|---|---|---|---|---|---|---|---|---|
| No. observations | 1,238 | 3,671 | 2,156 | 2,534 | 3,462 | 802 | 2,669 | 3,036 | 1,926 | 1,796 | 2,421 | 25,711 |
| No. of observations with high aerobic load (HRR>= 33 %) | 967 | 3515 | 1318 | 1679 | 1839 | 463 | 1040 | 249 | 804 | 881 | 970 | 13,725 |
| Percentage | 78.1 | 95.8 | 61.1 | 66.3 | 53.1 | 58.4 | 39 | 8.2 | 41.7 | 49.1 | 40.1 | Mean 53,7 |
Table 9: Observations with high aerobic load with respect to HRR. *O4 and O6 are female. Critical exceedances are found for O1, O
Absolute Cardiac Cost (ACC): Figure 3 shows that mean values of the ACC are in the light to moderate range of the physical strain (according to the Frimat-classification) [6]. Of course, it should be borne in mind that the averaging process compensates for phases of high physical stress by means of periods of lower stress. From the point of view of organizational work design, this is desirable. Table 10 below, however, refers to ACC peak values that are occurring regularly in the workflow.
![Figure 3: Mean ACC-values with Frimat-classification [6]-peak values are averaging out. ACC-results are partly consistent with the assessments of the HRR evaluation.](/fulltextimages/6335/fig_3.jpeg)
Table 10 show the percentages of measurements in studies O1 to O11 exceeding the respective limit values. The HRR and ACC long-term exposure limit values are exceeded in about 43 % of all cases. In contrast, in the case of the WHR, only 29.3 % exceedances (O1, O3, O4, O7) are present. HRR and ACC therefore lead to the more cautious limit values. It should be noted that O1 and O11 were exposed to exceptional meteorological conditions.
| 01 | 02 | 03 | 04* | 05 | 06* | 07 | 08 | 09 | 010 | 011 | Mean | |
|---|---|---|---|---|---|---|---|---|---|---|---|---|
| Percentage above WHR >= 35 min-1 | 58.9 | 29.3 | 44.9 | 63.9 | 4.2 | 7.4 | 46.2 | 3.4 | 29.1 | 25.2 | 23.7 | 30.6 |
| Percentage above HRR >=33% | 78.1 | 95.8 | 61.1 | 66.3 | 53.1 | 58.4 | 39 | 8.2 | 41.7 | 49.1 | 40.1 | 53.7 |
| Percentage ACC “rather heavy” ...”intense” | 75.4 | 48.9 | 61.2 | 74.7 | 10.6 | 18.9 | 64.7 | 6.1 | 46.1 | 38.7 | 34.9 | 43.6 |
Table 10: Comparison of thresholds WHR, HRR, and ACC. *O4 and O6 are female.
The large discrepancies between instruments at subjects O2, O5, and O6 are particularly noticeable. The HRR becomes so high because the denominator of HRR (HRmax–HRmin) is low. Possible reasons for this could be:
- Test subjects have only a limited maximum capacity of heart rate frequency,
- During the relevant studies only less demanding activities were carried out,
- The mode of operation of these subjects is very economical.
It is therefore clear that it makes sense to look at the average values of characteristic values of the working heart rate if one wants to check whether the cardiovascular system is in balance in the long term. If, on the other hand, one discusses the percentage values for exceeding threshold values, then this is a statement about stress/strain peaks during the shift.
Heart rate and activities: As it was shown above that HRR and ACC are particularly cautious measures of physical exertion, we limit our discussion of the activities to their analysis. Table 11 shows the statistical analysis of HRR and ACC for deicing activities.
| Activity | Missing values | HRR>33% | ACC “rather heavy” ….”intense | ||
|---|---|---|---|---|---|
| Mean | Standard deviation | Mean | Standard deviation | ||
| raise basket | 0 | 39.9 | 14.3 | 27.3 | 8.5 |
| wait time in basket | 0 | 36.7 | 18.9 | 24.4 | 11.5 |
| unident. Task | 7 | 11.3 | 17.5 | 30.2 | 13.9 |
| drive truck | 7 | 20.8 | 30.5 | 33.4 | 15.9 |
| advance truck | 2 | 22.3 | 12.7 | 23.7 | 13.8 |
| back truck | 2 | 26.3 | 14.3 | 26 | 13.3 |
| spray type 1 | 0 | 43.8 | 15 | 29.5 | 5.5 |
| take out type 1 spray gun | 2 | 25.4 | 19.9 | 27.6 | 19.3 |
| put away type 1 spray gun | 2 | 29.7 | 23 | 28.9 | 13.9 |
| spray type 4 | 3 | 33.4 | 32.7 | 33.9 | 16.5 |
| take out type 4 gun | 4 | 18.3 | 21 | 32.7 | 19.7 |
| put away type 4 gun | 4 | 20.6 | 27.2 | 30.5 | 15.7 |
| move basket laterally | 0 | 38.1 | 11.4 | 26.1 | 8.4 |
| enter basket | 4 | 34.2 | 30.3 | 45.4 | 23.4 |
| exit basket | 6 | 13.3 | 18.8 | 28.2 | 17.3 |
| lower basket | 1 | 31.6 | 11.5 | 26.3 | 7 |
| tactile contrôle | 0 | 33.2 | 13.5 | 24.8 | 6.6 |
| ground control | 5 | 30.5 | 27.9 | 40.5 | 20.9 |
| radio contact | 1 | 31 | 11.8 | 27.2 | 11.7 |
| suppl task | 7 | 9.9 | 16.7 | 27.2 | 13 |
| visual control | 9 | -3.9 | -12.1 | -44.7 | -13.4 |
| enter data on flat screen | 9 | -3.3 | -9.9 | -9.4 | -2.8 |
Table 11: Compilation of activities with high physical workload (HRR>0,33 (%) and ACC “rather heavy”intense, 11 operators, n=25,71
The following activities lead to high HRR/ACC values (Table 12):
| High HRR Values | Type of Work |
|---|---|
| Enter basket | physical |
| Wait time in basket | emotional |
| Spray Type 1 | physical+informative |
| Spray Type 4 | physical+informative |
| Move basket laterally | physical+informative |
| Enter basket | physical |
| Lower basket | physical+informative |
| Tactile contrôle | physical+informative |
| Ground contrôle | physical+informative |
| Radio contact | informative+emotional |
| Drive truck | physical+informative |
| Sample | Linear Trend Equation |
| O1 | 101.2 – 0.010*t |
| O2 | 104.2 – 0.003*t |
| O3 | 86.9 + 0.003*t |
| O4* | 89.4 + 0.001*t |
| O5 | 101.9 – 0.002*t |
| O6* | 85.9 + 0.010*t |
| O7 | 80.7 + 0.003*t |
| O8 | 75.4 + 0.001*t |
| O9 | 93.9 + 0.002*t |
| O10 | 80.3 + 0.004*t |
| O11 | 77.7 + 0.001*t |
Table 12: High HRR-values and type of work.
In most cases, these are activities that lead to a superposition of forced postures and dynamic use of the upper body. Informational and emotional strain also plays a role. Even during visual inspection (e.g. tactile control), the operator must bend forward strongly and steer the basket sideways at the same time.
In Table 11 there is only a partial overlap between high HRR and high ACC levels. There is a case for using the HRR measure rather than the ACC measure, when considered cautiously (protecting the employee).
Fatigue over the Shift Time
Linear trends were calculated for the time-dependent heartrate over the working shift. From a (possible) increase of the trend lines, the central fatigue of the operator can be assumed [1].
For the absolute value of the heart rate, the equations for a linear trend were determined (Table 13).
It turns out that with the exception of O1, O2 and O5, a positive increase in the heart rate can be assumed, i.e. that we can assume increases in central fatigue.
Operator Workload Derived from Shift Characteristics
Parameters of heart rate and limit criteria were discussed with respect to operator workload (OW) (Table 14).
We have tentatively defined:
. . * No of aircraft during observation period OW No operatorsin shifts observationtime = Table 14 shows operator workload OW for the individual test subjects.
| 01 | 02 | 03 | 04* | 05 | 06* | 07 | 08 | 09 | 010 | 011 | |
|---|---|---|---|---|---|---|---|---|---|---|---|
| No. aircraft | 4 | 5 | 4 | 6 | 6 | 4 | 7 | 8 | 7 | 6 | 10 |
| Mean No. operators | 4 | 3.8 | 3.4 | 3.3 | 4 | 3.5 | 3.2 | 3.9 | 3.5 | 4 | 3.9 |
| Observation time [h] | 0.34 | 1.02 | 0.6 | 0.7 | 0.96 | 0.22 | 0.74 | 0.84 | 0.54 | 0.5 | 0.67 |
| OW | 2.91 | 1.29 | 1.96 | 2.58 | 1.56 | 5.13 | 2.95 | 2.43 | 3.74 | 3.01 | 3.81 |
Table 13: Correlation coefficients (Pearson) between operator workload (OW) and variables indication exceeding strain limits.
If one checks for the correlations of high cardiovascular strain (ACC: rather heavy ...intense, HRR>33%, WHR>35 [min-1]) with OW, negative correlation coefficients are obtained (Table 15) (All three variables are normally distributed (Shapiro-Wilk-test, ρACC = 0.0509; ρHRR = 0.906; ρWHR = 0.423)).
| Correlation coefficient (Pearson) | t-statistic | p | |
|---|---|---|---|
| Percentage ACC “rather heavy” ...”intense” | -0.123 | 0.374 | 0.717 |
| Percentage HRR>=33% | -0.277 | 0.864 | 0.41 |
| Percentage WHR >= 35 | -0.141 | 0.428 | 0.679 |
Table 14: Correlation coefficients (Pearson) between operator workload (OW) and variables indication exceeding strain limits.
These non-significant results indicate that the number of aircraft in the shift and the number of operators available cannot be used to draw conclusions on operator strain. Other variables, such as weather, process organisation, quality of the shift crew, etc., obviously play a major role.
Discussion
For 11 deicing operators a total of 429 minutes of heart rate recordings were available for evaluation. Three different evaluation measures were determined from the raw data of the heart rate: WHR, HRR and ACC. The arithmetic mean values of these measures were compared, as well as the limit criteria WHR > 35 bpm, > 33 % HRR and ACC “rather heavy ...intense”. The working heart rate was 28.95 bpm 12.28 bpm on average. This value also corresponds to the ACC mean value. The mean value for HRR was calculated as 0.372±0.16.
The HRR and ACC long-term exposure limit values are exceeded in about 43 % of all cases. In contrast, in the case of WHR, only 30.6 % exceedances are present. As expected, there were strong differences between the operators. They are due to different cardio-vascular capacities, but even more to the different workloads and physical environment situations. Among other things, the type and volume of air- traffic, weather, composition of the shift crews and individual working methods play a role here. If one is looking for a limit criteria that aim at the long-term sustainability of the work, HRR or ACC would be preferable.
Looking at the activities
- Enter basket
- Spray type 4
- Spray type 1
- Ground control
- Visual control
- Drive truck show the highest ACC values. They are caused, among other things, by stress superposition of strenuous postures, emotional tension and heavy dynamic work. This superposition would be acceptable if a change in load with a recovery effect followed. In practice, however, a change of load with a recovery effect occurs rather rarely. A recovery with the return of the heart rate to the resting value is only possible with a time delay while waiting in the truck for the next operation. The consideration of the (linear) trend equations heart rate over time indicates increases over the shift time in 8 of 11 cases. Thus, fatigue effects occur which are not compensated by work breaks.
The derivation of an operator workload (OW) from the number of aircraft and the number of operators in the shift shows negative correlations for the mean values as well as for the limit criteria of WHR, HRR and ACC. These results indicate that the number of aircraft in the shift and the number of operators available cannot be used to draw conclusions on operator strain. Other variables, such as weather, process organization, quality of the shift crew etc. play a major role.
Conclusion
Plane deicing needs to be performed safely and with the highest standards of quality and reliability. Open-basket deicing activities have been studied and physical strain estimated as light to moderate. WHR, RHR and ACC do not behave uniformly for the majority of participants. In the interest of protecting employees, it seems to make sense to use HRR or ACC as parameters instead of WHR. Activities with high physical, informative and possibly also emotional components have an effect on the heart rate. Superimposed activities (e.g. special ground control: heavy dynamic work plus inspection) have a significant effect on heart rate increases. After strenuous activities, some recovery effects were observed. For the majority of participants, fatigue- related increases in heart rate are observed.
In field studies with a large number of influencing variables on the heart rate, it is usually not sufficient to consider one single evaluation measure like WHR. If time series analyses are carried out, in addition to the course of the heart rate frequency, the other load parameters must also be plotted, i.e. a polygraphic measurement and evaluation concept must be followed. A separation of the load-related individual components of the heart rate is usually only possible under controlled (lab-) conditions, but rarely in field studies with an extensive number of workload parameters.
Meteorological conditions have an important effect on deicing technicians’ strain. The number of aircrafts in a shift and the number of operators involved cannot be used to draw conclusions on deicing technicians’ strain.
Similar studies need to be conducted in other aircraft deicing facilities to improve the generalization of these findings.
Acknowledgment
The authors would like to acknowledge the contributions of Mrs Le Floch and Prof Morency for the data collection of this field work, as well as École de technologie supérieure (ÉTS) and Natural Sciences and Engineering Research Council of Canada (NSERC).
Conflict of Interest
No conflict of interest was reported by the authors.
References
-
Monod H (1967) La validité des mesures de fréquence cardiaque en ergonomie. Ergonomics 10(5): 485-537.
-
(1971) Ergonomics Guide to Assessment of Metabolic and Cardiac Costs of Physical Work. American Industrial Hygiene Association Journal 32(8): 560-564.
-
Rohmert W, Laurig W, Philipp U, Luczak H (1973) Heart Rate Variability and Work-Load Measurement. Ergonomics 16(1): 33-44.
-
Vogt JJ, Meyer-Schwetz M Th, Metz B, Foehe R (1973) Motor, Thermal and Sensory Factors in Heart Rate Variation: A Methodology for Indirect Estimation of Intermittent Muscular Work and Environmental Heat Loads. Ergonomics 16(1): 45-60.
-
Karvonen J, Vourimaa T (1988) Heart Rate and Exercise Intensity during Sport Activities. Sports Med 5(5): 303- 311.
-
Frimat P, Chamoux A, De Gaudemaris R, Cantinaux A, Amphoux M (1989) Heart rate and work. What use? What criteria? I.N.R.S Archives des maladies professionnelles 50(4): 357-360.
-
Sammito S, Thielmann B, Klussmann A, Weippert M, Boeckelmann I (2014) Guideline detail view: Use of the heart rate and heart rate variability in occupational medicine and ergonomics. AWMF online No. 002/042.
-
Canadian Aviation Safety Board (1995) Aviation investigation report A95Q0015. Collision with Royal Air Maroc Boeing 747-400 CN-RGA, Montreal/ Mirabel International Airport (Quebec), Transportation Safety Board of Canada, pp: 28.
-
Brown AP (2011) Aircraft performance degradation- the effects of inflight icing upon lift, drag and propulsive efficiency. SAE Technical papers.
-
Nadeau S, Le Floch T, Morency F, Landau K (2017) Ergonomics of aeronautical de-icing in open nacelles. Electronic master’s thesis, École de technologie supérieure, Montréal.
-
Goraj Z (2004) An overview of the deicing and antiicing technologies with prospects for the future. 24th Int Congr Aeronautical Sciences.
-
Nadeau S, Morency F (2017) De-icing of Aircraft: Incorporating Business Risks and Occupational Health and Safety. International Journal of Safety and Security Engineering 7(2): 247-266.
-
Landau K, Nadeau S, Le Floch T, Morency F (2018) Work processes and contributions to added value in aircraft de- icing. Spring Congress, GFA press, Frankfurt, Germany.
-
Le Floch T, Nadeau S, Landau K, Morency F (2018) Aircraft Deicing in Open Baskets: Study of the Effects of Activities on Heart Rate Variability. Spring Congress, GFA press, Frankfurt, Germany.
-
Le Floch T, Nadeau S, Morency F, Landau K (2020) Identification of Physically Fatiguing Tasks Performed During Aircraft Open-Basket Ground Deicing Activities. Work: A Journal of Prevention, Assessment & Rehabilitation.
-
Landau K, Nadeau S, Le Floch T, Morency F (2017) Ergonomic Time and Motion Studies of Aircraft De-icing Work. Journal of Ergonomics 7(4): 204.
-
Nadeau S, Salmanzadeh H, Ahmadi M, Landau K (2019) Aviation Deicing Workers, Global Risk Assessment of Musculoskeletal Injuries. Int J Industrial Ergonomics 71: 8-13.
-
Torres Y, Nadeau S, Morency F (2016) Study of Fatigue and Workload among Aircraft De-icing Technicians. Occupational Ergonomics 13(2): 79-90.
-
Spitzer A, Hettinger Th, Kaminsky G (1982) Charts for calorie expenditure during physical work, 6th (Edn.), Beuth, Berlin.
-
Mueller EA (1961) Physical fatigue. In: Baader WE, (Ed.), Handbook of Entire Occupational Medicine, Urban & Schwarzenberg, Berlin 1: 405-441.
-
Monod H, Kapitaniak B (2003) Ergonomie, 2nd (Edn.), Unitheque, Masson, Paris.
-
Rodahl K (1989) The physiology of work. Taylor &Francis, London, pp: 296.
-
Boudet G, Chamoux A, Dutheil F (2018) L’astreinte cardiaque est individuelle et doit être évaluée. Archives des Maladies Professionnelles et de l’Environnement 79(3): 334.
-
Schneider A (2018) Cardiovascular system. In: Schulz H, Karrasch St, Boelke G, (Eds.), Breathing: Air Pollutants and Health. Position paper of the German Society for Pneumology and Respiratory Medicine eV, Berlin.
-
Stieler L, Hunger B, Rudolf M, Stoll R, Seibt R (2018) 24-hour monitoring of blood pressure and heart rate on a working day and on a day off when working shifts. Health system 80(8-9): 797.
-
Astrand PO, Rodahl K, Dahl HA, Stromme SB (2003) Textbook of Work Physiology: Physiological Bases of Exercise, 4th (Edn.), Champagne III, Human Kinetics.
-
Nardolillo AM, Baghdadi A, Cavuoto LA (2017) Heart Rate Variability During a Simulated Assembly Task; Influence of Age and Gender. Proceedings of the Human Factors and Ergonomics Society 61(1): 1853-1857.
-
Shepard RJ (1978) Human physiological work capacity. Cambridge University Press, Cambridge.
-
Gupta N, Jensen BS, Sogaard K, Carneiro IG, Christiansen CS, et al. (2014) Face Validity of the Single Work Ability Item: Comparison with Objectively Measured Heart Rate Reserve over Several Days. Int J Environ Res Public Health 11(5): 5333-5348.
-
Ilmarinen J (1992) Job Design for the Aged with Regard to the Decline of their Aerobic Capacity: Part 1 -Guidelines for the Practitioner. Int J Ind Ergon 10(1-2): 53-63.
-
Meunier Ph (2011) Les indices de pénibilité et leur analyse.
-
She J, Nakamura H, Makino K, Ohyama Y, Hashimoto H (2015) Selection of Suitable Maximum-heart-rate Formulas for Use with Karvonen Formula to Calculate Exercise Intensity. International Journal of Automation and Computing 12(1): 62-69.
-
INRS (2019) Risques liés à l’activité physique. Institut national de recherche et de securite.
- The Expanding Landscape of Road Rage: A Systematic Review of Conflicts Involving Drivers, Pedestrians, and Micromobility
- Validating Cognitive Models of Royal Navy Performance on Control Systems
- Comparing Standard and State-of-the-art Firefighter Coats on Postural Balance and Gait in a Live Burn Environment
- Investigating the Integration of Telemedicine into Clinicians Workflow: A Review of Methods
- Risk Assessment of Ergonomic Factors in a Textile Firm by RULA, REBA and Fine Kinney Methods
- Impact of Self-Esteem Training on Individuals with Disabilities Aged 17-30