The Effect of Lower Limb Muscle Fatigue on Running Tempo- Spatial Parameters and Joint Excursion in Individuals with Pes Planus
Context: The relation between running kinematics parameters and lower limb muscle fatigue in association with low longitudinal arch (LLA) is not well understood. Objective: The purpose of the present study was to examine the effects of fatigue on running kinematics in Subjects who had a low longitudinal arch. Design: Quasi- Experimental study. Setting: Clinical Biomechanics Laboratory. Participants: forty four subjects were equally divided into two groups, a healthy one and a group with LLA. Main Outcome Measures: The kinematics parameter of running includes tempo-spatial parameters and joint angles, which were calculated by Vicon Nexus 1.8.5 software. A two-way repeated measure ANOVA (group x fatigue) was used to compare the data between the two groups. Results: In the unfatigued conditions, running speed, ankle plantar flexion/ dorsiflexion, and ankle external rotation, knee flexion and hip flexion/extension in the low arch subjects are significantly different than those in the healthy subjects (P
Introduction
Flat feet (pes planus) are one of the most frequent conditions that is observed in adult health practice [1]. Based on previous studies, the prevalence of flat feet is reported to be up to 25% in the general population of different countries [2]. Also, other previous researchers have demonstrated that many factors affect the prevalence of flat foot, some of which are age, gender, weight, race and footwear [3]. Prevalence of pes planus is higher among the Female than Male population, and patients with Flat feet have often shown higher body mass index (BMI) than healthy subjects; they also have larger feet [2].
The most common structural difference in flat feet compared with a healthy one is found to be rear-foot varus, which, in turn, causes excessive pronation of the foot [4]. In addition, deepened navicular cup, widened talus articular surface, proximally faced talus, and higher positioned navicular articular surface can be seen [5]. Abnormal muscle activity might be the cause for the connection between variations in foot posture and increased risk of lower limb injury [6]. For instance, during gait, pes planus most often show more motion compared to normal feet; and therefore, it may be susceptible to injuries mostly in soft tissues that oppose this extra motions [7]. Also, when it comes to EMG, there is ample evidence that planus feet undergo greater EMG activation of invertor musculature and decreased activation of evertor musculature compared to the people who have normal or cavus feet [8]. Furthermore, it has been found out that during gait, the flat-arched foot relies on additional muscular support and that any fatigue caused by exercise in these controlling muscles can result in various injuries such as tibial stress fractures [9].
Besides, research findings on adulthood well indicate that pes planus might also be associated with knee pain, cartilage damage and tibial stress syndrome [10]. Individuals with low- arched feet would suffer from various kinematic alterations, including an increased rear-foot eversion excursion, and increased forefoot plantar flexion and forefoot abduction [2], they also may experience lesser peak forefoot adduction and higher tibial internal rotation [11]. These altered movement patterns were associated with higher injury risk in gait [2]. However, more ambiguous is the association between Flat feet (pes planus) and running kinematics changes.
Previous literature on the problem has referred to many other complications related to flat feet, such as poor postural stability, injuries, pathologies, and discomfort. For minimizing such effects, early detection and appropriate management are necessary [2]. Structural and functional changes of the foot, such as ‘flat feet’, have widely been reported to be the cause of compensatory misalignment and, therefore, mechanical deviations of the entire lower extremity during gait [12, 13]. This fact has also been pinpointed that although Flat feet (FF) rarely causes disability, people with this problem will have to go to pediatric orthopedists, and generally is believed that FF may lead to gait disorders later on [14].
Angular and torsional deformities and FF have been reported to be related to several developmental cases such as joint laxity, muscle strength, walking speed, and physical performance. That being said, it is believed that FF must be considered not only a problem of static alignment of the ankle and foot complex, but also as the dynamic malfunction of the lower extremity [15]. It is also believed that certain other factors, mostly individual, can mediate the development of fatigue. Among them are age (older adults get fatigue faster than young adults), level of physical activity (inactive individuals get fatigue faster than active individuals), and the type of activity that are done [16]. Although it is believed that fatigue and foot type are the most important factors leading to an increase in the risk of lower limb injuries [17], a comprehensive overview and study in which gait kinematics and temporal–spatial parameters and how these parameters are changed by fatigue are taken into account about the people with flat-arched feet is lacking. Nevertheless, it is recommended that three-dimensional analysis of kinematics during gait may be more suitable to study its function and evaluate the degree of deformity [10].
In previous studies, the potential differences in the Kinematics parameter of walking between healthy and low arched feet has specifically been examined [2, 11]. However, to the best of authors’ knowledge, so few published studies have assessed the effect of lower limb muscle fatigue on Tempo-spatial parameters and joint angles in Subjects with low longitudinal arch during running at a self-selected pace.
Methods
Participants
Twenty-two male subjects with low longitudinal arch (LLA) (age = 23.7 ±3.04years) and twenty-two matched healthy ones as the control subjects (age = 24.17 ±2.75years) were studied. This study where quasi-experimental design was administered. The power analysis by G Power 3.1 revealed that for a statistical power of 0.80 at an effect size of 0.80 with an alpha level of 0.05 a sample size of at least 21 subjects was required [18]. Only subjects who had either bilaterally low longitudinal arch were included in the study. According to Williams and McClay, the arch height index (AHI) is calculated by dividing the height of the dorsum by the truncated foot length (heel to first metatarsophalangeal joint). Subjects with an arch ratio of those at most 0.275 were considered to have low longitudinal arch. 20 The study was approved by the Research Ethics Committee of IR.UMSHA. REC.1396.655 and all subjects gave informed consent.
Apparatus
A six -camera motion analysis system was used to capture the kinematics of each participant’s lower limb. Upon using Nexus software, measurement errors of the kinematic evaluations were calculated to be about 0.2 mm. During the measurement process, the cameras were rightly positioned on both sides of the walkway path, which was 18 m along the laboratory, with a distance of 5 meters from the center of the calibrated space. Dimensions of the calibration space were 300×150×200 mm in length, width, and height, respectively. Before entering the calibrated space, the participants were obliged to walk 7 meters, while the calibration frame length allowed full left and right strides to be placed in the calibrated frame. Next, as recommended by the process of measurement, sixteen 25-mm-diameter markers were placed on left and right superior anterior iliac spine, superior posterior iliac spine, thigh, lateral condyle of the knee, shank, lateral malleoli, heel, and second distal metatarsal. Being placed according to Plug-in-Gait Protocol [19], the markers reflected the infrared light toward the cameras to be recorded. Now the subjects were asked to run with a comfortable speed so as to accomplish 5 successful trials the mean values of which were used for each parameter. The data thus gathered were calculated by Vicon Nexus 1.8.5 software and were extracted by Polygon 3.5.1.
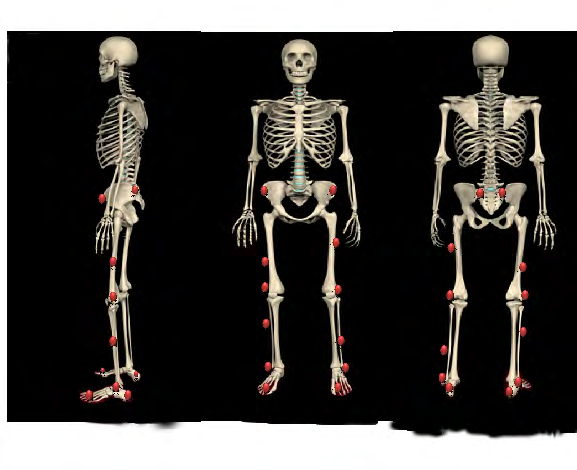
Figur1: Marker placement for plug-in gait lower body models (anterior, posterior and lateral view).
Task and Procedure
The next step was to induce the fatigue protocol for which the subjects used a bicycle ergometer. Before that, they were asked to do a five-minute warm-up followed by some stretching exercises. The fatigue protocol was induced by gradually increasing the intensity during the exercise period on the bicycle ergometer (Monark Ergomedic 839 E; Monark Exercise AB, Vansbro, Sweden), which started at 50W with the work rate increasing at a rate of 20 W every 1minute until exhaustion was reached. During the process, fatigue severity was assessed by the Borg scale (6=no exertion at all, 20=maximal exertion) for each participant. Moreover, exercise was kept on until it reached a 17 on the Borg scale.
Statistical analysis
Shapiro-Wilk test was used for measuring the normal distribution of the data. For comparing the data within each subject and between the healthy and low arched group for Tempo-spatial parameters and joint angles, a two-way repeated measures analysis of variance ANOVA (group x fatigue) was used. The level of significance was set at P<0.05.
Results
The demographic characteristics of the two groups are summarized in Table 1. No differences were observed between the groups in age, height, and weight (p > 0.05). The normalized criterion of Navi was significant difference between the groups.
| Variables | Groups | Sig. | |
|---|---|---|---|
| Normal | Flat feet | ||
| Age (year) | 24.17 ±2.75 | 23.7 ±3.04 | 0.77 |
| Height (cm) | 178.60±2.88 | 177.11±5.71 | 0.58 |
| Weight (N) | 733.08±35.38 | 754.60±92.97 | 0.63 |
| Navicular drop (mm) | 0.280±0.013 | 0.259±0.017 | 0 |
Table 1: Demographic characteristics, Navicular drop index of study subjects (mean ± SD).
Spatiotemporal variables for the healthy and flat feet groups are presented in Table 2. The average Cadence, Step time, Single support and step length were not significantly different between groups without fatigue condition. The average running speed in the flat feet group was about 20 % less than that in the healthy group without fatigue condition (p=0.022) (Table 2).
| Variables | No Fatigue | Fatigue | P-value (Time) | P-value (Time& group) | P-value (between groups) in Pre-test | P-value (between groups) in Post-test | ||
|---|---|---|---|---|---|---|---|---|
| FF | C | FF | C | Fatigue | Fatigue & group | C- FF | C- FF | |
| Cadence (steps/ minutes) | 169.87±7.65 | 175.88±5.71 | 169.83±8.15 | 171.59±19.37 | 0.625 | 0.631 | 0.17 | 0.832 |
| Step time (s) | 0.397±0.013 | 0.402±0.016 | 0.441±0.034 | 0.392±0.014 | .021* | .001* | 0.59 | .014* |
| Single support (s) | 0.292±0.036 | 0.266±0.029 | 0.292±0.039 | 0.260±0.035 | 0.736 | 0. 736 | 0.209 | 0.167 |
| Step length (m) | 0.787±.148 | 0.914±0.085 | 0.715±0.131 | 0.894±0.074 | 0.066 | 0.273 | 0.133 | 0.027* |
| running speed (m/s) | 2.167±.291 | 2.714±.408 | 1.975±.197 | 2.450±.176 | 0.010* | 0.623 | 0.022* | 0.002* |
Table 2: Tempo-spatial parameters of gait for control and experimental groups (mean ± SD).
Repeated measures ANOVA revealed different effects of fatigue on Step time among subjects. After inducing fatigue, step-time showed minimal changes underneath the stance phase in the healthy group, while increased in the low arch group after fatigue (p =0.021, p =0.014). A significant Group × Time interaction effect was found for Step time (p =0.001).
After reaching the fatigue state, running speed was decreased underneath the stance phase in both groups, respectively (p=0.010, p=0.002). But the Group × Time interaction for running speed was not significant (p=0.623). This was due to running speed that was decreased in both groups, similarly (Table 2).
The Maximum ankle-joint angles during stance for the healthy and flat-feet groups are presented in Table 3. The average Subtalar inversion/ eversion and ankle internal rotation were not significantly different between groups without fatigue condition. The average ankle plantar flexion/ dorsiflexion in the flat feet group were significantly smaller by 27.38% (p=0.004) and 38.18% (p=0.001) than those in the healthy group without fatigue condition (Table 3). Besides, the average ankle external rotation in the flat feet group was about 25 % greater than that in the healthy group (p=0.010) without fatigue.
| Variables | No Fatigue | Fatigue | P-value (Time) | P-value (Time& group) | P-value (between groups) in Pre-test | P-value (between groups) in Post-test | ||
|---|---|---|---|---|---|---|---|---|
| FF | C | FF | C | Fatigue | Fatigue & group | C- FF | C- FF | |
| Ankle dorsiflexion | 11.35±2.03 | 15.63±1.28 | 13.12±3.15 | 13.47±1.18 | 0.852 | 0.085 | 0.004 | 0.837 |
| Ankle plantar flexion | 5.44±1.25 | 8.80±.65 | 4.61±1.17 | 6.37±.73 | .001* | .042* | .001* | .025* |
| Subtalar eversion | 5.70±1.18 | 6.22±3.96 | 6.92±1.72 | 7.95±2.34 | 0.056 | 0. 720 | 0.743 | 0.424 |
| Subtalar inversion | 3.02±.758 | 2.85±.455 | 3.61±.519 | 2.86±.380 | 0.191 | 0.205 | 0.686 | 0.034* |
| Ankle internal rotation | 10.82±3.18 | 9.08±1.24 | 11.80±1.23 | 10.41±4.25 | 0.285 | 0.868 | 0.332 | 0.425 |
| Ankle external rotation | 12.53±.927 | 10.01±2.22 | 13.28±1.93 | 11.05±1.31 | 0.16 | 0.813 | 0.024 | 0.072 |
Table 3: The range of motion parameters of gait for control and experimental groups in all three planes of motion at the ankle jo
The results of this study showed that in both groups, fatigue reduced the maximum ankle plantar flexion of the stance phase (p=0.001). After reaching fatigue, maximum ankle plantar flexion was decreased in the healthy group, while the low-arched group exhibit smaller changes for maximum ankle plantar flexion after fatigue (p= 0.042). Therefore, the Group × Time interaction for ankle plantar flexion was significant (p=0.001). Post-fatigue changes in both groups were not similar, indicating that the Group × Time interaction was significant.
For Subtler inversion, the group× time interactions were not significant (p=0.205). This could be due to extensive inversions in the low-arched group compared to the healthy controls after fatigue (p=0.034). Results from this study indicate that fatigue due to various foot types and in different individuals could result in different injury patterns among those who are runners (Table 3).
Maximum Knee flexion angle during the stance for the flat-feet group was higher by 13.35% (p=0.001) than those in the healthy group without fatigue condition (Table 4). After getting to the fatigue state, knee flexion was increased underneath the stance phase in both groups, respectively (p = 0.020). However, the Group× Time interaction for Knee flexion was not significant. This was due to the fact that Knee flexion experienced almost the same degree of increase in both groups. Also, after reaching the fatigue state, Knee Internal rotation was increased underneath the stance phase in both groups (p=0.006), while an increase in the low arch group was less than in the able-bodied group (p=0.003). After inducing fatigue, Knee external rotation was increased underneath the stance phase in both groups, respectively (p = 0.025) (Table 4).
| Variables | No Fatigue | Fatigue | P-value (Time) | P-value (Time& group) | P-value (between groups) in Pre-test | P-value (between groups) in Post-test | ||
|---|---|---|---|---|---|---|---|---|
| FF | C | FF | C | Fatigue | Fatigue & group | C- FF | C- FF | |
| Knee flexion | 44.39±1.58 | 39.16±2.13 | 47.29±3.59 | 41.96±.897 | 0.02 | 0.965 | 0.001 | 0.019 |
| Knee abduction | 11.19±3.13 | 14.25±4.75 | 13.40±3.06 | 16.98±2.70 | 0.004* | 0.689 | 0.226 | 0.085 |
| Knee Internal rotation | 15.67±4.99 | 13.97±3.13 | 17.82±1.30 | 21.16±1.27 | 0.006 | 0.089 | 0.558 | 0.003 |
| Knee external rotation | 9.09±2.73 | 8.67±1.48 | 11.07±1.75 | 9.92±2.32 | 0.025 | 0.565 | 0.783 | 0.376 |
Table 4: The range of motion parameters of gait for control and experimental groups in all three planes of motion at the knee joi
| Variables | No Fatigue | Fatigue | P-value (Time) | P-value (Time& group) | P-value (between groups) in Pre-test | P-value (between groups) in Post-test | ||
|---|---|---|---|---|---|---|---|---|
| FF | C | FF | C | Fatigue | Fatigue & group | C- FF | C- FF | |
| Hip flexion | 45.40±2.16 | 40.85±1.08 | 47.44±2.78 | 45.23±1.62 | 0.003 | 0.18 | .004* | 0.185 |
| Hip extension | 15.71±1.04 | 11.56±1.31 | 15.16±.880 | 14.60±.556 | .004* | .000* | . 000* | 0.29 |
| Hip adduction | 4.29±1.64 | 5.04±1.72 | 7.28±2.17 | 6.03±1.10 | 0 | 0. 013 | 0.496 | 0.316 |
| Hip Internal rotation | 13.94±1.47 | 12.24±2.91 | 15.44±1.58 | 14.75±2.45 | 0.03 | 0.532 | 0.221 | 0.58 |
| Hip external rotation | 8.69±2.15 | 6.40±1.44 | 10.66±1.54 | 9.04±.675 | 0.007 | 0.621 | 0.093 | 0.082 |
Table 5: The range of motion parameters of gait for control and experimental groups in all three planes of motion at the hip join
The Maximum hip angles during stance for the healthy and flat-feet groups are presented in Table 5. The flat-feet group displayed greater hip flexion/extension by 11% (p=0.004) and 35% (p=0.000) respectively, than those in the healthy group without fatigue. After the fatigue, Hip flexion was significantly increased underneath the stance phase in both groups (p = 0.003). Furthermore, after fatigue, Hip extension was significantly increased underneath the stance phase in the healthy group, while it did not show any clear change after fatigue in the low-arch group (p = 0.004).
A significant Group × Time interaction effect was found for hip extension (p = 0.000). This was due to the fact that hip extension increased significantly in the healthy group but did show a minimal change in the low-arched group after fatigue.
After the fatigue, Hip adduction was significantly increased underneath the stance phase in both groups (p = 0.003). A significant Group × Time interaction effect was found for Hip adduction (p = 0.013), which was due to Hip adduction that increased significantly in the low-arched group but not in the able-bodied group. After fatigue set in, hip Internal rotation was increased underneath the stance phase in both groups (p = 0.030). Similarly, the groups also displayed hip external rotation that increased underneath the stance phase after fatigue (p = 0.007).
Discussion
The purpose of this study was to compare the effects of lower limb muscle fatigue with acute effects on running kinematics in Subjects with low longitudinal arch. Under the unfatigued conditions, this study is the first to find out that tempo-spatial parameters (i.e., running speed) and joint excursions (i.e., ankle plantar flexion/dorsiflexion, ankle external rotation and knee flexion and hip flexion/extension) in the LLA subjects are significantly different from those in the healthy subjects. This confirms the first hypothesis of this study and reveals that; low medial longitudinal alters the running kinematics components. Moreover, the most evident difference of kinematics components between healthy subjects and LLA is related to Joint excursion in lower extremity kinematics. However, several other kinematic variables of tempo-spatial parameters and the lower limb joints were similar in both groups. These changes in the low-arched foot can be used to provide feedback for helping identify potential mechanisms related to injury risk factors and possible different compensations. As a consequence, studies about the effects of running and walking have found that those with pes planus are more likely to suffer from tissue stress injuries due to abnormal joint rotation [13] or joint coupling [20]. We saw that the flat-feet group walked with excessive pronation and hind foot eversion. The extensive pronation of the foot was along with an increase in the internal rotation of leg and thigh. Hind foot eversion can also lead to an increase in knee ROM in frontal plan [21]. These changes are consistent with findings of the previous studies; for instance, Lin et al. found that compared with the normal arched group [15], significant differences were seen between the moderate and severe flexible FF groups in terms of the temporal spatial variables and the kinematics of the coronal and horizontal planes of the ankle and knee.
According to Cohen-Sobel, et al. [22] and D’Amico [23], FF may cause gait disorders in the future, although this fact is often overlooked. Planes of the ankle and knee were significantly different in the moderate and severe flexible FF groups when compared with the healthy arched group.
This study is the first to identify that running speed in LLA group was significantly less than that of the Control group. This proves the first hypothesis of this study and reveals that foot structure alters tempo-spatial parameters. Gait speed is an important objective measure of functional mobility, particularly for older adults. The gait speed is especially important in that it has relationships with various health outcomes, such as functional decline, discharge location and mortality [24, 25]. Gait speed is also a potentially useful means for talking about the future decline in one’s functions, rehabilitations and fear of falling [26]. It is also interesting to note that a Taiwanese study found traces of impaired temporal–spatial parameters such as reduced walking speed and stride length in flat-feet children which might partially be due to increased ligamentous laxity in Chinese populations [15].
In present study, before fatigue state was reached, LLA group displayed lower ankle plantar flexion/ dorsiflexion but higher ankle external rotation compared with those in C group. In people with Pes planus, it is possible that, during propulsion, such muscles as tibia is posterior cannot produce the force necessary for producing eversion of the mid foot on the rear foot [27]. Gait abnormalities that are associated with impaired plantar flexor function may involve the case of a calcaneal limp pattern, which comes along with increased dorsiflexion in late stance [28].
Also, our finding is consistent with biomechanical theory based on which flat-feet are comparatively less capable of undertaking the coordinated supinator motion of the foot that happens during the terminal stance and pre-swing [29]. Anatomically put, this supinator motion has been responsible for an important realignment in the calcanei-cuboid joint [30]. During the propulsive phase of gait, supinator motion is thought to increase the stiffness of the mid foot and fore foot along with tensile forces in plantar tissues that are related to toe flexion [31].
Before fatigue sets in, Knee flexion in LLA group was significantly higher than that of C group. The knee flexion contracture has effects on excessive knee flexion during walking which is usually seen in a crouch gait. Compensations
that are commonly observed include a decrease in the length and velocity of the stride and an increase in forefoot weight bearing and also flexion posture in stance [32]. Previous studies have described knee flexion contracture along with that hamstring contracture. It was found that the minimal popliteal angle (hamstring contracture) that can produce effects on gait was 85° and included such cases as an increased effort in walking, a decrease of speed, a decrease in the length of stride and step and increased knee flexion in stance [33].
Before fatigue takes over, hip flexion/extension in LLA group was significantly higher than that of C group. These findings were contrary to the findings of Twomey, et al., 2012 who reported no differences in the sagittal plane motion of pelvic tilt, and hip, knee and ankle flexion between the healthy and low-arched foot during the gait cycle [34]. Lin, et al. [35] stated that foot structure changes not hip kinematics during walking in the low-arched in preschool children [15].
The results showed that fatigue decreased running speed in both groups. Any decrease in muscle mass and muscle strength in the lower extremities may affect walking speed and can also affect daily physical activities in healthy elderly individuals [26]. Studies that have involved over ground running have often shown a decrease in running speed along with progressive fatigue [36]. Yet, it is interesting to note that reduction of speed, increase in double support time, and reduced length of stride are more often associated with fear of falling, rather than falling itself [28].
The results showed that fatigue decreased ankle plantar flexion in both groups, while the healthy group showed more decline. Also results from this study show that fatigue can have the following effects; increase in Knee flexion, Knee abduction, Knee Internal rotation (that was greater in Control group), Knee external rotation (we had a greater increase in LLA group), Hip flexion (we saw a more considerable increase in C group), Hip adduction (more considerable increase in LLA group), hip Internal rotation and hip external rotation in both groups.
Parijat, et al. examined the effect of lower extremity fatigue on gait variables of healthy young adults and came out with the following results: significant decrease in the center of mass and peak knee joint moment and an increase in knee flexion and reduction in ankle dorsiflexion at the heel strike phase of the gait cycle during fatigue trials [37].
Hunt et al. studied the effects of ankle plantar flexor fatigue on knee and ankle biomechanics during gait. Their results showed that fatigue could significantly decrease medial gastrocnemius activity, and increase knee flexion ROM and external knee flexion moment [38].
Other researchers have likewise proved that a high- intensity quadriceps fatigue protocol could lead to an increase in external rotation angle. It was also observed that after fatigue, changes in muscle activation patterns mostly followed biomechanical changes [39]. Although not many studies have been done on the knee joint internal rotation ROM in the flat-feet groups, the general idea is that rotational changes in the knee joint and applied load on knee cartilage form the basis for the onset of knee joint arthritis [40].
Also, results of this study have invariably shown that fatigue could increase Step-time, decrease Step length, and increase Subtalar inversion in low-arch feet individuals while running. An increase in stride-time variability is related to a five-fold increase in the risk of falling in the community of elderly [41].
A significant Group × Time interaction effects were found for Step time, ankle plantar flexion, hip extension and hip adduction (p≤0.05). The results of this study showed that fatigue had adverse effects on Step time and hip extension in groups with low and normal arches.
Results and Conclusion
In the unfatigued conditions, running speed, ankle plantar flexion/ dorsiflexion, and ankle external rotation, knee flexion and hip flexion/extension in the low arch subjects are significantly different than those in the healthy subjects. Induced fatigue increased Step time and Subtalar inversion; too decreased Step length in LLA. The observed Induced fatigue decreased running speed and ankle plantar flexion, and increased Knee flexion, Knee abduction, Knee Internal rotation, Knee external rotation, Hip flexion, Hip adduction, hip Internal rotation and hip external rotation in both groups. The results represented that fatigue affected lower extremity function during running and changed the characteristics of tempo-spatial parameters and Joint excursion in minimal components, due to this changes, the risk of lower limb injuries increased. According to these results, it can be said that Patients suffering from low arches will respond differently to lower extremity fatigue. Individuals with flat feet arches appear to be more prone to the risk of injury to the lower extremities at exhausting activities. Therefore, providing strategies to prevent this risk factor can play an important role. Therefore, it is suggested that feedback from changes in these biomechanical parameters complement treatment strategies and prevent these risk factors in the activity and rehabilitation of therapists, physiotherapists and other groups. One of the limitations of this research is the study on men, and due to gender differences, it is impossible to generalize the results to the entire society. Another limitation of the present study is that the electromyographic activities of muscles are not investigated simultaneously with other kinematic and kinetic components.
References
-
Shih YF, Chen CY, Chen WY, Lin HC (2012) Lower Extremity Kinematics in Children with and without Flexible Flatfoot: A Comparative Study. BMC Musculoskeletal Disorders 13: 31.
-
Arachchige SNK, Chander H, Knight A (2019) Flat Feet: Biomechanical Implications, Assessment and Management. The Foot 38: 81-85.
-
Chen JP, Chung MJ, Wang MJ (2009) Flatfoot Prevalence and Foot Dimensions of 5- to 13-Year-Old Children in Taiwan. Foot Ankle international 30(4): 326-332.
-
Powers CM, Maffucci R, Hampton S (1995) Rearfoot Posture in Subjects with Patellofemoral Pain. Journal of Orthopaedic & Sports Physical Therapy 22(4): 155-160.
-
Peeters K, Schreuer J, Burg F, Behets C, Van Bouwel S, et al. (2013) Alterated Talar and Navicular Bone Morphology is Associated with Pes Planus Deformity: A CT‐Scan Study. Journal of Orthopaedic Research 31(2): 282-287.
-
Hunt AE, Smith RM (2004) Mechanics and Control of the Flat versus Normal Foot during the Stance Phase of Walking. Clinical biomechanics 19(4): 391-397.
-
Buldt AK, Levinger P, Murley GS, Menz HB, Nester CJ, et al. (2015) Foot Posture is Associated with Kinematics of the Foot during Gait: A Comparison of Normal, Planus and Cavus Feet. Gait Posture 42(1): 42-48.
-
Murley GS, Landorf KB, Menz HB, Bird AR (2009) Effect of Foot Posture, Foot Orthoses and Footwear on Lower Limb Muscle Activity during Walking and Running: A Systematic Review. Gait & posture 29(2): 172-187.
-
Milgrom C, Radeva Petrova DR, Finestone A, Nyska M, Mendelson S, et al. (2007) The Effect of Muscle Fatigue on _In Vivo_ Tibial Strains. Journal of biomechanics 40(4): 845-850.
-
Hösl M, Böhm H, Multerer C, Döderlein L (2014) Does Excessive Flatfoot Deformity Affect Function? A Comparison between Symptomatic and Asymptomatic Flatfeet Using the Oxford Foot Model. Gait & posture 39(1): 23-28.
-
Levinger P, Murley GS, Barton CJ, Cotchett MP, McSweeney SR, et al. (2010) A Comparison of Foot Kinematics in People with Normal- and Flat-Arched Feet Using the Oxford Foot Model. Gait & posture 32(4): 519-523.
-
Williams DS, McClay IS, Hamill J, Buchanan TS (2001) Lower Extremity Kinematic and Kinetic Differences in Runners with High and Low Arches. Journal of applied biomechanics 17(2): 153-163.
-
Nigg BM, Cole GK, Nachbauer W (1993) Effects of Arch Height of the Foot on Angular Motion of the Lower Extremities in Running. Journal of biomechanics 26(8): 909-916.
-
Cappello T, Song KM (1998) Determining Treatment of Flatfeet in Children. Current opinion in pediatrics 10(1): 77-81.
-
Lin CJ, Lai KA, Kuan TS, Chou YL (2001) Correlating Factors and Clinical Significance of Flexible Flatfoot in Preschool Children. J pediatric ortho 21(3): 378-382.
-
Barbieri FA, Dos Santos PCR, Lirani Silva E, Vitório R, Gobbi LTB, et al. (2013) Systematic Review of the Effects of Fatigue on Spatiotemporal Gait Parameters. J back Musculoskelet Rehabil 26(2): 125-131.
-
Gerlach KE, White SC, Burton HW, Dorn JM, Leddy JJ, et al. (2005) Kinetic Changes with Fatigue and Relationship to Injury in Female Runners. Medicine & Science in Sports & Exercise 37(4): 657-663.
-
Faul F, Erdfelder E, Lang AG, Buchner A (2007) G* Power 3: A Flexible Statistical Power Analysis Program for the Social, Behavioral, and Biomedical Sciences. Behavior Research Methods 39(2): 175-191.
-
Guide VP-iGP (2010) Foundation Notes Revision 2.0 March 2010. For use with Plug-in Gait Version: 2.
-
Nawoczenski DA, Saltzman CL, Cook TM (1998) The Effect of Foot Structure on the Three-Dimensional Kinematic Coupling Behavior of the Leg and Rear Foot. Physical Therapy & Rehabilitation Journal 78(4): 404- 416.
-
Farahpour N, Sharifmoradi K, Azizi S (2017) Effect of Fatigue on Knee Kinematics and Kinetics During Walking in Individuals With Flat Feet. Physical Treatments- Specific Physical Therapy Journal 7(3): 141-148.
-
Cohen-Sobel E, Giorgini R, Velez Z (1995) Combined Technique for Surgical Correction of Pediatric Severe Flexible Flatfoot. The Journal of foot and ankle surgery 34(2): 183-194.
-
Amico J (1984) Developmental flatfoot. Clinics in podiatry 1(3): 535-546.
-
Montero-Odasso M, Schapira M, Soriano ER, Varela M, Kaplan R, et al. (2005) Gait Velocity as a Single Predictor of Adverse Events in Healthy Seniors Aged 75 Years and Older. The Journals of Gerontology Series A: Biological Sciences and Medical Sciences 60(10): 1304-1309.
-
Studenski S, Perera S, Wallace D, Chandler JM, Duncan PW, et al. (2003) Physical Performance Measures In The Clinical Setting. Journal of the American Geriatrics Society 51(3): 314-322.
-
Kim Hj, Park I, joo Lee H, Lee O (2016) The Reliability and Validity of Gait Speed with Different Walking Pace and Distances Against General Health, Physical Function, and Chronic Disease in Aged Adults. J exerc Nutrition Biochem 20(3): 46.
-
Murley GS, Menz HB, Landorf KB (2009) Foot Posture Influences the Electromyographic Activity of Selected Lower Limb Muscles during Gait. Journal of foot and ankle research 2(1): 35.
-
Kirtley C (2006) Clinical Gait Analysis: Theory and Practice: Elsevier Health Sciences.
-
Elftman H (1960) The Transverse Tarsal Joint and Its Control. Clinical Orthopaedics and Related Research® 16: 41-46.
-
Bojsen-Møller F (1979) Calcaneocuboid Joint and Stability of the Longitudinal Arch of the Foot at High and Low Gear Push Off. J Anat 129(Pt 1): 165-176.
-
Fuller EA (2000) The Windlass Mechanism of the Foot. A Mechanical Model to Explain Pathology. Journal of the American Podiatric Medical Association 90(1): 35-46.
-
Cerny K, Perry J, Walker JM (1994) Adaptations during the Stance Phase of Gait for Simulated Flexion Contractures at the Knee. Orthopedics 17(6): 501-513.
-
Balzer J, Schelldorfer S, Bauer C, van der Linden ML (2013) Effects of Simulated Crouch Gait on Foot Kinematics and Kinetics in Healthy Children. Gait & posture 38(4): 619-624.
-
Twomey D, McIntosh A (2012) The Effects of Low Arched Feet on Lower Limb Gait Kinematics in Children. The Foot 22(2): 60-65.
-
Bauer JJ, Fuchs RK, Smith GA, Snow CM (2001) Quantifying Force Magnitude and Loading Rate from Drop Landings that Induce Osteogenesis. Journal of Applied Biomechanics 17(2): 142-152.
-
Brahms CM (2017) The Assessment of Fatigue-Related Changes in Stride Mechanics, Variability and Long- Range Correlations in Recreational and Elite Distance Runners Using Foot-Mounted Inertial Sensors: Faculty of Graduate Studies and Research, University of Regina 5: 55-78.
-
Parijat P, Lockhart TE (2008) Effects of Quadriceps Fatigue on the Biomechanics of Gait and Slip Propensity. Gait & posture 28(4): 568-573.
-
Hunt MA, Hatfield GL (2017) Ankle and Knee Biomechanics during Normal Walking Following Ankle Plantarflexor Fatigue. Journal of Electromyography and Kinesiology 35: 24-29.
-
Murdock GH, Hubley-Kozey CL (2012) Effect of a High Intensity Quadriceps Fatigue Protocol on Knee Joint Mechanics and Muscle Activation during Gait in Young Adults. European journal of applied physiology 112(2): 439-449.
-
Andriacchi TP, Briant PL, Bevill SL, Koo S (2006) Rotational Changes at the Knee after ACL Injury Cause Cartilage Thinning. Clinical Orthopaedics and Related Research® 442: 39-44.
-
Ebrahim S, Sainsbury R, Watson S (1981) Foot Problems of the Elderly: A Hospital Survey. Br Med J (Clin res Ed) 283(6297): 949.
- The Expanding Landscape of Road Rage: A Systematic Review of Conflicts Involving Drivers, Pedestrians, and Micromobility
- Validating Cognitive Models of Royal Navy Performance on Control Systems
- Comparing Standard and State-of-the-art Firefighter Coats on Postural Balance and Gait in a Live Burn Environment
- Investigating the Integration of Telemedicine into Clinicians Workflow: A Review of Methods
- Risk Assessment of Ergonomic Factors in a Textile Firm by RULA, REBA and Fine Kinney Methods
- Impact of Self-Esteem Training on Individuals with Disabilities Aged 17-30