Profile and Analysis of Road Traffic Accidents in Khammam
During one year study period a total 768 cases of medico legal autopsies were conducted out of which 108 cases were of fatal road traffic accidents at the mortuary of Mamata Medical College and MGH, Khammam, Telangana. Most vulnerable were married males and individuals between 31-40 years. Two wheeler occupants formed the largest group 66[61.11%] followed by the pedestrians 26[24.07%]. Most of the victims were from rural areas, Hindu, belonging to middle income group, studied up to secondary education, working as unskilled workers. Highest number of 49[45.37%] cases occurred during day time, on the nationalhighways60 [55.55%]. We observed that the highest number 60[55.55%] of cases occurred during winter season, on weekend days. The commonest 62[57.40%] type of crash pattern was 2WH to LMV. The commonest road users involved in accidents was two wheeler followed by pedestrians. At the time of accident majority of victims were helmet non users seen in two wheeler road users 66[61.11%]. Human error is the most common cause of road traffic accidents. Fissured fracture was the commonest type. SubDural hemorrhage was the commonest intracranial hemorrhage. We found 83[76.85%] of the victims of RTAs died either on spot or within 24 hours of the accident. Head injury was the responsible for most of deaths. The prime objective of present study is to know the sociodemographic profile, types of road users involved in accidents, crash pattern of accidents, pattern of injuries due to RTA and contributing causative factors for accidents, mechanism of injuries, cause of death and their preventive measures.
Introduction
Road traffic accidents are the only public health problem for which society and decision makers still accept death and disability among young people on large scale. Worldwide, every day about 3400 people die due to road traffic accidents [RTA] and predicted to result in deaths of around 1.9 million people annually by 2020 [1]. Currently two wheelers are major component of road traffic, preferred family vehicle and they have taken mega share of road accidents. Motor cycle users, pedestrians and pedal cyclists are vulnerable road users [1]. Nearly 90% of world’s RTA fatalities are occurring in low and middle income countries, whereas highly motorized countries contribute every little though they accommodate over 60% of world’s vehicles [2]. RTAs are the sixth leading cause of death in India [over 1, 30, 000 deaths per year] and responsible for huge share of emergency hospitalization, socioeconomic burden, disabilities, and deaths of young and middle aged population [3]. They are directly exposed to impacting vehicle or hard objects during collision and likely to get injured severely even though vehicular related RTA deaths are very familiar on Indian roads. The important factors are human errors, driver fatigue, poor traffic sense, mechanical faults of vehicle, speeding and over taking violation of traffic rules, poor road conditions, traffic congestion, road encroachment and drunken driving, mobile usage, no driving license etc [4]. The main purpose of this study is to describe sociodemographic profile of victims of RTAs, pattern of injuries, mechanism of vehicular injury, and cause of death and causes contributing for causation of RTAs and their preventive measures.
Aims and Objectives
- To study of socio demographic profile of RTA victims.
- To study the patterns of RTAs injuries, road users, crash pattern, cause, manner, mechanism of injury.
- Preventive measures of factors contributing to Road Traffic Accidents.
Materials and Methods
108 cases of RTAs caused by accidents were selected from the autopsies conducted for a period of one year from Jan 2016 to Dec 2016 at Dept of Forensic Medicine Mamata Medical College attached with Mamata General Hospital Khammam, Telangana, India. Only those cases were selected which had definite history of injury by road traffic accidents. A detailed postmortem examination was carried out on every case. A Proforma prepared and data collected including approximate age, sex, history of injury from relatives, eye witnesses regarding the cause and manner of injury, time and place of injury, period of survival following the RTA and alcohol/drug abuse by person. The external examination of the whole body was done with special attention towards the injuries of head. The nature of injuries, like abrasions, contusions, lacerated wounds and fractures and their types, location and dimensions were carefully noted. Evidence of bleeding from natural orifices was also noted. Head injuries were examined methodically. The inner aspect of the scalp was examined for evidence of any contusions or hematomas. Fractures of the skull were examined in detailed as to the type, extension and location. Injuries to the meanings and their blood vessels and corresponding intracranial hemorrhages were noted. Dura at the base of skull was stripped off to visualize fractures if any.
Results and Discussion
A total of 108 cases were included in our study and observed, tables were made, compared with previous studies and concluded 768 of autopsies were done out of which 108[14.06%] cases were deaths due to road traffic accident. The accidents have contributed for most of deaths due to RTAs, two wheeler users and pedestrians have the highest rates of fatal injuries. These are similar to other studies [2, 4]. The commonest vulnerable age group is 30-40 years 37[34.25%] followed by 20-30 years 24[22.22%] next age group 11-20 years 18[16.66%] and on age group of 41-50 years 16[14.81%]. In extreme age group persons least cases were found in this study. Tendency of the age group of 20-40 years to show scarce attention to traffic rules & regulations and nonuse of safety devices like helmets, seatbelts, restraints etc. can be a possible explanation for the same. These are consistent with authors [3, 4, 5, 6] (Figure 1).
Chart 1: Age Wise Victims
CHART 2: SEX WISE VICTIMS
Male , 98
120
108
| 3 | 5 | 7.4 4 |
travelling and various outdoor activities, hence they are prone to accidents. These are similar to studies conducted by others [3, 4, 5, 6] (Figure 2).
Total , 108
| Mal | ||
| Female , 10 Female , 9.25 |
Chart 3: Community Wise
CHART 4: AREA WISE
160
140
76, 70% inadequate use of protective gears, unsafe roads and vehicles, fatigue associated with travelling long distance. Similar results were noted by authors [6, 7] (Figure 4).
![Figure 1: Age Wise Victims. The incidence of injuries due to RTAs was higher 98 [09.74%] in males then 10 [9.25%] females. Female to male ratio is being 0:10. Males are the main bread earners in the Indian families so spend lots of their time in](/fulltextimages/506/fig_1.jpeg)
![Figure 2: Sex wise victims. Most of the 76[37%] victims were Hindu followers followed by Muslims 21 [19.44%] and 11 [10.18%] were from Christian community. These findings were supported by Indian studies (Figure 3).](/fulltextimages/506/fig_2.jpeg)
Married persons 82[75.92%] outnumbered unmarried persons 24[22.22%] in this study. A total of married persons 82, out of which males were 74 and females were 8 cases. Whereas unmarried males were 24 and divorced female one case and widow one case only. These are consistent with authors [8] (Figure 5).
Chart 5: Marital Status
120
| Tota | l , 98 | ||||||
| U | n married , | 24 | Divorce , | 0 | |||
| 1 | Marital st2 | atus , 0 3 | 4 | 5 | 6 | Widow , 07 |
In our study, we observed that most of the 61 [56.48%] victims were belonging to middle socioeconomic group followed by low 29 [26.85%] and minimum 18 [16.66%]
Chart 6: Socioeconomic Status
cases were belonging to high class. Similar findings were made by authors [6, 7, 8, 9, 13] (Figure 6).
In the present study, highest number of 52 [48.14%] victims were educated up to secondary education followed by graduation 20 [18.51%], next primary education 19 [17.59%] and least post-graduation 9 [8.33%]. Whereas 15 [13.88%] cases of illiterates, were found in this study. Which are consistent with studies by others [6, 7, 8, 9, 13] (Figure 7).
Chart 7: Educational Status
Occupation wise distribution, majority of victims were unskilled workers 40 [37.03%] followed by students 24 [22.22%] and employees 21 [19.44%]. Similar results are noted by authors. The possible reason might be that the
Chart 8: Occupation Wise
0
![Figure 3: Community Wise. In present study rural people constitute 72[66.66%] then urban 36[33.33%] people. The rural predominance might be because lack of awareness about traffic rules, lack of adequate and immediate medical facilities,](/fulltextimages/506/fig_3.png)
108 $$ \mathrm {C O} _ {2} + \mathrm {H} _ {2} \mathrm {O} = \mathrm {H C O} _ {3} ^ {-} + \mathrm {O H} ^ {-} $$
4 Occupation
Unskilled worker
$$ = \frac {1}{2} $$ $$ \mathrm {d} = \mathrm {d} _ {0} + \mathrm {d} _ {1} \mathrm {d} _ {2} \mathrm {d} _ {3} \mathrm {d} _ {4} \mathrm {d} _ {5} \mathrm {d} _ {6} \mathrm {d} _ {7} \mathrm {d} _ {8} \mathrm {d} _ {9} \mathrm {d} _ {1 0} $$ Sales / business Domestic worker $$ = \frac {1}{2} $$ $$ = \frac {1}{2} $$ $$ \mathrm {法} = \mathrm {法} $$ Private job Student $$ \mathrm {C O} _ {2} + \mathrm {H} _ {2} \mathrm {O} = \mathrm {H C O} _ {3} + \mathrm {H} _ {2} \mathrm {O} $$ $$ = 0 $$ $$ = \frac {1}{2} $$ Figure 8: Occupation Wise.
In present study the peak timing of occurrence of RTAs was reported at 9am to 12 noon 31 [28.70%] followed by 6am to 9am 18 [16.66%] and next in 12pm to 3pm 17 [15.74%] cases. This is probably due to heavy and
108
| 5.55 20 8.33 1.85 4.62 9 | |||||||||
| 2 | 3 | 5 | 5 6 | 2 |
people employed in these occupations use the road more frequently than those involved in other occupations [7, 8, 9] (Figure 8).
40 $$ \mathrm {E} = \frac {1}{2} \mathrm {E} _ {\mathrm {A}} + \frac {1}{2} \mathrm {E} _ {\mathrm {B}} $$
18 $$ \mathrm {E} = \frac {1}{2} \mathrm {E} _ {\mathrm {A}} + \frac {1}{2} \mathrm {E} _ {\mathrm {B}} $$ $$ \mathrm {C O} _ {2} + \mathrm {H} _ {2} \mathrm {O} = \mathrm {H C O} _ {3} + \mathrm {H} _ {2} \mathrm {O} $$
$$ = \frac {1}{2} $$ Skilled worker Transport worker $$ \mathrm {型} = \mathrm {型} + \mathrm {型} $$ Professional Total $$ \mathrm {d} = \mathrm {d} _ {0} + \mathrm {d} _ {1} \mathrm {d} _ {2} \mathrm {d} _ {3} \mathrm {d} _ {4} \mathrm {d} _ {5} \mathrm {d} _ {6} \mathrm {d} _ {7} \mathrm {d} _ {8} \mathrm {d} _ {9} \mathrm {d} _ {1 0} $$ unequal distribution of incidents occurred when rush was too heavy on road at these working hours. Which are consistent with other studies [6, 12, 13](Figure 9).
Chart 9: Time of Incident
0-3 am 3-6 am 6-9 am 9 am -12
noon Figure 9: Time of Incident. We observed that highest number of RTAs 60 [55.55%]cases took place on national high ways due to Road traffic accidents followed by state highways 30 [27.77%] of cases and city roads 10 [9.25%]. The reasons for high incidence of accidents on the highways [national & state] and city roads might be these roads are busiest ,very narrow, too much traffic during peak hours ,no traffic signals at junctions, and no strict enforcement of road safety rules. These are similar to studies by authors [8, 12] (Figure 10).
Chart 10: Place of Incidence
| 5 | 8 |
In the present study, higher number of road accidents are occurred on weekends [Fridays, Saturdays and Sundays] 16 [14.81%], 21 [19.44%] and 28 [25.92%]
respectively. Similar results were observed by authors [8, 11]. The higher number of reported accident cases occurred on weekends when compared to week days due to coexistence with soaring traffic density, traffic congestion, urge to reach destination in time, high people
Chart 11: Day Wise Accidents
$$ \| $$ $$ \mathrm {E} = \frac {1}{2} \mathrm {A} ^ {2} + \mathrm {B} ^ {2} + \mathrm {C} ^ {2} + \mathrm {D} ^ {2} $$
0 movements to work place & house and failure to follow traffic rules & laws (Figure 11).
In this study, we observed that the highest number 60 [55.55%] of cases occurred during winter season followed by summer season 30 [27.77%] and least 18 [16.66%] cases were occurred in Rainy season. These are consistent with authors [6, 10]. The reason might be poor visibility to vehicle drivers leading to accidents in the early hours of day due to foggy weather conditions and slow reaction time due to extreme cold affecting both drivers and road users (Figure 12).
Chart 12: Seasonal Variation
70
60
| Wi Fe | ||||
|---|---|---|---|---|
| Su J | mmer[ Mar to une], 27.77 Rainy [Jul to Sep], 18 | |||
| Rainy [Jul to Sep], 16.66 | ||||
| Se | ||||
Types of road users involved in accidents, in this study maximum number of accidents 66 [61.11%] were due to two wheeler type of road user followed by pedestrian 26 [24.07%] cases. These are consistent with studies by authors [8, 9, 10, 11, 12, 13, 14, 15, 16]. Two wheelers are preferred transportation vehicles for vast Indian families as they are cheaper, gives better mileage, carrying at least 2 to 3 passengers, easy to park & ride in traffic congestion. Two Winter [Oct to Feb], 60 Rainy [Jul to Sep] Winter [Oct to Total Feb]
wheeler accidents have contributed for nearly more than half of total RTA deaths, two wheeler users and pedestrians have the highest rates of fatal injuries. The reasons might be for high rate of two wheeler accidents are that therefore more vehicles on Indian traffic, vehicle vulnerability, poor road status, coupled with non- adherence of riders to road safety rules & traffic laws (Figure 13).
Chart 13: Types of Road Users Involved in Accidents
$$ = \frac {1}{2} $$ Road Users 2WH Pedestrians LMV HMV 3WH Others Total
Evidence of using helmets among riders, we observed that the highest 50 cases were nonusers of helmet while using two wheelers whereas helmet users in 16 cases in wheeler accidents we noticed that most of the victims
108
8 4 3 1 $$ = \frac {1}{2} $$
$$ - \mathrm {I} $$ $$ - \mathrm {I} $$
$$ - \mathrm {I} $$ $$ - 1 $$
who died because of fatal head injury were not users of helmets, which shows that the safety helmet can be the life saving during the accident involving two wheelers [6, 8, 10, 15] (Figure 14).
Chart 14: Evidence of Using Helmets Among Riders
0 Figure 14: Evidence of Using Helmets among Riders.
In our study, we found 83 [76.85%] of the victims of RTAs died either on spot 39 [36.11%] or 44 [40.745] within one hour of the incidence and rest could survive Total , 108
| Pedestrians, 26 Four wheeler, 12 | ||||
| BicycleT, h2ree wheeler, 2 |
for a couple of days to maximum of two weeks after getting good medical and surgical procedures. The time of survival of head injury victims varied as per the severity of trauma and also health care services provided to the patients. Similar observations were made by authors
Chart 15: Survival Period of Vitims
2 2 3 5 $$ \mathrm {E} = \frac {1}{2} \mathrm {A} ^ {2} + \mathrm {B} ^ {2} $$
$$ \mathrm {E} = \frac {1}{2} \mathrm {A} ^ {2} + \mathrm {B} ^ {2} $$
$$ = \frac {1}{2} $$
0
0 $$ = \frac {1}{2} $$
$$ \mathrm {E} = \mathrm {E} _ {1} + \mathrm {E} _ {2} + \dots + \mathrm {E} _ {n} $$ $$ \mathrm {E} = \frac {1}{2} \mathrm {A} ^ {2} + \frac {1}{2} \mathrm {B} ^ {2} + \frac {1}{2} \mathrm {C} ^ {2} $$ $$ \mathrm {E} = \frac {1}{2} \mathrm {A} ^ {2} + \mathrm {B} ^ {2} $$ $$ = \frac {1}{2} $$ $$ \mathrm {E} = \frac {1}{2} \mathrm {A} ^ {2} + \mathrm {B} ^ {2} $$ $$ = \mathrm {L} ^ {2} $$ $$ \mathrm {E} = \frac {1}{2} \mathrm {A} ^ {2} + \frac {1}{2} \mathrm {B} ^ {2} + \frac {1}{2} \mathrm {C} ^ {2} $$ $$ \mathrm {E} = \frac {1}{2} \mathrm {A} ^ {2} + \mathrm {B} ^ {2} $$
0 $$ - 1 $$ $$ - \frac {1}{2} $$
$$ - \frac {1}{2} $$ Survival
Spot death Within one
12-24 hours Period
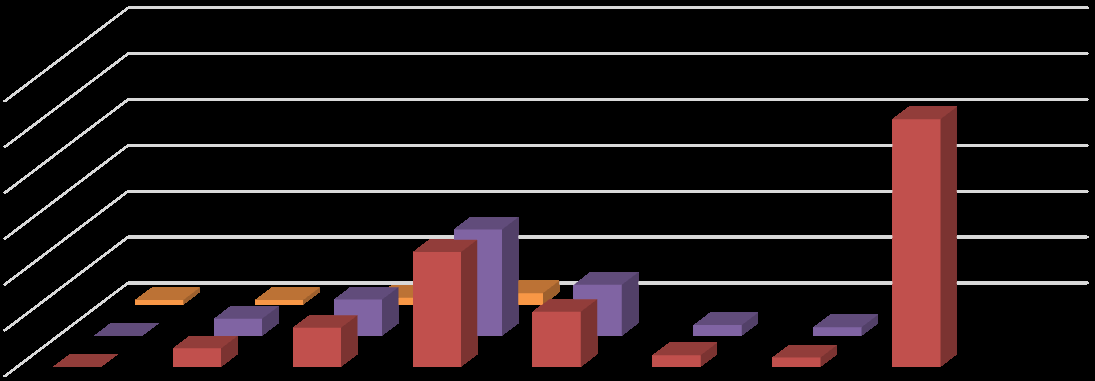
hour Figure 15: Survival Period of Vitims. According to crash pattern, majority of 62[57.40%] cases were seen in two wheeler hit to LMV crash pattern followed by LMV hit to LMV 40[37.03%] next two wheeler to two wheeler hit 24[22.22%] cases and minimum 14[12.96%] of cases seen in pedestrian to LMV crash pattern. Which are similar to studies by others. The two
Chart 16: Crash Pattern
10 6 4 3 2 $$ \mathrm {E} = \frac {1}{2} \mathrm {A} ^ {2} + \mathrm {B} ^ {2} $$ $$ \mathrm {E} = \frac {1}{2} \mathrm {A} ^ {2} + \mathrm {B} ^ {2} $$ $$ \mathrm {E} = \frac {1}{2} \mathrm {A} ^ {2} + \frac {1}{2} \mathrm {B} ^ {2} + \frac {1}{2} \mathrm {C} ^ {2} $$ $$ \mathrm {E} = \frac {1}{2} \mathrm {A} ^ {2} + \mathrm {B} ^ {2} $$ $$ \mathrm {E} = \frac {1}{2} \mathrm {A} ^ {2} + \mathrm {B} ^ {2} $$ $$ \mathrm {B} = \mathrm {B} _ {1} + \mathrm {B} _ {2} + \mathrm {B} _ {3} + \dots + \mathrm {B} _ {n} $$ $$ \mathrm {E} = \frac {1}{2} \mathrm {A} ^ {2} + \mathrm {B} ^ {2} $$ $$ = \frac {1}{2} $$ $$ - \frac {1}{2} $$ $$ - 1 $$ $$ - \frac {1}{2} $$
2-6 hours 7 -24 hours 2-6 days 7 days or Total
more wheeler hit by the light motor vehicle was the most common type of crash in our study. This might be due to the fact that the two wheelers are more affordable and are much more in number when compared with other vehicles [7, 8, 16]. (Figure 16)

5.55 0
6 0 Figure 16: Crash Pattern.
In our study, the dominant type of skull fracture found was fissured fracture in 53[49.07] % cases followed by comminuted fracture 28[25.92%] next depressed fracture 8[7.40%] and least 5[4.62%] of cases were basilar fractures. The presence of hinge fracture in 5.55% of cases and sutural fracture in 0.92 % of cases whereas in 6[5.5%] of cases no skull fractures are not found in this study. These are consistent with studies by authors [17, 18, 19, 20]. In our study, in basal fractures, middle cranial fossa was commonly involved in 32.35% of cases. Similar observations were made by authors [17, 18, 19, 20]. The commonest variety of intracranial hemorrhage found was subdural hemorrhage [SDH] 91[84.25%] followed by subarachnoid hemorrhage [SAH] 68[62.96 %], Intra cerebral hemorrhage [ICH] 24[22.22%] and least is extradural hemorrhage [EDH] was found in 16.6% cases. Which is supported by other studies also [17, 18, 19, 20]? We found multiple injuries of soft tissue & bony injuries among different types of road users. Wounds are produced which are in combinations of abrasion, contusion, lacerations and fracture dislocation seen in majority of cases [6, 12, 13]. Similar findings were made authors. (Figure 17)
Chart 17: Soft & Bony Injuries among Different Types of Road Users
100 102
| 56 | 64 | 66 | ||||||||||||||||||||||||
| 29 | 31 | 26 | ||||||||||||||||||||||||
| 2 | 2 | 0 | 3 | 0 | 3 | 0 | 9 | 0 | ||||||||||||||||||
driving [8]. Too many factors [human, vehicular and roadways] contribute for causation of vehicular accidents and human errors were responsible for many fatalities (Figure 18).
Chart 18: Contributing for Causation of RTAs
Human errors Drunken Driving Mobile UsageNo helmet Negligent or Rash Driving No License Abiding Traffic RulesTotal Figure 18: Contributing for Causation of RTAs. In this study 8[7.40%] of cases were under influence of alcohol intoxication. Driving a vehicle under intoxication is a crime, because alcohol intoxication impairs driving ability of a person and level of impairment is directly related to blood alcohol concentration [8, 21]. We found that a RTAs associated with head/neck injury was the commonest cause of death in our study. Injury to multiple regions also responsible for cause of death in 22 cases. Which are consistent with studies conducted by authors [6, 13, 22]. (Figure 19)
Chart 19: Causes for Death
22 12 3 6 Injuries to extremities Chest injuries Total
Recommendations
Human error was responsible for accidents due to over speeding, rash driving, loss of control, and violation of traffic rules, alcohol intoxication, fatigue, and sleepiness are factors. Road safety is a multispectral and multi- dimensional issue requiring a multi prolonged approach at various levels.
Conclusions
The rate of incidence is 14.06%. The commonest affected age group is 31-40 year. Male subjects predominate female, with female to male ratio is being 0:10. Most of the people were married, from urban areas followers of Hindu religion. Maximum number of victims belongs to middle socioeconomic class, educated up to secondary, working as unskilled workers. High number of cases occurred during winter season, &on weekends. Highest number of cases occurred during day time, on the national highways. The commonest crash pattern was 2WH to LMV. The commonest road users are two wheelers followed by pedestrians. Most of the victims were helmet non users at the time of incident. Commonest type of skull fracture is fissured fracture. Commonest type of intracranial Haemorrhage is SDH. Human error is the most common cause of road traffic accidents. We hope that this study may be helpful in understanding of these problems and will contribute in some way at the national level.
References
-
(2013) World Health Organization. Road Traffic Injuries Fact Sheet no 358, March.
-
Peden M, Scurfiled R, Sleet D, Mohan D, Hyder A, et al. (2004) The World report on road traffic injury prevention. Geneva World Health Organization.
-
Ministry of Health &Family Welfare (2004) Integrated Disease Surveillance Project –Project Implementation Plan 2004-2009. New Delhi: Government of India 1- 18.
-
Kaul A, Sinha US, Pathak YK, Singh A, Kapoor AK, et al. (2005) Fatal Road Traffic Accidents, Study of Distribution, Nature Type of Injury JIAFM 27(2): 71- 75.
-
Singh B, Palimar V, Arun M, Mohanty MK (2008) Profile of Trauma related Mortality at Manipal KUMJ 6(23): 393-398.
-
Pathak A, Desania NL, Verma R (2008) Profile of road traffic accidents & head injury in Jaipur. J Indian Acad Forensic Med 30(1): 6-9.
-
Singh D, Kumaran M, Singh SP, Goel S (2014) Profile of Road Traffic Fatalities in Adults A 40 Year Study in Chandigarh Zone of North West India. Indian Acad Forensic Med 36(1): 47-51.
-
Reddy A, Balaraman R (2016) Epidemiological study of Two wheeler Accident Victims In Rural South India. Indian Acad Forensic Med 38(1): 32-35.
-
Akhade SP, Rohi KR, Parchake MB, Kachare RV, Kadam S, et al. (2015) Socio-demographic Profile of Head Injury Victims of Fata Vehicular Accidents in Semi Urban Region of Maharashtra. J Indian Acad Forensic Med 37(2): 119-123.
-
Kumar L, Agarwal S, Singh T, Garg R (2014) Patterns of Head Injury at Tertiary Care Hospital. International Journal of Scientific Study 5: 5-8.
-
Shankar V, Venkateshan M (2015) Pattern of Injuries Due to Fatal Road Traffic Accidents from Rural Chennai. Online International Journal of Medical and Social Sciences 1(2): 30-36.
-
Katageri S, Sharma R, Govindaraju HC, Singh AK (2015) Pattern of Injuries in Road Traffic Accidents at Chitradurga Karnataka: An Autopsy Based Study. J Indian Acad Forensic Med 37(2): 172-175.
-
Jakkam S (2013) Pattern of Injuries in Fatal Road Traffic Accidents in Warangal Area. India Indian Acad Forensic Med 35(1): 55-59.
-
Dandona R, Mishra A (2004) Deaths due to road traffic Crashes in Hyderabad City in India. Need for strengthening Surveillance Natl Med J India 17(2): 74-79.
-
Singh YN, Bairagi KK, Das KC (2005) An epidemiological study of road traffic accident victims in medicolegal autopsies. JIAFM 27(3): 166-169.
-
Sharma D, Singh US, Mukeerji S (2011) A study on road traffic accidents in Anand –Gujarat. Health line 2(2): 12-15.
-
Gopal BK, Ahamed A, Ahamed F, Tonse SB (2015) Pattern of Skull Fractures due to Blunt Force. JKAMLS 24(2): 27-31.
-
Kumar RR (2014) Patterns of Head Injuries in Road Traffic Accidents Involving Two wheelers: An Autopsy Study JKAMLS 23(1): 9-14.
-
Rupani R, Varma A, Rathore S (2013) Pattern of Skull Fractures in Cases of Head Injury by Blunt Force. J Indian Acad Forensic Med 35(4): 336-338.
-
Tandle RM, Keoliya AN (2011) Patterns of Head Injuries in fatal road traffic accidents in a rural district of Maharashtra–Autopsy based Study. J Indian Acad Forensic Med 33(3): 171-176.
-
Garbarino S, Nobili L, Beelke M, Fabrizio DC, Franco F (2001) The contributing role of sleepiness in highways vehicle accidents. Sleepiness And Vehicle Accidents 24: 203-206.
-
Manish K, Jothi NS, Gurudatta SP, Vijaykumar BJ (2012) Fatal head injuries in road traffic accidents in and around Davanagere: A Prospective Study. Indian Journal of Forensic Medicine & Pathology 5(2): 61-65.
- Forensic Implications of Adverse Drug Reactions in Schizophrenia A Case Series
- Narcotics and Digital Forensics: Bridging Crimes in the Digital Age
- Ethics in Forensic Psychiatry: Principles, Dilemmas, and Human Rights
- Impact of Acute Stress on Attentional Orienting to Social Cues
- Head Injury and Intracranial Hemorrhage in Western Region of Libya
- A Forensic Study on Handedness: Examination of Handwriting Features in Right and Left Handed Writers