Prediction of Gender and Stature by Footprint Analysis in Punjab Population, Pakistan
Measurement of stature and sex determination is the essential step in identification of unknown human remains. Stature and sex are important attributes of personal identity. In deadly disasters, isolated body parts and extremities are recovered as remains which utilized to ascertain identity of an individual with personal attributes like gender and stature. Footprint is used as an anthropometric indicator for forensic purposes, devising regression formulae for both males and females and finding out sexual dimorphism. The recent study was carried out with aims to find the relationship between footprints and stature and its use for sex determination. The sample (n=200) was included with equal amount of males and females between 18-30 years age in Punjab, Pakistan. Samples were taken on standard A4 sheets and stadiometer was used to record height. The statistical analysis indicated that there is a strong positive relationship between stature and footprints. The discriminant function analysis successfully classifies foot breadth for males and females. The highest correlation was found for both male and females with foot length. Regression equations for stature estimation were calculated separately for males and females.
Introduction
Forensic identification using anthropometry is well known for identifying suspect’s gender, age, race, and even body profile [1, 2, 3, 4]. Foot is considered to be a highly complex part in the human body with 26 bones and a number of synovial joints. Various factors like lifestyle, heredity, climate, population group, age, BMI, biological variances and sex influence the morphology of a human foot. The differences in foot morphology tend to have major implications in terms of forensic anthropology and footwear design. There are several other characteristics of human foot that differ in the two sex [5, 6, 7]. In disaster situations, like a warfare, aircraft crash and explosions, one can only find the parts or segments of human bodies that is why the identification is not possible. In such cases, feet dimensions are often applied for prediction of stature, gender and this relationship has been established and supported in numerous studies [5, 8, 9, 10, 11, 12, 13, 14, 15, 16, 17]. Foot impressions are very helpful in criminal, legal, and medical purposes. Every individual has distinct foot patterns thus making every individual’s foot significantly different from others. Determination of an individual’s height and gender is one of major characteristics of footprint that appealed numerous researchers [18, 19].
Footprint is the most reliable physical evidence, particularly in criminal cases that play key role in establishing a person’s identity. A relation can be formed by observing and comparing footprint morphology with perpetrator. These barefoot prints can be present as a two-dimensional print or three-dimensional imprint depending on the substrate on which they were impressed and various techniques are introduced to distinguish the prints in question. Bare footprint analysis was used to provide a wide variety of information about various print trends. Various approaches and indices used to test footprints for comparison and identification purposes. Footprint evaluation and analysis is not only of primary importance in forensic testing but also helps in clinical examination and elucidation of various podiatric disorders [20, 21].
Criminal investigations were carried out with the help of podiatrists whenever crime scenes entailed pedal evidences. The principle point of the forensic podiatrist is such case is to contribute towards the foundation of the identity of the suspects based on the evidence. One type of the pedal evidence is footprints that were regularly recouped at the wrongdoing scenes. Estimation of stature from footprints frames, a noteworthy parameter of individual recognizable proof in forensic examinations [22, 23]. A significant parameter for forensic examinations is estimating the person’s stature. Footprint analysis provides useful information in the analysis of the criminal scene and helps determine the suspected stature [7]. Stature estimation is considered as a significant parameter in the process to identify an individual with the help of skeletal dimensions. Multiple body parts and skeletal remains have been proven vital and positively correlated to stature based on previous premises. In catastrophic scenarios, the concept can be utilized to establish one important part of basic biological profile of unknown remains [24].
Sex estimation is an important aspect that helps identifying a person’s identity in a forensic investigation. A study was conducted in Punjab, Pakistan to a previously known premise for sex determination called Naïve Bayes algorithm. The study evidently proved its reliability and also compared it to other machine learning method i.e. J48, Random Forest, Random Tree, and REP Tree etc [25, 26]. Identifying the gender from a body which isn’t fully decomposed and imprints of various parts of the body is a recurrent subject in forensics. Several researches have been conducted to determine sex from the skeletal remains and they concluded that males have higher foot length and breadth and foot prints whereas foot index and foot print index are relatively high among females [27].
Height and sex from various parts of the body help solve human identity-related crime mysteries. Similarly, if found at the crime scene, foot or shoe prints may provide clues about the person’s height and sex that helps determine the suspect’s partial identification.
Methods
This research was conducted on 200 subjects, (100 males and 100 females) from the age range 18-30 years in Punjab, Pakistan. The samples were taken with informed consent and population was explained with the objectives and methods of the study. The entire individual was asked to wash and clean their feet with soap and clean towel. A clean glass slab of 8mm with the 1.5x 0.8ft dimensions was used. A small amount of duplicating black ink was smeared on the glass slab and asked the individual to step with their ‘dominant foot’s respectively [28]. The footprints were recorded with minimal pressure standard A4 printing quality white sheets.
The stature of each individual was recorded and for anthropometric measurement foot length and breadth were measured separately in centimetres. The measurements were recorded multiple times in order to ensure the accuracy of mean calculation.
Stature
From the highest point in vertex and the platform of stadiometer was considered the vertical distance between them. The subject was must to stand erect, barefoot on a level platform with the head in Frankfurt horizontal plane with eyes looking forward. The bar was touched by the heel and the feet was also touched each other. Moreover, arms were hanged by the side.
Foot Length
During measurement of foot length, the distance from the heel to the most distal part of the longest toe was considered the length of foot.
Foot Breadth
The breadth of foot was obtained by measuring a distance between the lateral aspect of head of fifth metatarsal and the on the medial aspect of head of first.
Results
The statistical analysis indicated correlation between the stature and the parameters studied in males and females were found to be positive and statistically highly significant. The discriminant function analysis successfully classifies foot breadth for males and females.
The highest correlation was found for both male and females with foot length. Regression equations for stature estimation were calculated separately for males and females.
Followings observations of the study were arranged in tabular form after statistical evaluation.
The age of study population ranged between eighteen and thirty years for both male and females. Table 1 shows the distribution of age in the study population. The mean age of female was 25.4 and male was 25.9 years.
| MALES | FEMALES | |
|---|---|---|
| N | 100 | 100 |
| Mean | 25.900 | 25.4700 |
| Median | 26.000 | 26.000 |
| Standard Deviation | 3.07975 | 2.99985 |
| Range | 10.00 | 10.00 |
| Minimum | 18.00 | 18.00 |
| Maximum | 30.00 | 30.00 |
Table 2: showing age distribution among the population.
Table 2 shows statistics for parameters studies in Males. The stature was 173.46.4 cm and ranged between 156 cm to 188 cm. Similarly the foot length was 24.391.31 cm and ranged between 20.8 cm to 26.7 cm and the foot breadth was
9.008.555 cm and ranged between 7.7 cm to 11.4 cm.
| FOOT LENGTH | BAB | MEAN STATURE | |
|---|---|---|---|
| N | 100 | 100 | 100 |
| Mean | 24.393 | 9.008 | 173.417 |
| Std. Error of Mean | 0.1317 | 0.0555 | 0.6441 |
| Median | 24.4 | 9 | 173 |
| Mode | 25 | 9 | 171 |
| Std. Deviation | 1.3167 | 0.555 | 6.441 |
| Variance | 1.734 | 0.308 | 41.487 |
| Range | 5.9 | 3.7 | 32 |
| Minimum | 20.8 | 7.7 | 156 |
| Maximum | 26.7 | 11.4 | 188 |
Table 1: Descriptive analysis of Parameters studies (Males).
The figure 1 shows the impact of foot length on the height of male respondents. On the basis of the above figure, it can be identified that there is a positive impact of foot length on the height of males.
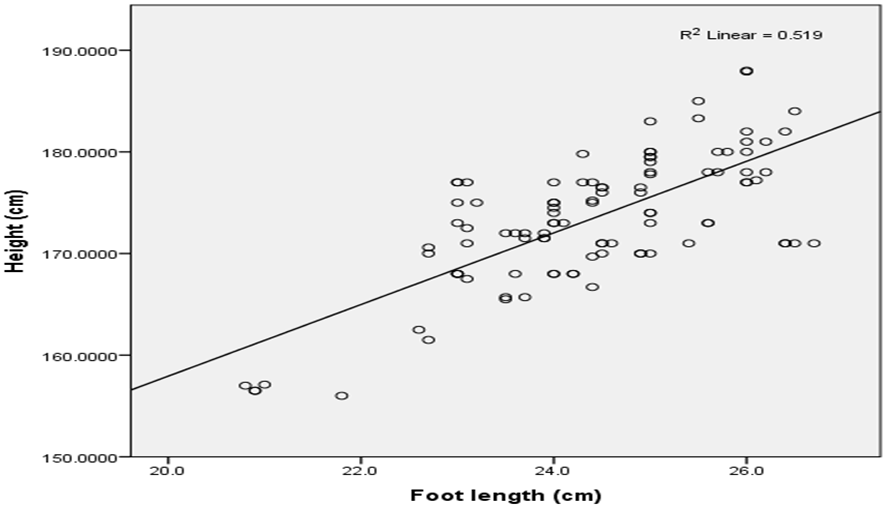
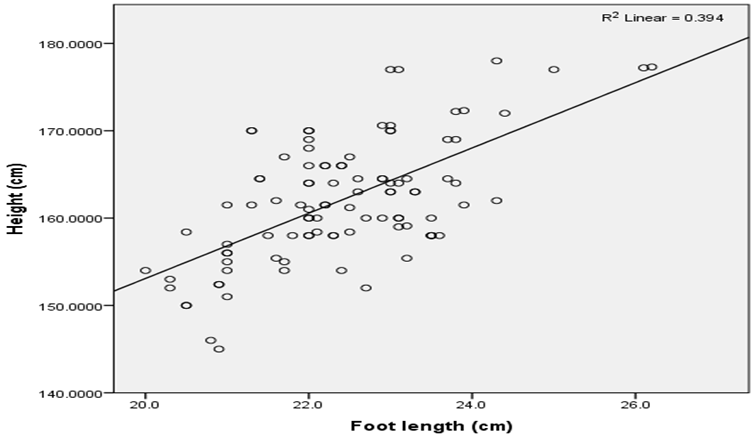
Table 3 shows statistics for parameters studies in females. The stature was 162.086.9 cm and ranged between 145 cm to 178 cm. Similarly the foot length was 22.41.17 cm and ranged between 20 cm to 26.2 cm and the foot breadth was 8.35.41 cm and rang between 7.4cm to 9.7 cm.
| FOOT LENGTH | BAB | MEAN STATURE | |
|---|---|---|---|
| N | 100 | 100 | 100 |
| Mean | 22.408 | 8.355 | 162.088 |
| Std. Error of Mean | 0.1174 | 0.0419 | 0.6986 |
| Median | 22.3 | 8.4 | 161.5 |
| Mode | 22 | 8.5 | 158 |
| Std. Deviation | 1.1741 | 0.4191 | 6.9863 |
| Variance | 1.379 | 0.176 | 48.808 |
| Range | 6.2 | 2.3 | 33 |
| Minimum | 20 | 7.4 | 145 |
| Maximum | 26.2 | 9.7 | 178 |
Table 3: Descriptive analysis of Parameters studies (Female).
The figure 2 shows the impact of foot length on height of female respondents under the observations. On the basis of above figure, it can be determined that there is a positive impact of foot length of females on their height.
A comparison of different parameter readings reveals that all parameters have higher values in men than women. A paired sample t test was used to determine statistical variations between male and female findings.
The test findings, as shown in Table 4, indicates that the differences between males and females were statistically highly significant (p<0.01).
| Paired Samples | T | F | Sig.-(2 tailed) | |
|---|---|---|---|---|
| Pair 1 | MALE FOOT LENGTH-FEMALE FOOT LENGTH | 10.829 | 99 | .000 |
| Pair 2 | MALE FOOT BREADTH-FEMALE FOOT BREADTH | 8.999 | 99 | .000 |
| Pair 3 | MALE HEIGHT-FEMALE HEIGHT | 12.188 | 99 | .000 |
Table 4: Paired t Test sharing statistical difference between Males/Females. **Statistically Highly Significant
Table 5 shows correlation between stature of individual and parameters studied. All parameters exhibit statistically highly significant (P>0.001) positive correlation with stature.
| Pearson Correlation | Sig. (2-tailed) | |
|---|---|---|
| MALE FOOT LENGTH | .720** | .000 |
| FEMALE FOOT LENGTH | .628** | .000 |
Table 5: Correlation between Stature and Parameter studied (MALES/FEMALES). ** Correlation is significant at the 0.01 level (2-ta
Regression analysis of the observations was conducted separately for each sex, as statistically significant discrepancies were observed between these two classes, as well as for each parameter examined.
Table 6 exhibit linear regression equations with both male and female parameters. The equations also show normal estimation error (SEE). In the SEE, the predicted height of males varies from the recorded stature at ± 4.909cm and female height varies from recorded stature at ±5.4653 cm. In the approximate stature, a low value implies greater reliability. The foot length indicates a lower value in males and females increases the efficacy of stature estimation. The interpretations suggested that regression equations can predict stature with minimal error of estimation.
Sex Determination Discriminant Analysis
Footprint measurements were compared for bilateral and sex differences using unpaired t tests. Sexually dimorphic measurements were subjected to stepwise multivariate discriminant analyses. The discriminant function (D) for the determination of sex from footprint measurements is given as: D=a+∑biXi Where in this model D is used for discriminant score, a and bi represent the coefficients of the discriminant function and Xi represents the breadth at Ball. The discriminant functions were evaluated considering the Wilks’ lambda, eigenvalue and canonical correlation. The decision rule for sex discrimination was based on sectioning points (S) derived for each discriminant function. An individual was classified as male if the value of the discriminant function (D) was greater than S. If the value of D was lesser than S, the individual was classified as female.
- The descriptive analysis for Ball Breadth in both males and females are shown in Table 6. By applying t-test we can say that both males and females are statistically significant differences were observed between Breadth in both dimensions because the significant.
- MALE HEIGHT= 87.468+3.524 *Male foot length ± 4.909
- FEMALE HEIGHT= 78.373+3.736* Female Foot Length
- ±5.4653
Table 6: Linear Regression Equations (MALES/FEMALES).
The results of the stepwise discriminant function analysis are presented in Table 7. For male and female Breadth at Ball respectively, the discriminant functions with the least Eigenvalues and highest Wilks’ lambda values were produced by breadth at ball in both genders. In table 7, a and b are the coefficients of discriminant function for male and female. BABm representing the Breadth at Ball in male, whereas BABf are used for Breadth at Ball in female. Stepwise discriminant function analysis of all the breadth retained both male and female.
| N | 100 | 100 | 200 |
|---|---|---|---|
| Mean | 9.01 | 8.35 | 8.68 |
| Median | 9 | 8.4 | 8.6 |
| Mode | 9 | 8.5 | 8.5 |
| St-deviation | 0.55 | 0.42 | 0.59 |
| T | 162.31 | 199.36 |
Table 7: Classification group membership in (%).
| Function | Parameter | A | b | C | S | Wilks lamba | Eigen value |
|---|---|---|---|---|---|---|---|
| 1 | Breadth | -17.65 | 0.034 | 0.555 | -1.178 | 0.692 | 0.445 |
| 2 | BABm | -168.47 | 7.25 | 0.274 | -1.739 | ||
| 3 | BABf | -145.03 | 4.55 | 0.726 | -1.42 |
Table 8: Classification group membership in (%).
Table 7b: Stepwise multivariate discriminant function analysis of Breadth at Ball.
Discriminant function analysis indicated that an individual’s sex could be predicted from their Breadth at Ball (table 8). The accuracy of the discriminant functions varied from 76% to 87.3%. In the present study, the most accurate discriminant functions were produced by using Breadth at ball of right footprints respectively. Stepwise
multivariate discriminant function analysis selected both BABm and BABf of Ball Breadth as the best combination of footprint dimensions for optimum sex discrimination. The stepwise analysis correctly classified 76% and 87% of cases into their sex groups’ males and females respectively. The discriminant functions can be used in conjunction with individualizing characteristics of footprints to achieve a perfect or near-perfect accuracy of sex determination during forensic investigations. The present study is limited by its relatively small sample size n = 100 (male=100, female=100), thus the results cannot be generalized. Nonetheless, these preliminary results provide the baseline for elaborated studies in the future.
| male | Female | Total | |
|---|---|---|---|
| Male | 76 | 24 | 100 |
| Female | 13 | 87 | 100 |
Table 9: Classification group membership in (%).
Discussion
The findings of the present study suggest that the footprints can be successfully used by law enforcement authorities and forensic scientists for estimating the stature and sex determination. The derived formula is population specific. The present research successfully determined the effectiveness and durability of footprint measurements for the assessment of stature and sex. The samples were drawn from random sampling in Punjab population. There are several studies of similar nature have been conducted in the field of anthropometry.
The male sample showed higher mean values in all parameters than females. Other stature estimation and sex determination studies have also reported higher values in males. Many studies were carried out to find the degree of sexual dimorphism of foot measurements. These statistically significant differences may be due to environmental factors like climate, nutrition, landscape etc. As far as bilateral asymmetry is concerned, male sample showed statistically significant asymmetry. But there are some studies in past in which female foot breadth have statistically higher asymmetry [11].
As it was reported in earlier studies, maximum foot length (From the most anterior point of heel Pternion projecting the longest toe Acropodian) predicts higher correlation with the stature. Thus, in present study the maximum foot length was used as a predictor to estimate stature. Maximum foot length showed statistically significant positive correlation with the stature. The relatively standard estimate of error of foot length in males (±5.4653) and females (±4.909) ensure better accuracy in stature estimation.
A positive correlation is evident between foot length and stature in all studies ranges between 0.6 to 0.8 males and females respectively. This shows that foot length is valuable parameter in stature estimation. The value of correlation coefficient as obtained in present study was r = 0.720 for males and r =0.628 for females, which is lower as compared to the past studies. The difference may impute to environmental and genetic causes. The results of present study showed similar to the results of Lee’s research that analysed the feet of Taiwanese men and women [29, 30]. While, the variables difference between the genders showed weak estimation accuracy and correlation coefficients with height. Among various parts of foot, the recent study results match those of previous studies who establish that FL is strongly related to statures. In a previous study of with 249 Turkish individuals, FL for men r = 0.749; for women r = 0.67811. This study also emphasized a strong relationship of the foot length with the foot breadth, malleolus height, and navicular height [31]. In Hemy’s research definitely emphasized that Foot Length’s relationship with Stature had higher correlation related to foot breadth and foot heel breadth. Also, the correlation coefficient for foot length was higher than coefficient for the foot heel and the toe tips measurements. Therefore, on the bases of the results of previous studies and this study, foot length is the most discriminating foot dimension among other tentative dimensions of foot [32].
In this study, using different foot dimensions, a regression model was imitative for stature determination, and estimation of gender. The regression analysis only for foot length was show to be the most reliable predictor. The R-squared for men was 0.567 and for women, 0.188. With these dimensions it was possible to create a comparative regression analysis model for previous research of different nationalities foot length. The regression analysis model for Korean men showed an R-squared of 0.567 and a SEE of ±4.332 cm. The R2 of the regression analysis for FL alone for Korean females was 0.185, which was lower to Malaysians (0.572), West Australians (0.544), Turkish subjects (0.549), and Indians (0.197) where the same statistic of the same regression model applied. While Pakistani female Foot length R2 was 0.628 which is more than that the previous study. These results showed, as compared to previous study that accuracy for Pakistan males foot length prediction was higher than that for Korean, Indian, Turkish, West Australian, and Egyptian subjects [30, 31, 32, 33, 34]. While Korean female foot length accuracy less than that Indian, Turkish, West Australian, and Egyptian females but Pakistani Punjab females foot length accuracy higher than all of the above population studies. There might be many reasons of Korean female’s foot length less than other Populations female. First, the Korean research female participants differed by age more than did the female participants in the foreign groups. Additionally, because many younger Korean females have had the tendency to put on high heels and pointed shoes, which may cause variation of features of the foot, the foot measurements could be relatively smaller [35]. That may affect prediction accuracy. For estimating height based on the foot, it was better to use length-related variables such as FL, PGL, PMTL, PMFL rather than variables of breadth and height. This result was similar to the findings of Turkish Study with Turkish subjects in which foot length (FL) was the most effective variable with which to create a prediction model [31].
The widest part of dominant foot (Breadth at Ball) proved reliable by discriminant function analysis. The study developed stepwise multivariate model for breadth at ball and classifies sex 76% to 87.3%. The presence of positive linearity between the study variables and stature facilitates formation of regression equation which can be successfully utilized for stature estimation in studied population.
This research focused on only the Punjab population. Thus, the accuracy of these formulas will be maintained only when applied for to Punjab population or similar ethnic groups that have similar physical characteristics. Although all of the subjects were asked to stand while maintaining balance on both feet, the imbalance may affect measurement. Although several studies have been conducted for stature estimation from foot dimensions, the present study is not comparable to then as these studies were conducted on homogenous population. Due to the influence of genetic and environmental factors on the height of individual results may differ.
Conclusion
Conclusively, anthropometry helpful for estimation of a person’s biological profile like gender, stature, ethnicity and age. The recent study was also emphasized estimation of the gender with a measurement of footprints. All Statistical analysis indicated the bilateral variation was significant for all the measurements (P< 0.01). The statistical analysis using paired sample ‘t’ test shows that the statistical difference between males and females is highly significant for all the measurements (p <0.01). The statistical analysis also indicated that the correlation between the stature and various parameters studied in males and females were found to be positive and statistically highly significant. The accuracy of the discriminant functions varied from 76% to 87.3%. In the present study, the most accurate discriminant functions were produced by using Foot breadth of footprints respectively.
References
-
Robertson J (2012) Forensic science, an enabler or dis- enabler for criminal investigation? Australian Journal of Forensic Sciences 44(1): 83-91.
-
Robertson J, Kent K, Wilson Wilde L (2013) The development of a core forensic standards framework for Australia. Forensic Science Policy & Management: An International Journal 4(3-4): 59-67.
-
Ross A (2012) Forensic science in Australia: Where does Australia sit in relation to trends and issues in the international context?. Current Issues in Criminal Justice 24(1): 121-129.
-
Hrdlička A (1952) Practical anthropometry. Wistar Institute of anatomy and biology.
-
Atamturk D (2010) Estimation of sex from the dimensions of foot, footprints, and shoe. Anthropologischer Anzeiger 68(1): 21-9.
-
Krishan K (2007) Anthropometry in forensic medicine and forensic science-’Forensic Anthropometry’. The Internet journal of forensic science 2(1): 95-97.
-
Krishan K (2008) Estimation of stature from footprint and foot outline dimensions in Gujjars of North India. Forensic science international 175(2-3): 93-101.
-
Fernando R, Vanezis P (1998) Medicolegal aspects of the Thai Airbus crash near Kathmandu, Nepal: findings of the investigating pathologists. The American journal of forensic medicine and pathology 19(2): 169-173.
-
Robb N (1999) 229 people, 15 000 body parts: pathologists help solve Swissair 111’s grisly puzzles. Cmaj 160(2): 241-243.
-
Abledu JK, Abledu GK, Offei EB, Antwi EM (2015) Determination of sex from footprint dimensions in a Ghanaian population. PloS one 10(10): e0139891.
-
Geetha G, Swathi SAA (2015) Estimation of stature from hand and foot measurements in a rare tribe of Kerala state in India. Journal of clinical and diagnostic research: JCDR 9(10): HC01-HC04.
-
Giles E, Vallandigham PH (1991) Height estimation from foot and shoeprint length. Journal of Forensic Science 36(4): 1134-1151.
-
Krishan K, Sharma A (2007) Estimation of stature from dimensions of hands and feet in a North Indian population. Journal of forensic and legal medicine 14(6): 327-332.
-
Mohite PM, Keche AS, Mohite D, Keche H (2015) Correlation of the dimensions of hand & feet with stature of an individual: a study on Central Indian adults. Journal of Indian Academy of Forensic Medicine 37(2): 160-164.
-
Shroff G, Mandhana V (2015) Role of hand and foot length and its correlation of both sexes in ergonomics. Indian Journal of Anatomy 4(2): 69-72.
-
Sutay S, Surwade V, Tiwari UK, Singh NK, Chauhan DS (2014) Study of stature by foot length measurement in Madhya Pradesh. Int J of Bioassays 3(11): 3441-3444.
-
Lalwani R, Gupta H, Athavale S, Kotgirwar S (2019) Estimation of stature and sex by foot length measurements using linear regression and discriminant function analysis, respectively: A study in central india population. National Journal of Clinical Anatomy 8(1): 014-017.
-
Reel S, Rouse S, Vernon W, Doherty P (2012) Estimation of stature from static and dynamic footprints. Forensic science international 219(1-3): 283.e1-283.e5.
-
Okubike EA, Ibeabuchi NM, Olabiyi OA, Nandi ME (2018) Stature estimation from footprint dimensions in an adult Nigerian student population. Journal of Forensic Science and Medicine 4(1): 7-17.
-
Mukhra R, Krishan K, Kanchan T (2018) Bare footprint metric analysis methods for comparison and identification in forensic examinations: A review of literature. Journal of forensic and legal medicine 58: 101-112.
-
Asadujjaman M, Al Noman SN, Molla MBA (2020) Stature estimation from foot anthropometric measurements in Bangladeshi population. Irish Journal of Medical Science 189(1): 365-372.
-
Krishan K, Kanchan T, Di Maggio JA (2015) Emergence of forensic podiatry—a novel sub-discipline of forensic sciences. Forensic science international 255: 16-27.
-
Moorthya TN, Yinb TY (2016) Research article estimation of stature from handprint anthropometry of malaysian chinese for forensic investigation. Indonesian Journal of Legal and Forensic Sciences 6: 1-5.
-
Krishan K, Kanchan T, Menezes RG, Ghosh A (2012) Forensic anthropology casework—essential methodological considerations in stature estimation. Journal of forensic nursing 8(1): 45-50.
-
Awais M, Naeem F, Rasool N, Mahmood S (2018) Identification of sex from footprint dimensions using machine learning: a study on population of Punjab in Pakistan. Egyptian Journal of Forensic Sciences 8(1): 1-9.
-
Mukhopadhyay PP, Das SP, Chowdhuri S (2018) Determination of Sex from Footprint Dimensions in Contemporary Indian Bengali Population: A Pilot Study. Arab Journal of Forensic Sciences & Forensic Medicine 1(7): 820-828.
-
Walia S, Modi BS, Puri N (2016) Sexual dimorphism from foot dimensions and foot prints in Haryanvi Jat population. Int J Anat Res 4(1): 2142-2147.
-
Melick Nv, Meddeler BM, Hoogeboom TJ, Sanden MWGNv, Cingel REHv (2017) How to determine leg dominance: The agreement between self-reported and observed performance in healthy adults. PloS one 12(12): e0189876.
-
Lee YC, Wang MJ (2015) Taiwanese adult foot shape classification using 3D scanning data. Ergonomics 58(3): 513-523.
-
Fawzy IA, Kamal NN (2010) Stature and body weight estimation from various footprint measurements among Egyptian population. Journal of forensic sciences 55(4): 884-888.
-
Zeybek GI, Ergur, Demiroglu Z (2008) Stature and gender estimation using foot measurements. Forensic Science International 181(1-3): 54.e1-54.e5.
-
Hemy N, Flavel A, Ishak NI, Franklin D (2013) Estimation of stature using anthropometry of feet and footprints in a Western Australian population. Journal of forensic and legal medicine 20(5): 435-441.
-
Kanchan T, Krishan K, ShyamSundar S, Aparna KR, Jaiswal S (2012) Analysis of footprint and its parts for stature estimation in Indian population. The foot 22(3):175-180.
-
Hisham S, Mamat CR, Ibrahim MA (2012) Regression analysis for stature estimation from foot anthropometry in Malaysian Chinese. Australian Journal of Forensic Sciences 44(4): 333-341.
-
Jung S, Lee S, Boo J, Park J (2001) A classification of foot types for designing footwear of the Korean elderly. Proc of the 5th Symp on footwear biomechanics.
- Forensic Implications of Adverse Drug Reactions in Schizophrenia A Case Series
- Narcotics and Digital Forensics: Bridging Crimes in the Digital Age
- Ethics in Forensic Psychiatry: Principles, Dilemmas, and Human Rights
- Impact of Acute Stress on Attentional Orienting to Social Cues
- Head Injury and Intracranial Hemorrhage in Western Region of Libya
- A Forensic Study on Handedness: Examination of Handwriting Features in Right and Left Handed Writers