Forensic Discrimination of Blue Ballpoint, Gel and Oil-Gel Pens: Application of Chemometrics to ATR-FTIR Data
The combination of advanced techniques with multivariate analysis methods are being used with great confidence by forensics experts due to their high precision and accuracy. The prime objective of present work was to explore the potential of chemometric tools in discriminating and predicting the blue pen inks when applied on Attenuated total reflectance Fourier transform infrared (ATR-FTIR) data of pen strokes of different brands and models commercially available in Pakistani markets. The pen strokes on fine A4 paper and recycled A4 paper were obtained from 86 samples including ballpoints, gel, oil- gel and roller ball pens. ATR-FTIR spectra were first characterized for different functional groups present in ink pigments however, they were apparently indistinguishable having some common functional groups. After spectra preprocessing the principal component analysis (PCA) and agglomerative hierarchical cluster analysis (AHC) showed that pen strokes could be distinguished. Both PCA and AHC analyses showed that ballpoints and gel pen could be discriminated and grouped separately. PCA analyses also showed the discrimination between local and foreign brands of ballpoints. Finally, classification method partial least squares-discriminant analysis (PLS-DA) was successfully applied for the classification and subsequently for the identification of type of pen used in personnel’s signature to mimic a forensic case. To evaluate PLS-DA classification performance, the classification parameters such as sensitivity, specificity, accuracy and precision were also derived from confusion matrix. Overall, this work emphasized the worth of multivariate analysis in classification and prediction of type of writing pen in a document as a forensic study.
Introduction
The relationship between ink and paper has a long history, as this is used to communicate messages and knowledge. The physical form of this relation, ‘a document’, is a source of information which could be an ordinary or a legal [1]. Sometime, a valuable document for example a letter, contract, bank cheque, will or a deed may be forged to get benefit. Subsequently, a criminal investigation is needed and forensics analyses (physical and chemical) are required to examine authenticity of suspected document. Alteration or forging in a document may be investigated in the primary and secondary materials of a document. Primary materials are ink deposits and its support i.e., paper, polymers, cardboards while secondary materials are correcting materials, erasure residue, stain etc. [2]. An investigation could be focused in identifying, distinguishing, discriminating and classifying the pen/ballpoint inks used in a questioned document. In addition to this, determining the source of inks, backdating of inks and ink interaction with different type of papers are also key parameters which contributes in checking the authenticity of document.
Among modern writing instruments, ballpoint pens are frequently used which usually contain oil based inks having major components dyes, pigments, resin, additives and solvents and each one of these has its own function as described by Ezcurra, et al. [3]. The chemistry of ink changes when it is applied to the paper [4, 5] and of course it depends on the ink’s composition which is hardly known to investigators. However, presence of dyes, pigments, additives and solvents in an ink spot certainly helps in classification and discrimination of ballpoint pens ink of different brands.
In past few years, literature survey shows the analysis of questioned documents; the studies were focused on ballpoint pens analysis, differentiation of the ink and ink dating [6]. The analytical techniques used in the investigation of ballpoint ink involve destructive and non-destructive approaches. The separation techniques like ion pair chromatography [7], high performance liquid chromatography (HPLC), gas chromatography (GC) coupled with mass spectrometry (MS), capillary electrophoresis and thin layer chromatography (TLC) [2, 8, 9] with prior sample extraction methodologies in appropriate solvents are being applied in ink identification, ageing studies, pigments separation and degradation studies [5, 10, 11, 12, 13, 14, 15]. HPLC of pen inks coupled with chemometrics can be a more powerful discriminating tool for the forensic chemist than using non-destructive techniques alone [16]. In several articles, GC-MS with various sample extractions techniques is used for identification and quantitative analysis of solvents used in inks for ink dating studies [3, 5, 12, 17, 18]. Attenuated total reflectance Fourier transform infrared (ATR-FTIR), near-infrared diffuse reflectance and Raman spectroscopy are highly utilized techniques in forensics analyses when integrity of sample is required. Raman spectroscopy being a chemically selective and non-destructive technique, found to be promising in inks examinations [19, 20, 21, 22]. FTIR spectroscopy is a nondestructive, quick analytical tool for molecular composition and structure analysis of desired material. FTIR spectroscopy with combination of attenuated total reflection (ATR) offers more advantages over the IR spectroscopy of solid and liquid samples. In literature, there are number of research studies reported the use of ATR-FTIR spectroscopy followed by chemometrics for the authentication and discrimination, classification of variety of ballpoint inks of different brands [16, 23, 24, 25, 26, 27], XRF [23], UV- VIS [24], laser desorption ionization mass spectrometry (LDI- MS) [28]. Since, separation and spectrometric techniques in forensics analysis generate a lot of data which is quite difficult to analyze by ordinary methods. Chemometric methods on the other hand, not only extract most useful and relevant information from the raw data generated by above discussed techniques in short time but also help researcher in classification, discrimination and models development [29]. The chemometric methods such as principal component analysis (PCA), cluster analysis (CA), discriminant analysis (DA) and partial least square-discriminant analysis (PLS- DA) are frequently used by scientist in classifying and discriminating the ballpoint inks. Data preprocessing of before application of any chemometric methods produces excellent results especially when classification is required as compared to raw data of generated by ATR-FTIR [30].
In the present study, the chemometric methods combined with ATR-FTIR technique was explored to discriminate blue ink pens available at Pakistani stationery shops. Although, as per authors knowledge only one study found in the literature regarding the classification of red, blue and black pen inks used in Pakistan [8] however, this study was related to fountain pen inks. Therefore, the present study is novel in a sense that in it we have not only classified the blue ballpoint and gel pens by applying chemometric tools PCA, AHC and PLS-DA model but also discriminate local and foreign brands. Moreover, this study also illustrates the capability of a non- destructive technique FTIR and chemometrics to predict the class of pen used in a document to mimic a forensic case.
Materials and Methods
Sampling
In this study, eighty-six samples (blue pens) were purchased from local stationary shops. The collected samples with their codes, description and origin are listed in Table 1. The types of pens include: 1. Ballpoints 48 2. Gel pens 24
3. Oil-gel pens 9 4. Roller-ball pens 5
| No. | Samples | Sample Codes | Number of samples | Origin |
|---|---|---|---|---|
| 1 | Ballpoints | P1 to P48 | 48 | Pakistan (n = 27) China (n = 11) Germany (n = 06) Netherlands (n = 02) Japan (n = 01) India (n = 01) |
| 2 | Gel | P49 to P72 | 24 | China (n = 12) Pakistan (n = 10) India (n = 01) Japan (n = 01) |
| 3 | Oil Gel | P73 to P81 | 09 | USA (n = 05) China (n = 02) Pakistan (n = 02) |
| 4 | Rollerball | P82 to P86 | 05 | Japan (n = 03) Germany (n = 01) UK (n = 01) |
Table 1: Samples blue ink ballpoints with their codes, nature, company and origin.
Ten ink strokes of each pen were uniformly applied on a paper in a circular areas of 1 cm diameter. The ink spots were dried at room temperature and carefully handled during ATR-FTIR analysis particularly finger marks contamination was avoided. Two different types of paper were selected on which the pen inks were applied. The types of papers included: i. Paper 1: A4 brand paper (80 g, 210×297 mm, white) ii. Paper 2: recycled A4 paper (210×297 mm, pale yellow) Furthermore, in order to discriminate ink strokes of local and foreign brand ballpoints, thirty ballpoints of Schneider Germany, ten ballpoints of M&G China and twenty ballpoints PIANO and Mercury Pakistan were also subjected to analysis.
FTIR-ATR
FTIR spectra of each sample were obtained using FTIR- ATR (ThermoScientific Nicolet iS50) Spectrometer. All spectra were scanned for range 400 to 4000 cm-1 with scan rate 12 cm-1 s-1. OMNIC 9.7.43 software of (ThermoScientific) was used to acquire the spectra and for background correction and baseline normalization.
Chemometrics
All chemometric analysis including PCA, agglomerative hierarchical clustering analysis (AHC) and PLS-DA were performed using XLSTAT version 2014.5.03 (Addinsoft) and Origin Pro 2015 (OriginLab Corporation) software. Prior to chemometric analyses all the spectral data was normalized using XLSTAT 2014.
PCA is one of the most frequently used multivariate data analysis tool. It is used to study and visualize correlations between variables. PCA has been applied in the present study to visualize separation /classification of pens of different brands with the help of scores and loadings plots.
CA is an unsupervised classification technique, in which samples having similar characteristics are grouped together. In the first step of AHC, similarity between the samples is calculated using a similarity method. In the second step, similar samples are joined together using a joining method. In this study, the proximity type was similarity and Pearson’s correlation coefficient was used to calculate proximity and unweighted pair-group method was used for agglomeration. The result of AHC analysis is presented in the form of a tree like structure known as dendrogram.
PLS-DA is being effectively used to model the spectral data. PLS-DA not only reduces dimensions of high dimensional data but also performs discriminant analysis [31]. PLS-DA offers an interesting alternative to classical linear discriminant analysis. Through PLS-DA, a model is built utilizing spectral data and the information regarding classes of samples is collected. Subsequently, the model is used to predict the unknown sample class. Herein, PLS2- DA algorithm was used to construct PLS-DA prediction model using XLSTAT software. The whole spectral data of 86 samples was divided randomly into two groups, a calibration set (n = 58) and a validation set (n = 28). The calibration set of samples was used to build the PLS-DA model and validation set of samples was used to validate the model. Later the validated PLS-DA model was applied to predict the class of pen used in signatures of one the authors.
Results and Discussion
Oil-based ink is usually used in ballpoint pens while water-based ink is used in rollerball pens [32]. Water- based ink is more easily absorbed in paper than oil-based. Moreover, viscous ink such as gel-ink is also used in these pens which produces different results on paper and move easily on paper. The different nature of inks makes them distinguishable. However, the difference between oil-based and water-based is not easy to judge by naked eye.
Discrimination by ATR- FTIR Spectra
Depending upon the nature of ink the functional groups such as hydroxyl, carbonyl, amino, nitro, ester or ether groups are expected in FTIR spectra. In addition to these, bands from paper cellulose such as C–H, C–O, O–H stretching, –C–H bending are present [26]. The ATR-FTIR spectra of all sample are shown in Figure 1 of four representative pens from each class. The representative pens were selected randomly. All spectra are apparently indistinguishable and show some common signals. The band around 2920 cm−1, 1420 cm−1 are due to CH stretching and CH2 bending and signals at 1160 and 1104 cm−1 are due to C-O and C-C stretching, which are known to be characteristic peaks of cellulose [33]. Furthermore, bands at 1070-1025 cm−1 show secondary alcohols and peaks at 870 and 712 cm−1 indicates presence of carbonate (calcium) which is used as a filler in paper industry [34]. Apart from signals from paper constituents, all other signals correspond to either organic dyes or additives used in ink. It was difficult to identify and assign each and every peak in the spectra of all pens. However, almost in all spectra, there is a large signal around 3330 cm−1 that may be attributed to OH group present in the ink.
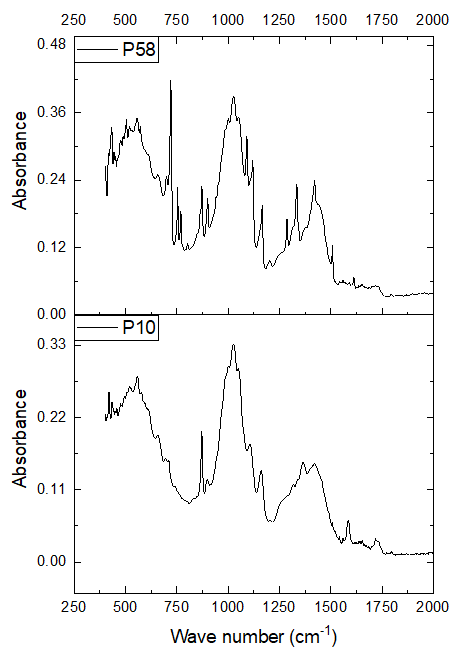
Figure 2 presents the comparison of ATR-FTIR signals of main classes of ballpoint and gel pen on paper-1. It can be seen that band of carbonyl group (C = O) is present at 1720 cm−1 in case of ballpoint pen. Peak around 1165 cm−1 showed presence of C-O-C bond asymmetric bending vibration. The band at 940 cm−1 is observed in Gel and roller ball pen is related to symmetric vibrations of C-O-C which probably indicates the presence of saturated ethers in ink. Furthermore, peak at 1286 cm−1 was found in gel and roller ball pen indicating the presence of aromatic ethers which was not visible in ballpoint and oil gel pens. Similarly, presence of amino groups was found in ballpoint and oil gel samples by signal around 1585 cm−1. Sharp signals of aromatic amino groups (C-N stretching) at 1334 cm−1 was recorded in gel and roller ball pen while signals at 1360 cm−1 was seen in ballpoint and oil gel pen indicating the same C-N stretching for aromatic tertiary amines [35].
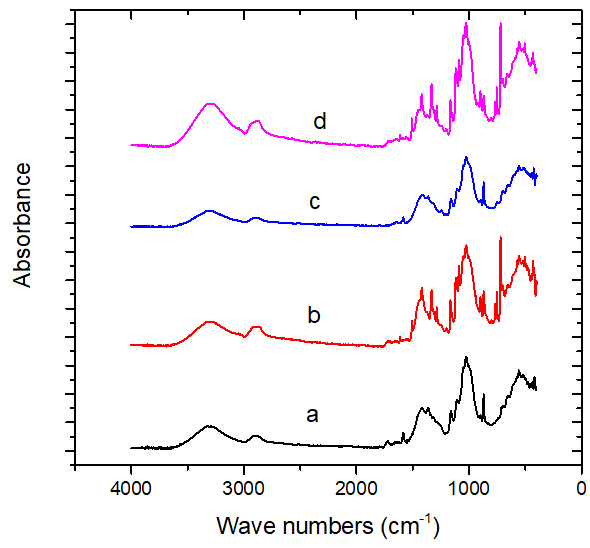
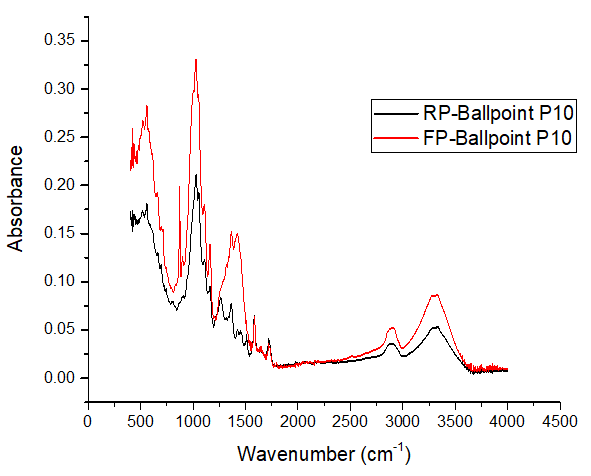
As reported in the literature, crystal violet dye is used as coloring agent in blue ink and shows characteristic absorption peaks at wavenumber 1581 cm–1, 1358 cm–1, 1170 cm–1 and 2917 cm–1 [27], also found in the spectra of ballpoint and oil gel pen more prominently than of gel and roller pen. In case of gel pen peaks at 700 cm–1 and around 750 cm–1 was prominent which indicated the possibility of presence of phenoxyethanol as a solvent used in gel ink. Moreover, substituted aromatic bending vibrations at 695 cm–1 reflected the used of benzyl alcohol as solvent in almost all samples. Band around 1050 cm−1 was also appeared in all samples showed glycols used as solvent. Figure 3 shows the difference of ballpoint ink interaction on two type of papers paper 1 and paper 2. It was obvious that more sharp and strong signals was recorded ballpoint strokes on paper 1 as compared to paper 2. Similar behavior was also observed with other pen samples which are not shown.
(a) (b) Figure 4: Score plots of principal components PC1 and PC2 of pens based on their averaged data with pre-processing on paper 1 (a) and paper 2 (b).
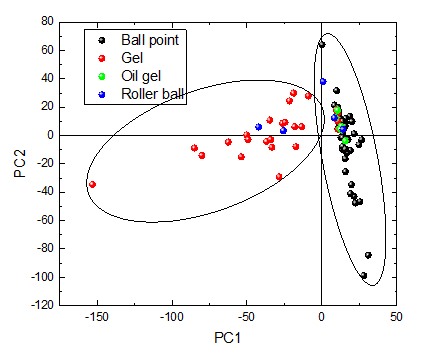
Figure 4a & 4b shows the score plots of PC1 and PC2 of samples strokes on paper 1 and paper 2. A prominent clustering exists between ballpoint pen and gel pen in case of strokes on paper 1, Figure 4a. The PC1 and PC2 components explained 31.93 % cumulative variance. This low explained variance is probably due to large number of peeks in each spectrum. Gel pen were 83.3% correctly grouped with overlapping of roller ball pens (P83, P84). While all ballpoint Briefly, based on FTIR spectra of all samples, there exist differentiation between ballpoint and gel pen. And, oil gen pen samples exhibited similar spectra to ballpoint and rollerball sample’s spectra matched with gel pen samples. This is probably due similar ink composition present in different brands. Although, it is quite difficult to recognize the exact dye / pigment used in the samples under study only by using FTIR spectrum analysis but it is possible to differentiate and classify the sample pens with chemometric tools.
Principal Component Analysis
In PCA, the selected range was from 400 to 2500 cm−1 and the data from 2500 to 4000 cm−1 was ignored as this region was not contributing significantly. The spectrum data was normalized in which lowest Y-axis value is shifted to zero absorbance unit regardless of whether the lowest value is above or below zero and subsequently software (OMNIC) multiplies the spectrum by a scaling factor to make the highest value 1 absorbance unit. To get better classification, the data was further processed by taking second order derivative Savitsky-Golay derivative (7-point window, third polynomial order).
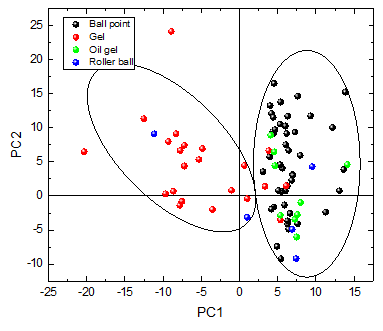
samples were grouped together and all oil gel along with two roller ball pens (P85 and P86) were clustered in it. The correctness of grouping was calculated by taking percent of true samples clustered together over total samples of respective type. It was obvious in case of paper 1, the gel and ballpoint pen were prominently discriminated from each other and all oil gel pen could not be differentiated from ballpoint probably the similar chemical composition of ink (oil based). Similar grouping was observed in case of paper 2. The first two component explained 38.74 % of variability of total data. After excluding the samples (P66, P68 and P13), the separation between ballpoints and gel pen could be seen in Figure 4b. The behavior of ink strokes on different paper types may not be same and therefore, it is possible to distinguish pen strokes of same brands on different type of papers. Figure 5 shows the distribution of ballpoints samples (n = 48) on paper 1 and 2. Two groups were separated with some overlapping at center of score plot which indicated differentiation of papers. Similar distribution in case of gel and oil gel pens was also observed. The separation was clearer in case of oil gel pen Figure 6.
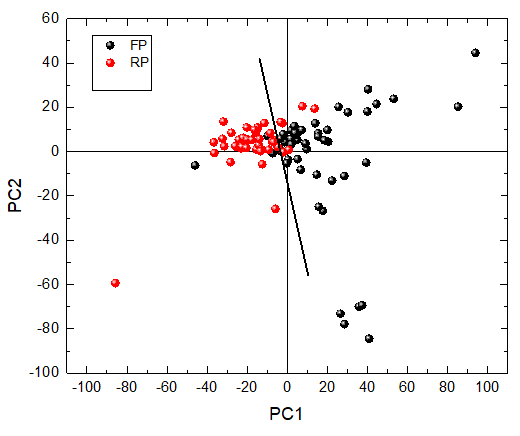
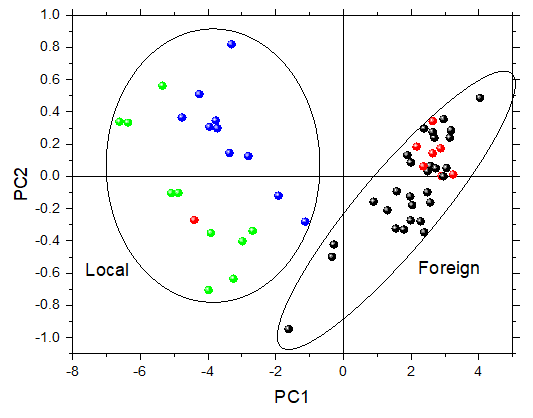
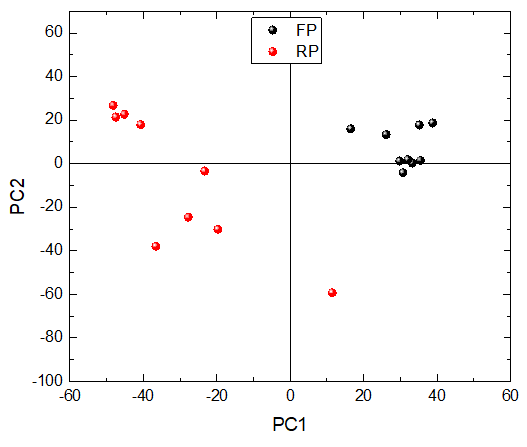
Furthermore, PCA was also carried out to study the discrimination of local brand ballpoints (n=20) with that of foreign (n=40). The ATR-FTIR spectral data was pretreated as explained above and same range of wavenumber was chosen. The scatter plot as shown in Figure 7 explains cumulative variance of 97% of first two principal components. The figure 7 demonstrates the distribution of local and foreign brands into two distinct groups. Interestingly, PCA shows that foreign brands (German and Chinese) were grouped together indicating that their inks might have similar chemical composition. While the local (Pakistani) brands are well separated from those of foreign however, they themselves were distinguishable.
Agglomerative Hierarchical Clustering
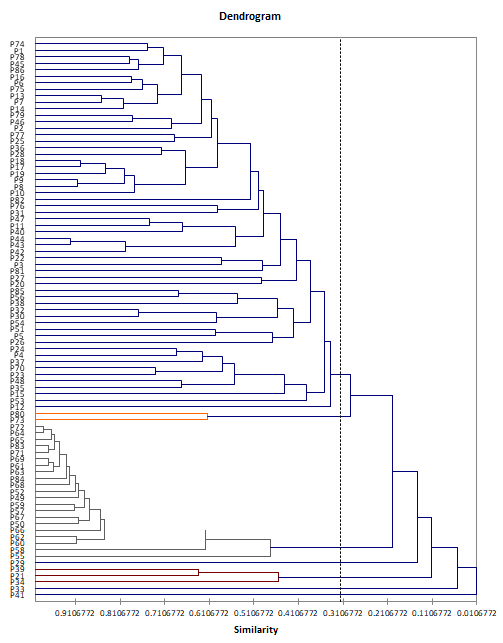
AHC analysis was performed on pens stroke data of both papers 1 and 2. In case of pen strokes on paper 1; the data was distributed in seven classes having two major classes 1 and 6 with 57 and 21 samples respectively. In class 1 out of 57 samples, 42 ballpoint pens were grouped and showed 87.5 % correct classification. In this cluster, 5 gel, 7 oil gel and 3 rollerball pens were also grouped. Three rollerball samples i.e., P82, P85 and P86 which are grouped in class 1, were also clustered with ballpoints as shown in Figure 5a in the PCA study. Similarly, the presence of 5 gel pens (P51, P53, P54, P56 and P70) in class 1 verified the PCA findings which showed matching cluster formation except for sample P56. In class 6, 19 gel and two rollerball pens (P83, P84) were clustered together, indicated 79.1 % correct classification for gel pens. An identical clustering was also found in PCA. It was noted that 7 oil gel pens were grouped in the class 1 and remaining two in class 7. The dendrogram (Figure 8) of AHC shows both classes 1 and 7 are similar and lies closer.
It can be inferred from it that all 9 oil gel pens are similar to ballpoint pens, this could be due to similar nature of ink in pens. While ungrouped samples (P29, P33 and P41) of ballpoint category were classified individually in class 3, 4 and 5 respectively.
(a)
(b) Figure 8: (a) AHC dendrogram obtained by using similarity method on FTIR-ATR preprocessed spectra of ink samples and (b) Dendrogram showing classes of pen samples strokes on paper 1.
In case of paper 2; the data was clustered in five classes with two major classes 1 and 4 having 59 and 22 samples respectively. In this case, the classification of oil gel and rollerball pens was somehow similar to what was observed in case of paper 1 and 95.5% of ballpoint pens were grouped in class 1. The prominent difference from paper 1 which was observed in this case was, the 4 gel pens clustered with ballpoint pens in class 1 found to be different from those clustered in paper 1. While rollerball pens were similar. In total 20 gel pens were clustered in class 4 showing 83.3% correct grouping. Moreover, AHC was able to correctly differentiate only ballpoint pens strokes of paper 1 from paper 2. Eight hierarchical classes with two major classes 1 and 2 having 41 and 46 samples respectively. The results revealed that 83.3% of ballpoints strokes of paper 1 were correctly grouped in class 1 and 93.1% pens of paper 2.
Partial Least Squares-discriminant Analysis
The purpose of PLS-DA was to discriminate the pen samples of various brands and to predict the types of pen used in the signatures to mimic a forensics case. The number of samples in the calibration and validation set are summarized in Table 2. The calibration set was comprised by 32, 18, 4 and 4 (n = 58) samples from ballpoint, gel, oil-gel and rollerball categories, respectively. The validation set (n=28) was having frequencies 16, 6, 5 and 1of respective categories. Table 3 shows the performance of the PLS-DA model in term of confusion matrix for calibration /estimation samples and validation samples on both papers. Moreover, to evaluate classification performance, the classification parameters such as sensitivity, specificity, accuracy and precision were also derived from confusion matrix. The sensitivity can be calculated as:
. . . ) no of true positivesamples sensitivity no of true positivesamples no of falsenegativesamples = + It explains the percentage or proportion of true samples correctly classified. Sensitivity calculation showed that in case of both papers, the major class i.e., ballpoint was 100% correctly classified in calibration and validation set of samples. However, the second major class i.e., gel pen was 88.89% for paper 1 and 84.21% for paper 2 correctly classified in the calibration sets. In validation set, sensitivities values were low as 67% for paper 1 and 60% for paper 2. The PLS-DA model did not classify oil gel and rollerball pen as separate classes both in calibration and validation sets for both papers. This analysis verified the HCA and PCA conclusion as described earlier where oil gel pens were grouped with ballpoints and rollerball pens with gel pens. The class specificity on the other hand shows the ability of the model to reject all other classes. The specificity was calculated by using equation, ( ) . . . no of truenegativesamples specificity no of truenegativesamples no of false positivesamples = + The class specificity values were obviously 100% for oil gel and rollerball pens and was around 70% for ballpoints in calibration set for both paper and further decreased to 33.33% for paper 1 and 28.5% for paper 2 in validation set. The model accuracy for ballpoint classification was more than 85% in calibration set for both papers and dropped to 71% for paper 1 in validation set. Similarly, for paper 2 it was 64% in validation set. While for Gel pen, model classification was found more than 90% both in calibration and validation sets for both papers. Accuracy and precision of the model were also tabulated in the Table 2, which show that accuracy of the modal was more than 90% for gel pen class and above 85% for ballpoints in the calibration sets. However, the ballpoint accuracy was found to71% and 64 % in paper 1 and paper 2 respectively. Similarly, precision of the model was high for calibration set and were low in validation sets of samples.
| Ballpoints | Gel pen | Oil Gel pen | Rollerball | Total | |
|---|---|---|---|---|---|
| Calibration Set | 32 | 18 | 4 | 4 | 58 |
| Validation Set | 16 | 6 | 5 | 1 | 28 |
| Total | 48 | 24 | 9 | 5 | 86 |
Table 2: Samples distribution with respect to their nature as: Calibration and Validation sets.
| For estimation/calibration samples: | |||||||||
|---|---|---|---|---|---|---|---|---|---|
| Paper 1 | Paper 2 | ||||||||
| BP | GP | OG | RP | BP | GP | OG | RP | ||
| BP | 32 | 2 | 4 | 2 | 32 | 3 | 3 | 1 | |
| GP | 0 | 16 | 0 | 2 | 0 | 16 | 0 | 1 | |
| OG | 0 | 0 | 0 | 0 | 0 | 0 | 0 | 0 | |
| RP | 0 | 0 | 0 | 0 | 0 | 0 | 0 | 0 | |
| Total | 32 | 18 | 4 | 4 | 32 | 19 | 3 | 2 | |
| Sensitivity | 100.00 | 88.89 | 0.00 | 0.00 | 100.0 | 84.21 | 0.00 | 0.00 | |
| Specificity | 69.23 | 95.24 | 100.0 | 100.00 | 70.83 | 97.30 | 100.0 | 100.0 | |
| Accuracy | 86.21 | 93.33 | 92.59 | 93.10 | 87.50 | 92.86 | 94.64 | 96.43 | |
| Precision | 100.00 | 88.89 | -- | -- | 82.05 | 94.12 | -- | -- | |
| For validation samples: | |||||||||
| BP | 16 | 2 | 5 | 1 | 14 | 2 | 6 | 2 | |
| GP | 0 | 4 | 0 | 0 | 0 | 3 | 0 | 1 | |
| OG | 0 | 0 | 0 | 0 | 0 | 0 | 0 | 0 | |
| RP | 0 | 0 | 0 | 0 | 0 | 0 | 0 | 0 | |
| Total | 16 | 6 | 5 | 1 | 14 | 5 | 6 | 3 | |
| Sensitivity | 100.00 | 66.67 | 0.00 | 0.00 | 100.00 | 60.00 | -- | -- | |
| Specificity | 33.33 | 100.0 | 100.0 | 96.43 | 28.57 | 95.65 | 100.0 | 100.0 | |
| Accuracy | 71.43 | 92.86 | 82.14 | 93.10 | 64.29 | 89.29 | 78.57 | 89.29 | |
| Precision | 66.67 | 100 | -- | 0.00 | 58.33 | 75.00 | 0.00 | 0.00 |
Table 3: Confusion matrices obtained after applying PLS-DA model and classification parameters.
Furthermore, after the validation of PLS-DA model, its capability was tested to predict the class of pens used in the signatures to mimic a real forensic case. For this purpose, two pens from major classes i.e., from ballpoint and gel pen were selected and signature on paper of type 1 (fine page) as shown in Figure 9. The encircled area (in Figure 9) of both signatures was subjected to ATR-FTIR spectra collection. The spectra were preprocessed as mentioned above and data was used to predict the class of pen used. As shown in Figure 8, the predicted scores values by PLS-DA model. In first case, the highest predicted score value was 0.758 of gel pen and for second case, it was 0.531 of ballpoint class. The predicted classes were true. Therefore, this correct prediction performance capability of PLS-DA model allows to identify the nature/class if any of the pen included in model in the questioned writing.
| X1 | X2 | ||||
| Predicted class | Pr(Ball point) | Pr(Gel) | Pr(Oil gel) | Pr(Roller ball) | |
| X1 | Gel | 0.072 | 0.758 | 0.065 | 0.105 |
| X2 | Ball point | 0.531 | 0.279 | 0.122 | 0.068 |
Conclusion
In this study, the potential use of chemometric tools such as PCA, HCA and PLS-DA were explored to classify and discriminate the nature of blue ink pens. It was difficult to distinguish and classify the nature of ink only by ATR-FTIR spectra. However, it was possible to identify the functional groups originating from different ink’s ingredients of sample pens and paper constituents appearing at different wavenumber bands. Ballpoints and oil gel pens were having similar spectra and gel pen spectra were similar to rollerball spectra. This was probability due to similar nature of ink. The combination of ATR-FTIR data and chemometrics enabled to classify the ballpoints and gel pens as two major classes. PCA and AHC study showed that samples were grouped into two major groups. While oil gel pens grouped into ballpoint class and rollerball pens were clustered with gel pens. AHC analysis showed 87.5 % correct classification for ballpoints and indicated 79.1 % correct classification for gel pens for paper 1. However, an improved clustering was observed in case of paper 2 with 95.5% for ball points and 83.3% for gel pen. PCA study was also depicted that local and foreign branded ballpoint can also be discriminated. Lastly, PLS-DA model results showed that pen strokes of ballpoint and gel pen on both type of paper with great accuracy. Both in calibration and validation sets, ballpoints were 100% correctly classified while the sensitivity of the model was above 84% for gel pens in calibration sets and for validation it was above 60%. Furthermore, same PLS-DA model correctly predicted and discriminated ballpoint and gel pen used in signatures to illustrate a forensic case. Therefore, this demonstrated study is non-destructive, highly effective, fast and accurate in the forensics analysis of suspected documents in the societies where frequencies of forging documents are high.
References
-
Hilton O (1992) Scientific examination of questioned documents. CRC press.
-
Roux C, Novotny M, Evans I, Lennard C (1999) A study to investigate the evidential value of blue and black ballpoint pen inks in Australia. Forensic Science International 101(3): 167-176.
-
Ezcurra M, Gongora JM, Maguregui I, Alonso R (2010) Analytical methods for dating modern writing instrument inks on paper. Forensic science international 197(1-3): 1-20.
-
Weyermann C, Kirsch D, Costa Vera C, Spengler B (2007) A GC/MS study of the drying of ballpoint pen ink on paper. Forensic science international 168(2-3): 119-127.
-
Díaz-Santana O, Conde-Hardisson F, Vega-Moreno D (2018) Comparison of the main dating methods for six ball-point pen inks. Microchemical Journal 138: 550- 561.
-
Calcerrada M, García-Ruiz C (2015) Analysis of questioned documents: A review. Analytica Chimica Acta 853: 143-166.
-
Wang XF, Yu J, Xie MX, Yao YT, Han J (2008) Identification and dating of the fountain pen ink entries on documents by ion-pairing high-performance liquid chromatography. Forensic science international 180(1): 43-49.
-
Sharif M, Batool M, Chand S, Farooqi ZH, Tirmazi SAAS, et al. (2019) Forensic Discrimination Potential of Blue, Black, Green, and Red Colored Fountain Pen Inks Commercially Used in Pakistan, by UV/Visible Spectroscopy, Thin Layer Chromatography, and Fourier Transform Infrared Spectroscopy. International journal of analytical chemistry 2019: 5980967.
-
Nunkoo MI, Saib-Sunassy MB, Wah HLK, Laulloo SJ (2016) Forensic Analysis of Black, Blue, Red, and Green Ballpoint Pen Inks. In: Ramasami P, Bhowon MG, et al. (Eds.), Crystallizing Ideas – The Role of Chemistry. Springer, Cham, pp: 323-339.
-
Bugler JH, Buchner H, Dallmayer A (2008) Age determination of ballpoint pen ink by thermal desorption and gas chromatography-mass spectrometry. Journal of forensic sciences 53(4): 982-988.
-
Copper C, Erbach T, McDonough M, Drury N, Moini M (2019) Analysis of ballpoint pen inks directly from paper using capillary electrophoresis. Forensic Chemistry 13: 100145.
-
Andrasko J, Lagesson-Andrasko L (2019) Simplification of Ink Dating for Forensic Analysis by Thermal Microdesorption Gas Chromatography–Mass Spectrometry. Analytical Letters 52(6): 972-982.
-
Asri MNM, Desa WNSM, Ismail D (2018) Combined Principal Component Analysis (PCA) and Hierarchical Cluster Analysis (HCA): an efficient chemometric approach in aged gel inks discrimination. Australian Journal of Forensic Sciences 52(1): 38-59.
-
Sun Q, Luo Y, Yang X, Xiang P, Shen M (2016) Detection and identification of dyes in blue writing inks by LC- DAD-orbitrap MS. Forensic Science International 261: 71-81.
-
Li B, Xie P, Guo Ym, Fei Q (2014) GC analysis of black gel pen ink stored under different conditions. Journal of forensic sciences 59(2): 543-549.
-
Kher A, Mulholland M, Green E, Reedy B (2006) Forensic classification of ballpoint pen inks using high performance liquid chromatography and infrared spectroscopy with principal components analysis and linear discriminant analysis. Vibrational Spectroscopy 40(2): 270-277.
-
Diaz-Santana O, Vega-Moreno D, Conde-Hardisson F (2017) Gas chromatography-mass spectrometry and high-performance liquid chromatography-diode array detection for dating of paper ink. Journal of chromatography A 1515: 187-195.
-
Koenig A, Magnolon S, Weyermann C (2015) A comparative study of ballpoint ink ageing parameters using GC/MS. Forensic science international 252: 93- 106.
-
Braz A, Lopez-Lopez M, Garcia-Ruiz C (2013) Raman spectroscopy for forensic analysis of inks in questioned documents. Forensic science international 232(1-3): 206-212.
-
Borba FSL, Honorato RS, de Juan A (2015) Use of Raman spectroscopy and chemometrics to distinguish blue ballpoint pen inks. Forensic science international 249: 73-82.
-
Teixeira CA, Poppi RJ (2019) Discriminating blue ballpoint pens inks in questioned documents by Raman imaging and mean-field approach independent component analysis (MF-ICA). Microchemical Journal 144: 411-418.
-
Mazzella WD, Buzzini P (2005) Raman spectroscopy of blue gel pen inks. Forensic Science International 152(2- 3): 241-247.
-
Zieba-Palus J, Kunicki M (2006) Application of the micro-FTIR spectroscopy, Raman spectroscopy and XRF method examination of inks. Forensic science international 158(2-3): 164-172.
-
Causin V, Casamassima R, Marega C, Maida P, Schiavone S, et al. (2008) The discrimination potential of ultraviolet- visible spectrophotometry, thin layer chromatography, and Fourier transform infrared spectroscopy for the forensic analysis of black and blue ballpoint inks. Journal of forensic sciences 53(6): 1468-1473.
-
Nam YS, Park JS, Lee Y, Lee KB (2014) Application of Micro-Attenuated Total Reflectance Fourier Transform Infrared Spectroscopy to Ink Examination in Signatures Written with Ballpoint Pen on Questioned Documents. Journal of forensic sciences 59(3): 800-805.
-
Silva CS, Borba FdSL, Pimentel MF, Pontes MJC, Honorato RS, et al. (2013) Classification of blue pen ink using infrared spectroscopy and linear discriminant analysis. Microchemical Journal 109: 122-127.
-
Sharma V, Kumar R (2017) Fourier transform infrared spectroscopy and high performance thin layer chromatography for characterization and multivariate discrimination of blue ballpoint pen ink for forensic applications. Vibrational Spectroscopy 92: 96-104.
-
Gallidabino M, Weyermann C, Marquis R (2011) Differentiation of blue ballpoint pen inks by positive and negative mode LDI-MS. Forensic Science International 204(1-3): 169-178.
-
Kumar R, Sharma V (2018) Chemometrics in forensic science. TrAC Trends in Analytical Chemistry 105: 191- 201.
-
Lee LC, Liong C-Y, Jemain AA (2018) Effects of data pre-processing methods on classification of ATR- FTIR spectra of pen inks using partial least squares- discriminant analysis (PLS-DA). Chemometrics and Intelligent Laboratory Systems 182: 90-100.
-
Ballabio D, Consonni V (2013) Classification tools in chemistry. Part 1: linear models. PLS-DA. Analytical Methods 5(16): 3790-3798.
-
Calcerrada M, Garcia Ruiz C (2015) Analysis of questioned documents: a review. Anal Chim Acta 853: 143-166.
-
Udriştioiu FM, Tănase IG, Bunaciu AA, Aboul-Enein HY (2012) Paper Analysis: Nondestructive and Destructive Analytical Methods. Applied Spectroscopy Reviews 47(7): 550-570.
-
Kher A, Mulholland M, Reedy B, Maynard P (2001) Classification of Document Papers by Infrared Spectroscopy and Multivariate Statistical Techniques. Applied Spectroscopy 55(9): 1192-1198.
-
Coates J (2006) Interpretation of infrared spectra, a practical approach. Encyclopedia of analytical chemistry: applications, theory and instrumentation.
- Forensic Implications of Adverse Drug Reactions in Schizophrenia A Case Series
- Narcotics and Digital Forensics: Bridging Crimes in the Digital Age
- Ethics in Forensic Psychiatry: Principles, Dilemmas, and Human Rights
- Impact of Acute Stress on Attentional Orienting to Social Cues
- Head Injury and Intracranial Hemorrhage in Western Region of Libya
- A Forensic Study on Handedness: Examination of Handwriting Features in Right and Left Handed Writers