Sex Determination by Analysis of Patella Measurements in New Delhi Population
In this study the patella bones from both right and left sides were taken out of 60 individuals (30 males and 30 females). Bones were kept in 5% sodium hypochlorite solution for a week for maceration, and then dried and following measurements were taken: Maximum Length, Maximum Width, Maximum Thickness and Lateral Articular Facet Breadth in millimeters, and Weight in grams. Statistical analysis was done using SPSS 27.0. Descriptive statistics were obtained for each measurement. Males and females were analyzed separately. Using a two-sample t-test for the parametric data, the mean values of the six measurements were compared between the two sexes to determine if statistically significant differences exist. Receiver operator curve was also applied. Discriminant Equation was obtained. The North Indian population was compared with other populations. In the present study, the mean maximum height of the right side was 37.51mm+3.17SD for females and 41.54mm+2.76SD for males, while the mean of the left side was 37.91mm+2.95SD for females and 42.61mm+2.97SD for males. The sexual dimorphism was significant statistically, with a p-value <0.001 for both sides. The projected cut off value on the right side was 39.56mm with a projected sensitivity of 86.7% and projected specificity of 73.3%, while on the left side cut off value was 38.76mm with a projected sensitivity of 93.3% and projected specificity of 63.3%. The accuracy for classifying males and females based on left and right was 78.3% and 80% respectively. The mean maximum breadth of right side was found to be 37.16mm+3.07SD for females and 42.99mm+2.51SD for males while the mean maximum breadth of left side was found to be 37.88mm+2.95SD for females and 42.61mm+2.97SD for males. The sexual dimorphism was found to be significant statistically with a p value <0.001 for both sides. The projected cut off value on right side was 40.48mm with a projected sensitivity of 90.0% and projected specificity of 96.7% while on left side cut off value was 39.85mm with a projected sensitivity of 90.0% and projected specificity of 83.3%. In the present study, measurements taken on patella bone showed higher mean values for males as compared with females (p<0.001).
Introduction
There is paucity of data for sex determination from human skeleton. Sex determination is necessary in various medico legal, sexual assault cases etc. It is challenging to determine age and sex in cases of mutilated or skeletonized remains. This problem also arises in sexual crimes where genital mutilation is a common phenomenon and cases where the dead body is destroyed by scavenging activities [1]. Sex may require to be established positively in one direction or the other for the following reasons: 1) For simple identification in a living or dead person; 2) to decide whether an individual can exercise certain civil rights reserved to one sex only; 3) For deciding questions relative to legitimacy, divorce, paternity, affiliation and also to some criminal offences.8 Determination of sex in non-skeletonized bodies is usually apparent and rarely presents problems. In general, the external genitalia takes considerable time to putrefy. In addition, breasts and general body shape and the pattern of pubic hair reveal the sex. Where putrefaction is advanced, examination of the internal pelvic organs may still reveal unequivocal evidence of sex. The uterus is the organ in the body most resistant to decomposition. However, the prostate is also quite persistent and resists putrefaction for a relatively longer duration of time [2].
The determination of sex is the statistically essential criterion, as it immediately excludes approximately fifty per cent of the population, whereas age, stature and race each provide points within a wide range of variables. Noticeable sex differences do not become apparent until after puberty, usually in the 15-18-year period, though specialized measurements on the pelvis can indicate the sex even in foetal material [3].
Krogman (1962) comments that he scored 100 per cent accuracy in sex determination using the whole skeleton, 95 % on the pelvis, 92 % on the skull, 98 % on the pelvis plus skull, 80 % on long bones and 98 % on long bones plus pelvis. Adult female skeletal measurements are about 94 % of the male of the same race, but different measurements may vary from 91 to 98 %. The criteria set out above exclude pre-pubertal and senile persons, and are less valid for those outside the 20-55 age groups [4].
Several factors inveigh against a high degree of accuracy in the sexing of unknown material. Among them are : (1) the often fragmentary or isolated nature of the remains available for the study; (2) the evident age (at time of death) of the remains; (3) intrinsic variability and the absence of any objective standards [3].
The pelvic bone and skull are the first choices for morphological sexing if not recovered in fragmentary states. If pelvic bones and skull are retrieved in a fragmentary form, other bones such as the patella can be used [2]. The patella, from the Latin for “small plate”, is a flat, inverted triangular bone situated on the front of the knee-joint.3 In humans, the patella is the largest sesamoid bone in the body [5]. It articulates with the femur and covers and protects the anterior articular surface of the knee joint [6]. The patella ossifies from a single centre, which usually makes its appearance in the second or third year, but may be delayed until the sixth year. More rarely, the bone is develops by two centres, placed side by side. Ossification is completed around the age of puberty [7].
Materials and Methods
The present study was carried out at Department of Forensic Medicine and Toxicology, Lady Hardinge Medical College with an aim to carry out morphometric analysis of patella and to find out whether it can be used as an efficient indicator of gender. Patella bone from both right and left sides was taken out of 60 individuals (30 males and 30 females. Bones were kept in 5% sodium hypochlorite solution for a week for maceration, and then dried and following measurements were taken: Maximum Length, Maximum Width, Maximum Thickness and Lateral Articular Facet Breadth in millimetres and Weight in grams (Table 1).
Statistical analysis was done using SPSS 27.0. Descriptive statistics were obtained for each measurement. Males and females were analysed separately. Using a two-sample t-test for the parametric data, the mean values of the six measurements were compared between the two sexes to determine if statistically significant differences exist. Receiver operator curve was also applied. Discriminant Equation was obtained. The North Indian population was compared with other populations.
| Measurement | Description |
|---|---|
| Maximum Height(MH) | Greatest distance between the base and the apex |
| Maximum Breadth(MB) | Greatest distance between the medial and the lateral sides |
| Maximum Thickness(MT) | Greatest distance between the anterior and the posterior sides |
| Lateral Articular Facet Breadth(LAFB) | Distance between the lateral edge of patella and the median ridge of articular facet |
| Weight(W) | Weight of patella |
Table 1: Description of Measurements.
Observations and Results
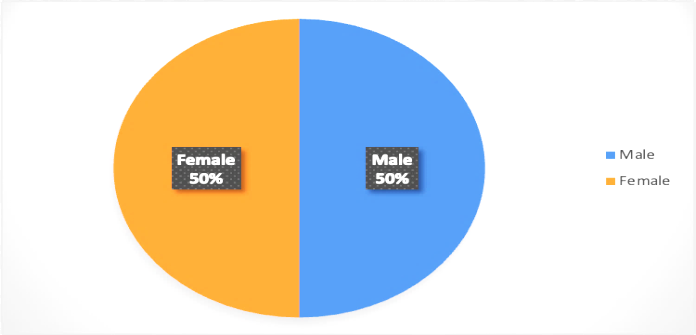
The present study was carried out at Department of Forensic Medicine, Lady Hardinge Medical College with an aim to carry out morphometric analysis of patella and to find out whether it can be used as an efficient indicator of gender. For this purpose 60 specimen were taken from the two genders. Out of 60 samples included in the study, a total of 30 (50%) were taken from male and 30 (50%) were obtained from females (Table 2 & Figure 1).
| SN | Gender | No. of samples | Percentage |
|---|---|---|---|
| 1 | Male | 30 | 50 |
| 2 | Female | 30 | 50 |
Table 2: Gender Wise Distribution of Samples.
D different Parameters of Right Side between Male and Female
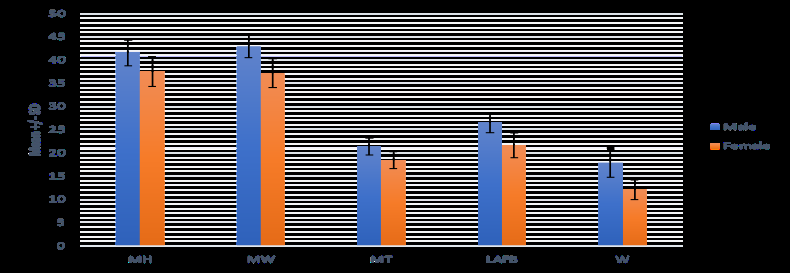
The mean Maximum Height, Maximum Weight, Maximum Thickness, Lateral Articular Facet Breadth and Weight of right patella for male group were 41.54mm±2.76SD, 42.99mm±2.51SD, 21.39mm±1.84SD, 26.44mm±2.08SD, and 17.87grams±3.07SD respectively. The mean Maximum Height, Maximum Weight, Maximum Thickness, Lateral Articular Facet Breadth and Weight of right patella for female group were 37.51mm±3.17SD, 37.16mm±3.07SD 18.42mm±1.78SD, 21.65mm±2.72SD, and 12.08grams±2.14SD respectively. The difference between two groups was statistically significant for all the parameters. Male parameters were greater in value than female parameters (Table 3 & Figure 2).
| Parameters | Male | Female | p value | ||
|---|---|---|---|---|---|
| Mean±SD | Range | Mean±SD | Range | ||
| Right side | |||||
| MH | 41.54±2.76 | 35.47-48.56 | 37.51±3.17 | 25.75-42.32 | <0.001 |
| MW | 42.99±2.51 | 37.37-47.33 | 37.16±3.07 | 28.14-41.23 | <0.001 |
| MT | 21.39±1.84 | 18.15±27.02 | 18.42±1.78 | 13.94-21.80 | <0.001 |
| LAFB | 26.44±2.08 | 22.03-30.86 | 21.65±2.72 | 17.25-28.29 | <0.001 |
| W | 17.87±3.07 | 11.56-23.99 | 12.08±2.14 | 8.05-16.17 | <0.001 |
Table 3: Comparison of Different Parameters of Right Side between Male And Female.
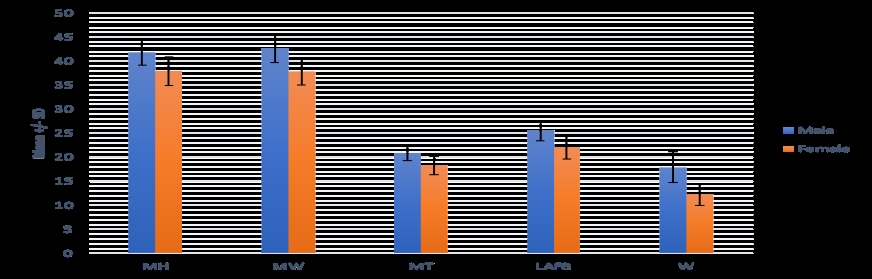
The mean Maximum Height, Maximum Weight, Maximum Thickness, Lateral Articular Facet Breadth and Weight of left patella for male group were 41.72mm±2.62SD, 42.61mm±2.97SD, 20.76mm±1.48SD, 25.44mm±2.04SD, and 17.95grams±3.23SD respectively. The mean Maximum Height, Maximum Weight, Maximum Thickness, Lateral Articular Facet Breadth and Weight of left patella for female group were 37.91mm±2.95SD, 37.88mm±2.80SD, 18.36mm±1.94SD, 22.08mm±2.44SD, 12.31grams±2.28SD respectively. The difference between two groups was statistically significant for all the parameters. Male parameters were greater in value than female parameters (Table 4 & Figure 3).
| Parameters | Male | Female | p value | ||
|---|---|---|---|---|---|
| Mean±SD | Range | Mean±SD | Range | ||
| Left side | |||||
| MH | 41.72±2.62 | 35.86-46.88 | 37.91±2.95 | 32.12-44.49 | <0.001 |
| MW | 42.61±2.97 | 35.68-48.99 | 37.88±2.80 | 29.41-42.60 | <0.001 |
| MT | 20.76±1.48 | 17.73-24.98 | 18.36±1.94 | 13.67-22.21 | <0.001 |
| LAFB | 25.44±2.04 | 20.36-29.28 | 22.08±2.44 | 17.30-27.37 | <0.001 |
| W | 17.95±3.23 | 10.58-24.70 | 12.31±2.28 | 7.99-17.22s | <0.001 |
Table 4: Comparison of Different Parameters of Left Side between Male and Female.
Age Wise Distribution of Two Groups
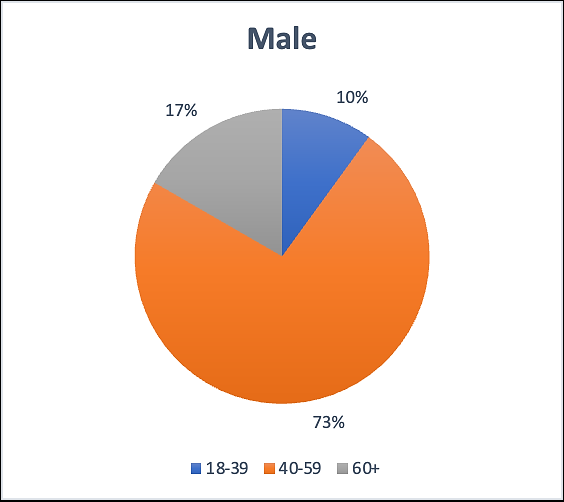
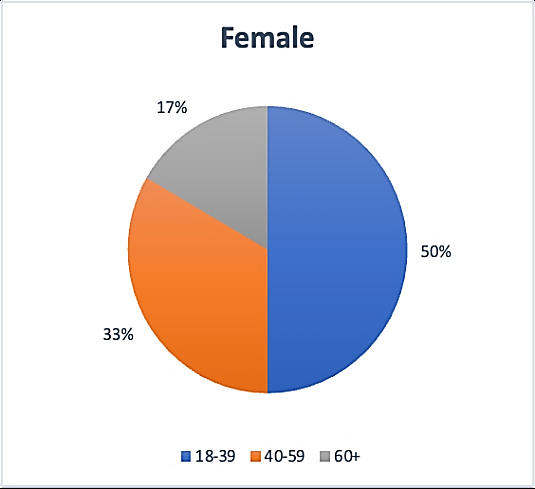
Majority of females were in 18-39 years age group while majority of males were in the age group of 40-59years. 50% females and 10% males were in the age group of 18-39 years, 73% males and 33% females were in the age group of 40-59 years and only 17% of both males and females were in the age group of above 60 years (Table 5 & Figure 4).
Impact of Age in Females (Right Patella)
The mean Maximum Height, Maximum Weight, Maximum Thickness, Lateral Articular Facet Breadth and
| Age Groups | 18-39 | 40-59 | 60+ | Total |
|---|---|---|---|---|
| Male | 3 | 22 | 5 | 30 |
| Female | 15 | 10 | 5 | 30 |
| Total | 18 | 32 | 10 | 60 |
Table 5: Age Wise Comparison of Two Groups.
Weight of right patella for females in age group of 18-39years were 37.065mm, 37.692mm, 18.437mm, 21.295mm, and 12.103grams respectively. The mean Maximum Height, Maximum Weight, Maximum Thickness, Lateral Articular
Facet Breadth and Weight of right patella for females in age group of 40-59years were 37.854mm, 37.634mm, 18.864mm, 21.867mm, and 12.315grams respectively. The mean Maximum Height, Maximum Weight, Maximum Thickness, Lateral Articular Facet Breadth and Weight of right patella for females in age group of more than 59years were 38.212mm, 34.612mm, 17.506mm, 22.298mm, and 11.55grams respectively. The difference between parameters across various age groups was statistically insignificant. The mean Maximum Height, Maximum Weight, Maximum Thickness, Lateral Articular Facet Breadth and Weight of right patella for females in age group of 18-39years were 37.065mm,
37.692mm, 18.437mm, 21.295mm, and 12.103grams respectively. The mean Maximum Height, Maximum Weight, Maximum Thickness, Lateral Articular Facet Breadth and Weight of right patella for females in age group of 40-59years were 37.854mm, 37.634mm, 18.864mm, 21.867mm, and 12.315grams respectively. The mean Maximum Height, Maximum Weight, Maximum Thickness, Lateral Articular Facet Breadth and Weight of right patella for females in age group of more than 59years were 38.212mm, 34.612mm, 17.506mm, 22.298mm, and 11.55grams respectively. The difference between parameters across various age groups was statistically insignificant (Table 6).
| AGE_GROUP | MH-R | MW-R | MT-R | LAFB-R | W-R | |
|---|---|---|---|---|---|---|
| 18-39 | Mean | 37.07 | 37.69 | 18.44 | 21.295 | 12.1 |
| Std. Deviation | 4.047 | 2.43 | 1.697 | 2.2005 | 2.151 | |
| Minimum | 25.75 | 31.44 | 14.99 | 17.31 | 8.61 | |
| Maximum | 42.32 | 40.46 | 20.72 | 24.56 | 15.07 | |
| 40-59 | Mean | 37.85 | 37.63 | 18.86 | 21.867 | 12.32 |
| Std. Deviation | 2.122 | 2.236 | 1.801 | 3.7669 | 2.342 | |
| Minimum | 35.25 | 34.2 | 14.72 | 17.25 | 8.05 | |
| Maximum | 40.64 | 41.23 | 21.8 | 28.29 | 16.17 | |
| >59 | Mean | 38.21 | 34.61 | 17.51 | 22.298 | 11.55 |
| Std. Deviation | 1.99 | 5.174 | 2.008 | 1.9168 | 2.091 | |
| Minimum | 36.5 | 28.14 | 13.94 | 19.84 | 8.16 | |
| Maximum | 41.13 | 40.3 | 18.78 | 24.79 | 13.88 | |
| ANOVA | F ratio | 0.149 | 2.337 | 0.928 | 0.236 | 0.86 |
| P value | 0.862 | 0.116 | 0.407 | 0.791 | 0.434 |
Table 6: Impact of Age in Females (Right Patella).
Impact of age in Females (Right Patella)
The mean Maximum Height, Maximum Weight, Maximum Thickness, Lateral Articular Facet Breadth and Weight of left patella for females in age group of 18-39years were 37.178mm, 36.448mm, 17.734mm, 22.22mm, and 11.064grams respectively.
The mean Maximum Height, Maximum Weight, Maximum Thickness, Lateral Articular Facet Breadth and Weight of left patella for females in age group of 40-59years were 37.863mm, 37.991mm, 18.191mm, 21.59mm, and 12.436grams respectively.
The mean Maximum Height, Maximum Weight, Maximum Thickness, Lateral Articular Facet Breadth and Weight of left patella for females in age group of more than 59years were 38.364mm, 38.442mm, 18.938mm, 22.77mm, and 12.756grams respectively. The difference between parameters across various age groups was statistically insignificant (Table 7).
| AGE_GROUP | MH-L | MW-L | MT-L | LAFB-L | W-L | |
|---|---|---|---|---|---|---|
| 18-39 | Mean | 37.18 | 36.45 | 17.73 | 22.22 | 11.06 |
| Std. Deviation | 2.713 | 4.614 | 1.587 | 1.4048 | 2.146 | |
| Minimum | 34.22 | 29.41 | 15.1 | 20.17 | 7.99 | |
| Maximum | 41.63 | 41.51 | 19.23 | 23.99 | 13.91 | |
| 40-59 | Mean | 37.86 | 37.99 | 18.19 | 21.59 | 12.44 |
| Std. Deviation | 2.971 | 2.437 | 2.217 | 2.241 | 2.326 | |
| Minimum | 32.12 | 31.6 | 13.67 | 17.3 | 9.04 | |
| Maximum | 42.5 | 41.24 | 22.21 | 25.12 | 16.46 | |
| >59 | Mean | 38.36 | 38.44 | 18.94 | 22.77 | 12.76 |
| Std. Deviation | 3.264 | 2.252 | 1.67 | 3.0981 | 2.288 | |
| Minimum | 34.35 | 35.1 | 15.5 | 18.65 | 9.84 | |
| Maximum | 44.49 | 42.6 | 21.45 | 27.37 | 17.22 | |
| ANOVA | F ratio | 0.262 | 0.778 | 0.66 | 0.252 | 1.624 |
| P value | 0.772 | 0.469 | 0.525 | 0.779 | 0.216 |
Table 7: Impact of Age on Females (Left Patella).
Impact of Age in Males (Left Patella)
The mean Maximum Height, Maximum Weight, Maximum Thickness, Lateral Articular Facet Breadth and Weight of left patella for males in age group of 18-39 years were 42.144mm, 43.494mm, 21.632mm, 25.582mm, and 17.57grams respectively.
The mean Maximum Height, Maximum Weight, Maximum Thickness, Lateral Articular Facet Breadth and Weight of left patella for males in age group of 40-59years were 41.457mm, 39.687mm, 19.833mm, 25.19mm, and 17.497grams respectively.
The mean Maximum Height, Maximum Weight, Maximum Thickness, Lateral Articular Facet Breadth and Weight of left patella for males in age group of more than 59years were 41.657mm, 42.834mm, 20.699mm, 25.45mm, and 18.109grams respectively. The difference between parameters across various age groups was statistically insignificant (Table 8).
| AGE_GROUP | MH-L | MW-L | MT-L | LAFB-L | W-L | |
|---|---|---|---|---|---|---|
| 18-39 | Mean | 42.14 | 43.39 | 21.63 | 25.582 | 17.57 |
| Std. Deviation | 2.597 | 2.285 | 2.002 | 1.6314 | 2.03 | |
| Minimum | 39.4 | 40.41 | 20.05 | 24.2 | 14.48 | |
| Maximum | 46.01 | 45.88 | 24.98 | 27.58 | 20.13 | |
| 40-59 | Mean | 41.46 | 39.69 | 19.83 | 25.19 | 17.5 |
| Std. Deviation | 0.919 | 3.543 | 1.718 | 2.4514 | 2.174 | |
| Minimum | 40.62 | 36.72 | 18.36 | 23.49 | 15.94 | |
| Maximum | 42.44 | 43.61 | 21.72 | 28 | 19.98 | |
| >59 | Mean | 41.66 | 42.83 | 20.7 | 25.45 | 18.11 |
| Std. Deviation | 2.851 | 2.933 | 1.308 | 2.1629 | 3.618 | |
| Minimum | 35.86 | 35.68 | 17.73 | 20.36 | 10.58 | |
| Maximum | 46.88 | 48.99 | 23.17 | 29.28 | 24.7 | |
| ANOVA | F ratio | 0.088 | 0.228 | 1.131 | 0.144 | 2.664 |
| P value | 0.916 | 0.798 | 0.337 | 0.866 | 0.088 |
Table 8: Impact of Age in Males (Left Patella).
Impact of Age in Males (Right Patella)
The mean Maximum Height, Maximum Weight, Maximum Thickness, Lateral Articular Facet Breadth and Weight of right patella for males in age group of 18-39years were 42.136mm, 43.612mm, 21.908mm, 27.134mm, and 17.448grams respectively.
The mean Maximum Height, Maximum Weight, Maximum Thickness, Lateral Articular Facet Breadth and Weight of right patella for males in age group of 40-59years were 40.9mm, 39.98mm, 19.347mm, 26.333mm, and 17.843grams respectively.
The mean Maximum Height, Maximum Weight, Maximum Thickness, Lateral Articular Facet Breadth and Weight of right patella for males in age group of more than
59years were 41.493mm, 43.266mm, 21.555mm, 26.308mm, and 17.977grams respectively. The difference between parameters across various age groups was statistically insignificant. Differences between all the parameters between various age groups were statistically insignificant for both sides of the patella for both the groups (Table 9).
| AGE_GROUP | MH-R | MW-R | MT-R | LAFB-R | W-R | |
|---|---|---|---|---|---|---|
| 18-39 | Mean | 42.14 | 43.61 | 21.91 | 27.134 | 17.45 |
| Std. Deviation | 2.482 | 2.487 | 2.046 | 1.7979 | 1.84 | |
| Minimum | 39.69 | 41.56 | 19.64 | 25.62 | 14.59 | |
| Maximum | 45.45 | 46.6 | 25.06 | 30.25 | 19.72 | |
| 40-59 | Mean | 40.9 | 39.98 | 19.35 | 26.333 | 17.84 |
| Std. Deviation | 0.714 | 1.602 | 0.88 | 0.5029 | 2.5 | |
| Minimum | 40.12 | 38.13 | 18.42 | 25.76 | 16.12 | |
| Maximum | 41.52 | 40.91 | 20.17 | 26.7 | 20.71 | |
| >59 | Mean | 41.49 | 43.27 | 21.56 | 26.308 | 17.98 |
| Std. Deviation | 3.03 | 2.423 | 1.762 | 2.2829 | 3.424 | |
| Minimum | 35.47 | 37.37 | 18.15 | 22.03 | 11.56 | |
| Maximum | 48.56 | 47.33 | 27.02 | 30.86 | 23.99 | |
| ANOVA | F ratio | 1.027 | 0.938 | 0.525 | 0.669 | 2.244 |
| P value | 0.372 | 0.404 | 0.598 | 0.521 | 0.125 |
Table 9: Impact of Age in Males (Right Patella).
Stature/Height wise Comparison of two groups
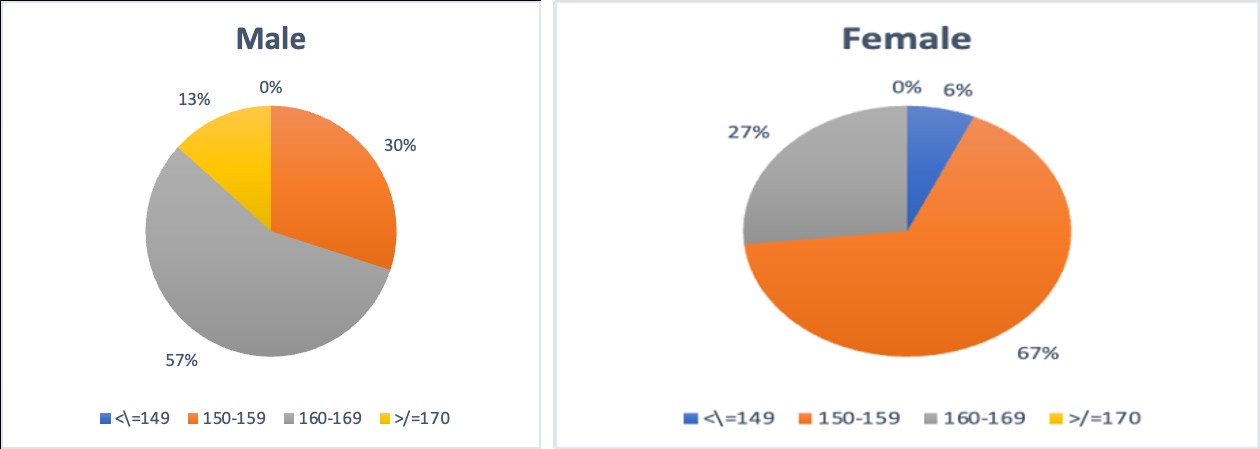
There was no male below the height of 150cm and no female above the height of 169cm. Majority of the males (57%) were in the range of 160-169cm and majority(67%) of females were in the range of 150-159cm (Table 10 & Figure 5 ).
| Stature/Height | Male | Female | Total |
|---|---|---|---|
| 140-149 | 0 | 2 | 2 |
| 150-159 | 9 | 20 | 29 |
| 160-169 | 17 | 8 | 25 |
| >/=170 | 4 | 0 | 4 |
| Total | 30 | 30 | 60 |
Table 10: Stature/Height Wise Comparison of Two Groups.
Impact of Height in Females (Right Patella)
The mean maximum height, maximum width, maximum thickness, lateral articular facet breadth, and weight of right patella for females with height less than or equal to 149cm were 37mm, 36.645mm, 19.055mm, 20.31mm, and 10.05grams respectively. The mean maximum height, maximum width, maximum thickness, lateral articular facet breadth, and weight of right patella for females with height between 150-159cm were 37.0525mm, 36.4875mm,
18.063mm, 21.9335mm, and 11.9955grams respectively. The mean maximum height, maximum width, maximum thickness, lateral articular facet breadth, and weight of right patella for females with height more than or equal to 160cm were 38.8162mm, 38.9675mm, 19.17mm, 21.2875mm, and 12.805grams respectively. The difference of values of various parameters across three groups was statistically insignificant (Table 11).
| Height (in cms) | MH-R | MW-R | MT-R | LAFB-R | W-R | |
|---|---|---|---|---|---|---|
| <= 149.00 | Mean | 37 | 36.645 | 19.055 | 20.31 | 10.05 |
| Std. Deviation | 1.6971 | 3.1183 | 0.2899 | 1.5415 | 0.891 | |
| Minimum | 35.8 | 34.44 | 18.85 | 19.22 | 9.42 | |
| Maximum | 38.2 | 38.85 | 19.26 | 21.4 | 10.68 | |
| 150.00 - 159.00 | Mean | 37.053 | 36.488 | 18.063 | 21.934 | 11.996 |
| Std. Deviation | 3.5694 | 3.3797 | 2.0087 | 3.1737 | 2.4212 | |
| Minimum | 25.75 | 28.14 | 13.94 | 17.25 | 8.05 | |
| Maximum | 41.13 | 41.23 | 21.8 | 28.29 | 16.17 | |
| >160.00 | Mean | 38.816 | 38.968 | 19.17 | 21.288 | 12.805 |
| Std. Deviation | 2.0334 | 1.2662 | 1.0121 | 1.4464 | 1.1221 | |
| Minimum | 36.5 | 37.2 | 18.15 | 19.84 | 11.47 | |
| Maximum | 42.32 | 40.46 | 20.72 | 24.39 | 14.38 | |
| ANOVA | F ratio | 0.586 | 1.633 | 0.909 | 0.157 | 1.47 |
| P value | 0.825 | 0.173 | 0.557 | 0.999 | 0.228 |
Table 11: Impact of Height in Females (Left Patella).
Impact of Height in Females (Left Patella)
The mean maximum height, maximum width, maximum thickness, lateral articular facet breadth, and weight of left patella for females with height less than or equal to 37.16mm, 36.57mm, 19.165mm, 20.455, and 10.53grams respectively. The mean maximum height, maximum width, maximum thickness, lateral articular facet breadth, and weight of left patella for females with height between 150-159cm were 37.5425mm, 37.4415mm, 17.9845mm, 22.2835mm, and
12.218grams respectively.
The mean maximum height, maximum width, maximum thickness, lateral articular facet breadth, and weight of left patella for females with height more than or equal to 160cm were 39.0375mm, 39.32mm, 19.1112mm, 22.0088mm, and 13grams respectively. The difference of values of various parameters across three groups was statistically insignificant (Table 12).
| Height (in cms) | MH-L | MW-L | MT-L | LAFB-L | W-L | |
|---|---|---|---|---|---|---|
| <= 149.00 | Mean | 37.16 | 36.57 | 19.165 | 20.455 | 10.53 |
| Std. Deviation | 2.0082 | 1.9092 | 0.3748 | 0.5869 | 0.5374 | |
| Minimum | 35.74 | 35.22 | 18.9 | 20.04 | 10.15 | |
| Maximum | 38.58 | 37.92 | 19.43 | 20.87 | 10.91 | |
| 150.00 - 159.00 | Mean | 37.543 | 37.442 | 17.985 | 22.284 | 12.218 |
| Std. Deviation | 3.1849 | 2.9649 | 2.1759 | 2.7812 | 2.4346 | |
| Minimum | 32.12 | 29.41 | 13.67 | 17.3 | 7.99 | |
| Maximum | 44.49 | 42.6 | 22.21 | 27.37 | 17.22 | |
| >160.00 | Mean | 39.038 | 39.32 | 19.111 | 22.009 | 13 |
| Std. Deviation | 2.4764 | 2.1712 | 1.2541 | 1.6727 | 2.0022 | |
| Minimum | 36.4 | 34.7 | 17.56 | 20.17 | 10.58 | |
| Maximum | 42.5 | 41.51 | 21.35 | 25.12 | 16.46 | |
| ANOVA | F ratio | 0.632 | 0.812 | 0.783 | 0.471 | 1.512 |
| P value | 0.788 | 0.637 | 0.661 | 0.905 | 0.212 |
Table 12: Impact of Height in Females (Left Patella).
Impact of height in males (Right Patella)
The mean maximum height, maximum width, maximum thickness, lateral articular facet breadth, and weight of right patella for males with height less than or equal to 159cm were 41.0689mm, 42.4778mm, 21.3678mm, 25.78mm, and 15.9578grams respectively. The mean maximum height, maximum width, maximum thickness, lateral articular facet breadth, and weight of right patella for males with height between 160-169cm were 41.8265mm, 43.0729mm,
21.4747mm, 26.3147mm, and 19grams respectively. The mean maximum height, maximum width, maximum thickness, lateral articular facet breadth, and weight of right patella for males with height more than or equal to 170cm were 41.3875mm, 43.83mm, 21.1mm, 28.52mm, and 17.41grams respectively. The difference of values of various parameters across three groups was statistically insignificant (Table 13).
| Height (in cms) | MH-R | MW-R | MT-R | LAFB-R | W-R | |
|---|---|---|---|---|---|---|
| <= 159.00 | Mean | 41.069 | 42.478 | 21.368 | 25.78 | 15.958 |
| Std. Deviation | 2.825 | 2.5147 | 1.5464 | 2.0587 | 2.8231 | |
| Minimum | 37.44 | 38.13 | 18.42 | 22.03 | 11.56 | |
| Maximum | 47.46 | 47.19 | 23.52 | 28.06 | 22.07 | |
| 160.00 - 169.00 | Mean | 41.827 | 43.073 | 21.475 | 26.315 | 19 |
| Std. Deviation | 3.0331 | 2.6178 | 2.1655 | 1.8294 | 3.0411 | |
| Minimum | 35.47 | 37.37 | 18.15 | 22.91 | 15.04 | |
| Maximum | 48.56 | 47.33 | 27.02 | 30.4 | 23.99 | |
| >/=170 | Mean | 41.388 | 43.83 | 21.1 | 28.52 | 17.41 |
| Std. Deviation | 1.5233 | 2.4768 | 1.0525 | 2.3634 | 1.4342 | |
| Minimum | 40 | 40.9 | 20.17 | 26.43 | 16.12 | |
| Maximum | 43.56 | 46.03 | 22.56 | 30.86 | 19.22 | |
| ANOVA | F ratio | 0.264 | 0.71 | 3.803 | 0.783 | 0.424 |
| P value | 0.994 | 0.747 | 0.012 | 0.686 | 0.948 |
Table 13: Impact of Height in Males (Right Patella).
Impact of Height in Males (Left Patella)
The mean maximum height, maximum width, maximum thickness, lateral articular facet breadth, and weight of left patella for males with height less than or equal to 159cm were 41.4667mm, 41.8789mm, 20.2967mm, 24.6544mm, and 15.8089grams respectively.
The mean maximum height, maximum width, maximum thickness, lateral articular facet breadth, and weight of left patella for males with height between 160-169cm were
41.9553mm, 43.1335mm, 21.1159mm, 25.5994mm, and 19.2541grams respectively.
The mean maximum height, maximum width, maximum thickness, lateral articular facet breadth, and weight of left patella for males with height more than or equal to 170cm were 41.3875mm, 43.83mm, 21.1mm, 28.52mm, and 17.41grams respectively. The difference of values of various parameters across three groups was statistically insignificant (Table 14).
| Height (in cms) | MH-L | MW-L | MT-L | LAFB-L | W-L | |
|---|---|---|---|---|---|---|
| 150-159.00 | Mean | 41.467 | 41.879 | 20.297 | 24.654 | 15.809 |
| Std. Deviation | 2.5347 | 3.473 | 1.2495 | 2.3299 | 2.8372 | |
| Minimum | 37.66 | 36.72 | 17.73 | 20.36 | 10.58 | |
| Maximum | 46.84 | 48.99 | 21.65 | 28.43 | 21.09 | |
| 160.00 - 169.00 | Mean | 41.955 | 43.134 | 21.116 | 25.599 | 19.254 |
| Std. Deviation | 2.9305 | 2.7495 | 1.6106 | 1.8266 | 3.1647 | |
| Minimum | 35.86 | 35.68 | 18.54 | 21.97 | 14.96 | |
| Maximum | 46.88 | 46.91 | 24.98 | 29.28 | 24.7 | |
| >/=170 | Mean | 41.278 | 42.05 | 20.348 | 26.575 | 17.285 |
| Std. Deviation | 1.7707 | 3.0692 | 1.363 | 2.1011 | 1.4207 | |
| Minimum | 39.28 | 38.73 | 18.36 | 23.49 | 15.94 | |
| Maximum | 43.58 | 44.7 | 21.46 | 28.15 | 18.91 | |
| ANOVA | F ratio | 0.406 | 0.736 | 2.004 | 0.528 | 0.441 |
| P value | 0.956 | 0.725 | 0.112 | 0.889 | 0.94 |
Table 14: Impact of Height in Males (Left Patella).
Weight Wise Comparison of Two Groups (Table 15 & Figure 6)
| Body Weight(in Kgs) | Male | Female | Total |
|---|---|---|---|
| <49 | 15 | 19 | 34 |
| 50-59 | 8 | 8 | 16 |
| >/=60 | 7 | 3 | 10 |
| Total | 30 | 30 | 60 |
Table 15: Weight Wise Comparison of Two Groups.
Impact of Weight in Females (Right Patella)
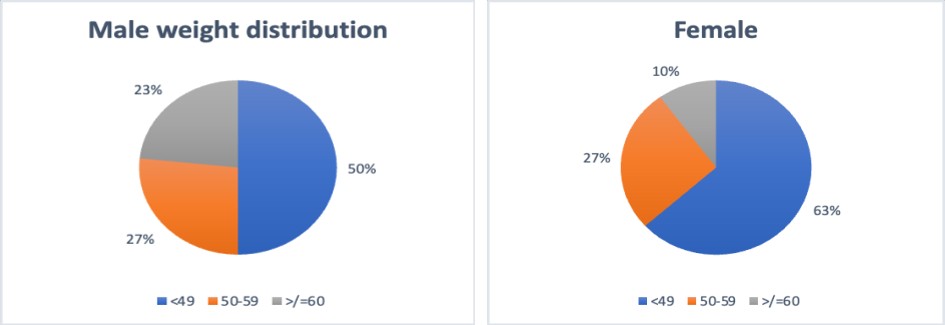
Majority of samples in both the groups had less than 49Kg weight. 50% of males and 63% of females had the weight of less than 49Kg. The mean maximum height, maximum width, maximum thickness, lateral articular facet breadth, and weight of right patella for females with body weight between 40-49Kgs were 37.1947mm, 36.8158mm,
18.2889mm, 21.9668mm, and 12.0232grams respectively. The mean maximum height, maximum width, maximum thickness, lateral articular facet breadth, and weight of right patella for females with body weight between 50-59Kgs were 37.9738mm, 37.6563mm, 18.6775mm, 21.2255mm, and 12.4475grams respectively. The mean maximum height, maximum width, maximum thickness, lateral articular facet breadth, and weight of right patella for females with body weight more than or equal to 60Kgs were 38.3633mm, 38.01mm, 18.6067mm, 207267mm, and 11.4767grams respectively. The difference between parameters across three height groups was statistically insignificant (Table 16).
| Weight (in Kgs) | MH-R | MW-R | MT-R | LAFB-R | W-R | |
|---|---|---|---|---|---|---|
| 40-49Kgs | Mean | 37.195 | 36.816 | 18.289 | 21.967 | 12.023 |
| Std. Deviation | 3.6277 | 3.4639 | 1.8362 | 2.5626 | 2.0058 | |
| Minimum | 25.75 | 28.14 | 13.94 | 17.74 | 8.16 | |
| Maximum | 42.32 | 40.46 | 21.8 | 26.9 | 15.07 | |
| 50.00 - 59.00 | Mean | 37.974 | 37.656 | 18.678 | 21.255 | 12.448 |
| Std. Deviation | 2.3927 | 2.5791 | 1.7664 | 3.5781 | 2.3448 | |
| Minimum | 34.23 | 34.2 | 14.72 | 17.25 | 9.42 | |
| Maximum | 40.71 | 41.23 | 19.96 | 28.29 | 16.17 | |
| >/=60 | Mean | 38.363 | 38.01 | 18.607 | 20.727 | 11.477 |
| Std. Deviation | 2.1794 | 1.5416 | 2.0351 | 0.7453 | 3.1973 | |
| Minimum | 35.85 | 36.51 | 16.66 | 19.97 | 8.05 | |
| Maximum | 39.73 | 39.59 | 20.72 | 21.46 | 14.38 | |
| ANOVA | F ratio | 0.337 | 0.594 | 1.344 | 0.662 | 0.348 |
| P value | 0.98 | 0.842 | 0.305 | 0.788 | 0.977 |
Table 16: Impact of Weight in Females (Right Patella).
Impact of Weight in Females (Left Patella)
The mean maximum height, maximum width, maximum thickness, lateral articular facet breadth, and weight of left patella for females with body weight between 40-49Kgs were 37.7521mm, 37.7205mm, 18.3516mm, 22.2253mm, and 12.2grams respectively. The mean maximum height, maximum width, maximum thickness, lateral articular facet breadth, and weight of left patella for females with body weight between 50-59Kgs were 38.1075mm, 37.915mm,
18.1125mm, 21.8887mm, and 12.6475grams respectively. The mean maximum height, maximum width, maximum thickness, lateral articular facet breadth, and weight of left patella for females with body weight more than or equal to 60Kgs were 38.44mm, 38.84mm, 19.11mm, 21.7533mm, and 12.1467grams respectively.
The difference between parameters across three height groups was statistically insignificant (Table 17).
| Weight (in Kgs) | MH-L | MW-L | MT-L | LAFB-L | W-L | |
|---|---|---|---|---|---|---|
| <= 49.00 | Mean | 37.752 | 37.721 | 18.352 | 22.225 | 12.2 |
| Std. Deviation | 3.2071 | 3.0851 | 1.8083 | 2.6212 | 2.3342 | |
| Minimum | 32.12 | 29.41 | 14.88 | 17.3 | 7.99 | |
| Maximum | 44.49 | 41.51 | 22.21 | 27.37 | 16.46 | |
| 50.00 - 59.00 | Mean | 38.108 | 37.915 | 18.113 | 21.889 | 12.648 |
| Std. Deviation | 2.8671 | 2.7195 | 2.3314 | 2.509 | 2.4792 | |
| Minimum | 34.11 | 35.1 | 13.67 | 17.88 | 9.43 | |
| Maximum | 41.86 | 42.6 | 20.45 | 26.26 | 17.22 | |
| >/=60 | Mean | 38.44 | 38.84 | 19.11 | 21.753 | 12.147 |
| Std. Deviation | 2.1651 | 0.7671 | 2.3078 | 1.4668 | 2.1167 | |
| Minimum | 35.94 | 38.02 | 16.74 | 20.62 | 9.84 | |
| Maximum | 39.69 | 39.54 | 21.35 | 23.41 | 14 | |
| 60.00+ | F ratio | 0.855 | 1.19 | 0.918 | 0.367 | 0.486 |
| P value | 0.626 | 0.387 | 0.575 | 0.971 | 0.915 |
Table 17: Impact of Weight in Females(Left Patella).
Impact of Weight in Males (Right Patella)
The mean maximum height, maximum width, maximum thickness, lateral articular facet breadth, and weight of right patella for males with body weight between 40-49Kgs were 40.4567mm, 42.684mm, 21.5433mm, 26.3153mm, and 16.2467grams respectively. The mean maximum height, maximum width, maximum thickness, lateral articular facet breadth, and weight of right patella for males with body weight between 50-59Kgs were 42.56mm, 43.0913mm,
20.5988mm, 26.3288mm, and 20.5325grams respectively. The mean maximum height, maximum width, maximum thickness, lateral articular facet breadth, and weight of right patella for males with body weight more than or equal to 60Kgs were 42.6986mm, 43.5529mm, 21.9771, 26.87mm, and 18.3286grams respectively. The difference between parameters across three height groups was statistically insignificant except for patella weight (Table 18).
| Weight (in Kgs) | MH-R | MW-R | MT-R | LAFB-R | W-R | |
|---|---|---|---|---|---|---|
| 40-49Kgs | Mean | 40.457 | 42.684 | 21.543 | 26.315 | 16.247 |
| Std. Deviation | 2.2079 | 2.3777 | 1.9594 | 2.4573 | 1.9206 | |
| Minimum | 35.47 | 37.37 | 18.15 | 22.03 | 11.56 | |
| Maximum | 44.88 | 47.33 | 27.02 | 30.86 | 19.78 | |
| 50.00 - 59.00 | Mean | 42.56 | 43.091 | 20.599 | 26.329 | 20.533 |
| Std. Deviation | 3.0194 | 3.0966 | 1.4172 | 1.8227 | 3.6374 | |
| Minimum | 39.48 | 38.13 | 18.42 | 23.8 | 14.99 | |
| Maximum | 48.56 | 46.6 | 22.53 | 29.15 | 23.99 | |
| >/=60 | Mean | 42.699 | 43.553 | 21.977 | 26.87 | 18.329 |
| Std. Deviation | 3.0028 | 2.3791 | 1.9305 | 1.6474 | 2.2878 | |
| Minimum | 39.69 | 41.55 | 19.64 | 25.14 | 14.59 | |
| Maximum | 47.46 | 47.19 | 25.06 | 30.25 | 22.07 | |
| ANOVA | F ratio | 2.562 | 0.277 | 1.164 | 0.177 | 7.509 |
| P value | 0.096 | 0.76 | 0.327 | 0.839 | 0.003 |
Table 18: Impact of Weight in Males (Right Patella).
Impact Of Weight In Males (Left Patella)
The mean maximum height, maximum width, maximum thickness, lateral articular facet breadth, and weight of left patella for males with body weight between 40-49Kgs were 41.104mm, 42.03mm, 20.582mm, 25.0633mm, and 16.2433grams respectively. The mean maximum height, maximum width, maximum thickness, lateral articular facet breadth, and weight of left patella for males with body weight between 50-59Kgs were 42.6038mm, 42.2763mm, 20.6238mm, 25.705mm, and 20.7575grams respectively.
The mean maximum height, maximum width, maximum thickness, lateral articular facet breadth, and weight of left patella for males with body weight more than or equal to 60Kgs were 42.029mm, 44.2457mm, 21.33mm, 25.97mm, and 18.43229grams respectively. The difference between parameters across three height groups was statistically insignificant except for patella weight. Differences between various parameters across different weight groups was statistically insignificant except for Weight of male Patella on both left (0.003) and right(0.003) sides (Table 19).
| Weight (in Kgs) | MH-L | MW-L | MT-L | LAFB-L | W-L | |
|---|---|---|---|---|---|---|
| 40-49Kgs | Mean | 41.104 | 42.03 | 20.582 | 25.063 | 16.243 |
| Std. Deviation | 2.5476 | 3.0082 | 1.1219 | 2.3422 | 2.1846 | |
| Minimum | 35.86 | 35.68 | 18.36 | 20.36 | 10.58 | |
| Maximum | 46.88 | 46.91 | 23.17 | 29.28 | 19.99 | |
| 50.00 - 59.00 | Mean | 42.604 | 42.276 | 20.624 | 25.705 | 20.758 |
| Std. Deviation | 2.3384 | 2.9263 | 1.6044 | 1.7023 | 3.7764 | |
| Minimum | 40.51 | 36.72 | 17.73 | 23.62 | 15.37 | |
| Maximum | 46.74 | 45.88 | 22.93 | 28.15 | 24.7 | |
| >/=60 | Mean | 42.023 | 44.246 | 21.33 | 25.97 | 18.433 |
| Std. Deviation | 3.1301 | 2.7427 | 2.0734 | 1.8004 | 2.1456 | |
| Minimum | 38.92 | 40.41 | 18.54 | 24.14 | 14.48 | |
| Maximum | 46.84 | 48.99 | 24.98 | 28.43 | 21.09 | |
| ANOVA | F ratio | 0.904 | 1.437 | 0.636 | 0.539 | 7.532 |
| P value | 0.417 | 0.255 | 0.537 | 0.589 | 0.003 |
Table 19: Impact of Weight in Males (Left Patella).
Comparison of Different Parameters between Right Side and Left Side of Males
The mean maximum height, maximum width, maximum thickness, lateral articular facet breadth, and weight of right side of patella for males were 41.54mm±2.76SD, 42.99mm±2.51SD, 21.39mm±1.84SD, 26.44mm±2.08SD, and 17.87grams±3.07SD respectively. The mean maximum height, maximum width, maximum thickness, lateral articular facet breadth, and weight of left side of patella for males were 41.72mm±2.62SD, 42.61mm±2.97SD, 20.76mm±1.48SD, 25.44mm±2.04SD, 17.95grams±3.23SD respectively.
The difference between mean values of all the parameters between left and right side were statistically insignificant (Table 20).
| Right side | Left side | p value | |||
|---|---|---|---|---|---|
| Parameters | Mean±SD | Range | Mean±SD | Range | |
| MH | 41.54±2.76 | 35.47-48.56 | 41.72±2.62 | 35.86-46.88 | 0.8 |
| MW | 42.99±2.51 | 37.37-47.33 | 42.61±2.97 | 35.68-48.99 | 0.59 |
| MT | 21.39±1.84 | 18.15±27.02 | 20.76±1.48 | 17.73-24.98 | 0.15 |
| LAFB | 26.44±2.08 | 22.03-30.86 | 25.44±2.04 | 20.36-29.28 | 0.06 |
| W | 17.87±3.07 | 11.56-23.99 | 17.95±3.23 | 10.58-24.70 | 0.91 |
Table 20: Comparison of Different Parameters between Right Side and Left Side of Males.
Comparison of Different Parameters between Right Side and Left Side of Female
The mean maximum height, maximum width, maximum thickness, lateral articular facet breadth, and weight of right side of patella for females were 37.51mm±3.17SD, 37.16mm±3.07SD, 18.42mm±1.78SD, 21.65mm±2.72SD, 12.08grams±2.14SD respectively.
The mean maximum height, maximum width, maximum thickness, lateral articular facet breadth, and weight of left side of patella for females were 37.91mm±2.95SD, 37.88mm±2.80SD, 18.36mm±1.94SD, 22.08mm±2.44SD, 12.31grams±2.28SD respectively.
The difference between mean values of all the parameters between left and right side were statistically insignificant (Table 21).
| Parameters | Right side | Left side | p value | ||
|---|---|---|---|---|---|
| Mean±SD | Range | Mean±SD | Range | ||
| MH | 37.51±3.17 | 25.75-42.32 | 37.91±2.95 | 32.12-44.49 | 0.61 |
| MW | 37.16±3.07 | 28.14-41.23 | 37.88±2.80 | 29.41-42.60 | 0.34 |
| MT | 18.42±1.78 | 13.94-21.80 | 18.36±1.94 | 13.67-22.21 | 0.9 |
| LAFB | 21.65±2.72 | 17.25-28.29 | 22.08±2.44 | 17.30-27.37 | 0.51 |
| W | 12.08±2.14 | 8.05-16.17 | 12.31±2.28 | 7.99-17.22 | 0.68 |
Table 21: Comparison of Different Parameters between Right Side and Left Side of Female.
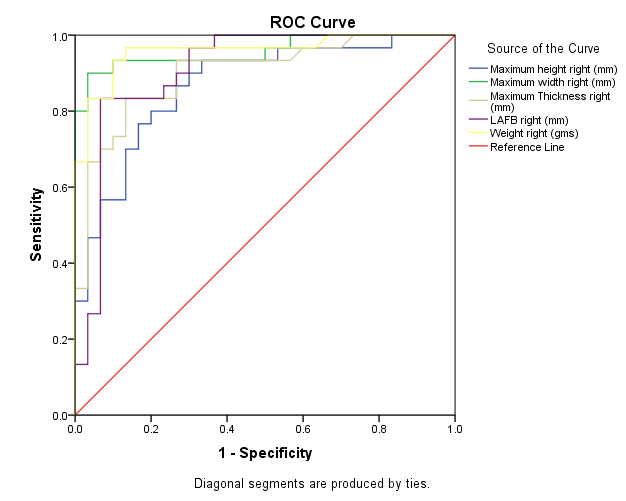
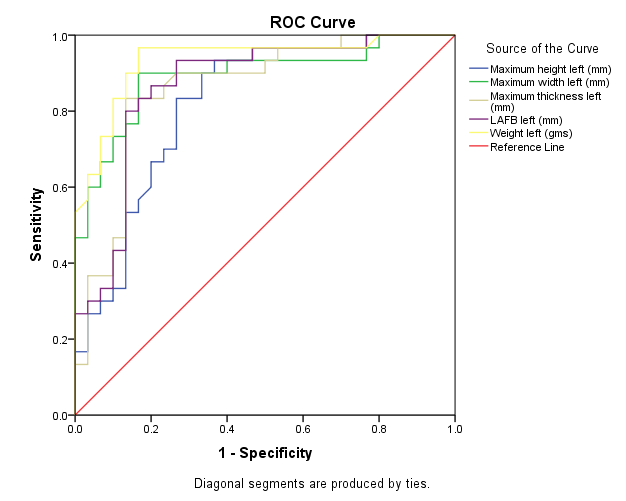
Roc Analysis for Predictive Efficacy of Independent Parameters
The Area under curve (AUC) for Maximum height, maximum width, maximum thickness, lateral articular facet breadth and weight of right patella were 0.868, 0.958, 0.900,
0.909, and 0.958 respectively. The Area under curve (AUC) for Maximum height, maximum width, maximum thickness, lateral articular facet breadth and weight of left patella were 00.821, 0.892, 0.859, 0.867, and 0.934 respectively (Table 22; Figures 6 & 7)
| Right | |||||
|---|---|---|---|---|---|
| SN | Parameter | AUC | Projected cut-off value | Projected Sensitivity (%) | Projected Specificity (%) |
| 1 | MH | 0.87 | 39.56 | 86.7 | 73.3 |
| 2 | MB | 0.96 | 40.48 | 90.00% | 96.70% |
| 3 | MT | 0.9 | 19.91 | 83.30% | 83.30% |
| 4 | LAFB | 0.91 | 24.96 | 83.30% | 93.30% |
| 5 | W(grams) | 0.96 | 15.16 | 83.30% | 96.70% |
| Left | |||||
| SN | Parameter | AUC | Projected cut-off value | Projected Sensitivity (%) | Projected Specificity (%) |
| 1 | MH | 0.82 | 38.76 | 93.30% | 63.30% |
| 2 | MB | 0.89 | 39.85 | 90% | 83.30% |
| 3 | MT | 0.86 | 20.02 | 83.30% | 86.70% |
| 4 | LAFB | 0.87 | 23.45 | 93.30% | 73.30% |
| 5 | W(grams) | 0.93 | 14.37 | 96.70% | 83.30% |
Table 22: Outcome of Receiver Operator Curve Analysis for Patella Morphometry.
The cut off values for classifying males and females for maximum height, maximum width, maximum thickness, lateral articular facet breadth, and weight of right patella were 39.56mm, 40.48mm, 19.91mm, 24.96mm, and 15.16grams respectively. The cut off values for classifying males and females for maximum height, maximum width, maximum thickness, lateral articular facet breadth, and weight of left patella were 38.76mm, 39.85mm, 20.02mm, 23.45mm, and 14.37grams respectively (Table 23).
| Cut off | Sensitivity | Specificity | PPV | NPV | Accuracy | |
|---|---|---|---|---|---|---|
| Maximum height right (mm) | 39.56 | 86.70% | 73.30% | 76.47% | 84.62% | 80.00% |
| Maximum width right (mm) | 40.48 | 90.00% | 96.70% | 96.43% | 90.62% | 93.33% |
| Maximum Thickness right (mm) | 19.91 | 83.30% | 83.30% | 83.30% | 83.30% | 83.30% |
| LAFB right (mm) | 24.96 | 83.30% | 93.30% | 92.60% | 84.80% | 88.30% |
| Weight right (grams) | 15.16 | 83.30% | 96.70% | 96.10% | 85.30% | 90.00% |
| Cut off | Sensitivity | Specificity | PPV | NPV | Accuracy | |
| Maximum height left (mm) | 38.76 | 93.30% | 63.30% | 71.80% | 90.50% | 78.30% |
| Maximum width left (mm) | 39.85 | 90% | 83.30% | 84.40% | 89.30% | 86.70% |
| Maximum thickness left (mm) | 20.02 | 83.30% | 86.70% | 86.20% | 83.80% | 85.00% |
| LAFB left (mm) | 23.45 | 93.30% | 73.30% | 77.80% | 91.70% | 83.30% |
| Weight left (grams) | 14.37 | 96.70% | 83.30% | 85.30% | 96.15% | 90.00% |
Table 23: Sensitivity, Specificity, PPV, NPV, Accuracy of Cut off Values.
For both sides, weight had the maximum AUC (0.958 for right and 0.934 for left side), thus indicating it can be used for differentiation between males and females. For right and left sides, the projected sensitivity of weight was 83.3% and 96.7% respectively and projected specificity was 86.7% and 83.3% respectively.
For both sides, weight had the maximum AUC (0.958 for right and 0.934 for left side), thus indicating it can be used for differentiation between males and females. For right and left sides, the projected sensitivity of weight was 83.3% and 96.7% respectively and projected specificity was 86.7% and 83.3% respectively.
Derivation of Discriminant Equation and its Classifier Value (Table 24)
| Function | Eigenvalue | % of Variance | Cumulative % | Canonical Correlation |
|---|---|---|---|---|
| 1 | 2.916a | 100 | 100 | 0.863 |
Table 24: Derivation of Discriminant Equation and Its Classifier Value.
All the variables were included from the function. First 1 canonical discriminant functions were used in the analysis.
Discriminant equation obtained: DF = -0.03*Max Height right+ 0.04* Max Height left + 0.163 * Max width right-0.05*Max width left + 0.114* Max thickness right – 0.069* Max thickness left + 0.332* LAFB right – 0.221 LAFB left + 0.638 * weight right – 0.368 weight left Classifier value for discrimination of males = DF > 0.008 (Table 25)
| Sex | Predicted Group Membership | Total | ||
|---|---|---|---|---|
| Male | Female | |||
| Count | Male | 27 | 3 | 30 |
| Female | 2 | 28 | 30 | |
| % | Male | 90 | 10 | 100 |
| Female | 6.7 | 93.3 | 100 |
Table 25: Predicted Classification Results.
a 95.0% of original grouped cases correctly classified.
The discriminant function was 90% sensitive and 93.3% specific in prediction of males, for females the sensitivity could be stated as 93.3% and specificity as 90%.
Discussion
In the present study, measurements taken on patella bone showed higher mean values for males as compared with females (p<0.001) which is consistent with previous studies [8, 9, 10, 11, 12, 13, 14, 15, 16]. In the present study, the mean maximum height of the right side was 37.51mm+3.17SD for females and 41.54mm+2.76SD for males, while the mean of the left side was 37.91mm+2.95SD for females and 42.61mm+2.97SD for males.
The sexual dimorphism was significant statistically, with a p-value <0.001 for both sides. The projected cut off value on the right side was 39.56mm with a projected sensitivity of 86.7% and projected specificity of 73.3%, while on the left side cut off value was 38.76mm with a projected sensitivity of 93.3% and projected specificity of 63.3%. The accuracy for classifying males and females based on left and right was 78.3% and 80% respectively.
The mean maximum breadth of right side was found to be 37.16mm+3.07SD for females and 42.99mm+2.51SD for males while the mean maximum breadth of left side was found to be 37.88mm+2.95SD for females and 42.61mm+2.97SD for males. The sexual dimorphism was found to be significant statistically with a p value <0.001 for both sides. The projected cut off value on right side was 40.48mm with a projected sensitivity of 90.0% and projected specificity of 96.7% while on left side cut off value was 39.85mm with a projected sensitivity of 90.0% and projected specificity of 83.3%. These values are comparable with the studies done both in India and around the world. The mean maximum height values for males obtained by Akhlaghi [8], Sakaue [9], Kemkes [10], Peckmann [11], Narayanan [12], Indra [13], Teke [14], Mahfouz [15], Abdel [16], Zhan [17] and Abdelaleem [18] were 44.70, 41.1mm, 43.8mm, 44.8mm, 41.42mm, 44.2mm, 46mm, 48.4mm, 43.2mm and 42.27mm respectively. Some authors have used radiological methods for studying patella. Abdel obtained a mean of 45.4mm for females, which is higher than most other works and higher than the cut off value obtained in the current study [16]. He used radiological methods to obtain the parameters in the Egyptian population [16]. However, another study using the radiological method by Abdelaleem in Egypt obtained mean for males and females of 42.27 and 39.72 with the accuracy of 48.7% and 67.7%, respectively [18]. Teke obtained Mean of 41.3mm and 35.84mm for males and females, respectively, using MRI images for calculation [14]. He obtained the accuracy of 87% and 91% for males and females, respectively [14]. Michiue using post mortem CT obtained the mean value of 44.1 and 38.8 for males and females, respectively [14]. Zhan and co-workers obtained an accuracy of 82.0% for patellar height using CT in the Chinese population [17]. There are variations in the accuracy using radiological methods, which needs further research.
The discriminant function obtained in current study was 90% sensitive and 93.3% specific in prediction of males, for females the sensitivity could be stated as 93.3% and specificity as 90%. The accuracy of discriminant function obtained by Peckmann [11], Indra [13], Mahfouz [15], Abdel [16], and Zhan [17] were 85%, 85.5%, 90.3%, 87.5% and 91.4% respectively. Accuracy obtained by the present study is more or less similar to other studies.
Conclusion
In all the cases, all the parameters of patella of both sides, the difference in mean values of males and females was statistically significant (p<0.001). These findings imply that single value of patella parameters can also be used for identification of gender. Using these techniques, the determination of sex can be accomplished by comparing the dimension of unknown patella bone with the cut off value for the population of New Delhi.
References
-
Stone AC, Milner GR, Paabo S, Staneking M (1996) Sex determination of ancient human skeletons using DNA. Am J Phys Anthropol 99(2): 231-238.
-
Hagelberg E, Clegg JB (1991) Isolation and characterization of DNA from archaeological bone. Proc BiolSci 244(1309): 45-50.
-
Saukko P, Knight B (2004) Knight’s Forensic Pathology, In:(3rd edn.) A Hodder Arnold Publication, London pp: 1-720.
-
Krogman WM, Iscan MY (1986) The human skeleton in forensic medicine. In: 3rd (Edn.), Springfield: CC Thomas, pp: 1-359.
-
Neumann DA (2016) Kinesiology of the musculoskeletal system-e-book: foundations for rehabilitation. In: 3rd (Edn.), Elsevier Health Sciences.
-
Cox CF, Sinkler MA, Hubbard JB (2022) Anatomy, Bony Pelvis and Lower Limb, Knee Patella. Stat Pearls Publishing.
-
Howale DS, Patel ZK (2013) Hypothesis: morphology and development of the patella. International Journal of Scientific and Research Publications 3(5): 1-5.
-
Akhlaghi M, Sheikhazadi A, Naghsh A (2010) Identification of Sex in Iranian Population Using Patella Dimensions. Journal of Forensic and Legal Medicine 17(3): 150-155.
-
Sakaue K (2008) New method for diagnosis of the sex and age-at-death of an adult human skeleton from the patella. Bull Natl Mus Nat Sci Ser D 34: 43-51.
-
Kemkes-Grottenthaler A (2005) Sex Determination by Discriminant Analysis: An Evaluation of the Reliability of Patella Measurements. For Sci Int 147(2-3): 129-133.
-
Peckmann T, Fisher B (2018) Sex estimation from the patella in an African American population. Journal of Forensic and Legal Medicine 54: 1-7.
-
Narayanan S (2020) Determination of Sex and Age at Death of Adult Human using Patellar Dimensions: A Morphometric study among South Indian Population, Chennai, Tamilnadu. The Tamil Nadu Dr MGR Medical University.
-
Indra L, Vach W, Desideri J, Besse M, Pichler SL (2021) Testing the validity of population-specific sex estimation equations: An evaluation based on talus and patella measurements. Science & Justice 61(5): 555-563.
-
Teke HY, Ünlütürk Ö, Günaydin E, Duran S, Özsoy S (2018) Determining gender by taking measurements from magnetic resonance images of the patella. Journal of Forensic and Legal Medicine 58: 87-92.
-
Mahfouz M, Badawi A, Merkl B, Fatah A, Pritchard E, et al. (2006) 3D Statistical Shape Models of Patella for Sex Classification. Conf Proc IEEE Eng Med Biol Soc 2006: 3439-45.
-
Abdel Moneim WM, Abdel Hady RH, Abdel Maaboud RM, Fathy HM, Hamed AM (2008) Identification of sex depending on radiological examination of foot and patella. Am J Forensic Med Pathol 29(2): 136-140.
-
Zhan MJ, Li CL, Fan F, Zhang K, Chen Y, et al. (2020) Estimation of sex based on patella measurements in a contemporary Chinese population using multidetector computed tomography: An automatic measurement method. Legal Medicine 47: 101778.
-
Abdelaleem SA, Younis R, Kader M (2016) Sex determination from the piriform aperture using multi slice computed tomography: Discriminant function analysis of Egyptian population in Minia Governorate. Egyptian Journal of Forensic Sciences 6(4): 429-434.
- Narcotics and Digital Forensics: Bridging Crimes in the Digital Age
- Ethics in Forensic Psychiatry: Principles, Dilemmas, and Human Rights
- Impact of Acute Stress on Attentional Orienting to Social Cues
- Head Injury and Intracranial Hemorrhage in Western Region of Libya
- A Forensic Study on Handedness: Examination of Handwriting Features in Right and Left Handed Writers
- Techniques for Latent Fingerprint Development Using Natural and Synthetic Powders: A Review