Gender Differences in Cerebral Metabolism Induced by Polarized Light in Mice Brain: A Quantum Coherence Model
We present direct evidence of the polarized light effect of coherence in computational neuronal dynamics in female, but not male mice brain. We measured the accumulation of [18F] fluorodeoxyglucose ([18F]FDG) in mouse brain using small animal positron emission tomography and magnetic resonance imaging (PET/MRI) during light stimulation with yellow and polarized filters compared to dark condition. Fourier analysis was performed using mean standardized uptake values (SUV) of [18F]FDG for each stimulus condition to derive the spectral density coefficients for analysis and spectral plots of cross-correlation function, cross amplitude, phase spectrum, gain, coherency and multiple regression analysis. PET images show gender differences during polarized light stimulation, with greater tracer accumulation in the visual cortex in female than in male mice. In male mice, there was classical superposition of waves of polarized and yellow lights, shown by significantly attenuated long-term depression at cortical C-peak in the ventral stream of the left visual cortex. Conversely, in female mice, polarized light particle evoked accentuated long-term potentiation at subcortical S-peak in the dorsal stream in the right visual cortex. Coherence may occur in the visual system in female mice within the cortical ‘cytochrome oxidase (CO) blobs’, which are spatially and functionally connected through nested hierarchical neural networks of structures implicated as environment for non-trivial features such as coherence.
Introduction
Polarized light effects may explain some observations in biological systems that could have practical applications in clinical and diagnostic medicine. However, the scientific basis for the effects of polarized light has not been fully elucidated. Research into the polarized effects of light may help the understanding of non-trivial quantum effects in biological systems [1, 2, 3, 4, 5, 6, 7, 8]. Some have suggested that, the complex non- linear brain system is highly sensitive to small perturbations and could amplify microscopic effects of polarized light, which may serve as a model to understand quantum effects. Specifically, they [3, 9, 10, 11] suggest that, non-trivial quantum effects could on one hand, accelerate microscopic computational processes of neuronal activity, and on the other, non-linear stochastic oscillations in the brain could accentuate quantum effects and modulate neuronal processes such as long-term potentiation [12] or long-term depression [13]. Moreover, evidence for quantum dynamics in the visual system has been documented using high- resolution spectroscopic and nuclear-magnetic resonance techniques which demonstrated coherent quantum waves in the rhodopsin molecule Lowenstein [14, 15] Similar observations have been made in other sensory systems, for example, it has been suggested that, electron tunneling in the olfactory receptors could play an important role in odor detection [16]. Others have linked the sensitivity of the bird’s eye to magnetic fields with long-term quantum entanglements in the cryptochromes of the retina [3, 16, 17].
The study of the effects of polarized light on the brain could provide a model to study classical principles of quantum mechanics such as quantum coherence. The classical fundamental principle of superposition posits in case of waves, that the resultant of adding N waves is the sum of the individual waves [18]. Quantum entanglement is a phenomenon in which the quantum states of two or more particles could be described with reference to each other, even though the individual particles may be spatially separated. In quantum mechanics, quantum coherence has been shown to be equivalent to quantum entanglement [19], in the sense that coherence can be described as entanglement, and conversely that each entanglement measure corresponds to a coherence measure.
If the particles oscillate at different frequencies, it implies that they have different wave speeds (wave speed=frequency x wavelength) and are separated by large physical space but could remain coherent because they have a constant phase difference. The fundamental law of quantum mechanics is that, the evolution is linear, meaning that if state X turns X’ and Y turns into Y’ after 2 seconds, then after 2 seconds the superposition ψ turns to a mixture of X’ and Y’ with the same coefficients as X and Y. However, both effects exist in a singular quantum state whereby when one is observed to be spin-up, the other will always be spin-down and vice versa, this is despite the fact that, it is impossible to predict according to quantum mechanics, which set of the measurements will be observed in the ‘entangled state’.
Understanding polarized light effects on the brain could lead to better understanding of quantum effects on the brain. Furthermore, to understand the application of quantum mechanics to explain the perception of light as a wave and/or particle, it is crucial to explain the concept of polarization of light and color perception. The polarization of light as an electromagnetic transverse wave is determined by quantum mechanical property of photons called spin. Linearly polarized light consists of equal numbers of photons with right and left hand spin with their phase synchronized so that they superpose to give oscillation in a plane [20, 21]. A beam of light that is plane polarized in a certain direction is made up of stream of photons which are each plane polarized in that direction.
In polarization, the electrical vector (e-vector) properties of the light waves are significant. At a specific angle known as Brewster’s angle (around 50 degrees for water), the degree of polarization attains 100%. Rayleigh’s scattering is incoherent particle scatter that is a widespread source of polarized light in the skyline and underwater [21]. The effects of skylight polarization and the neural mechanisms in insects have been fairly well studied [20, 21]. It is known that, migrating insects rely on the celestial polarization as cue to detect spatial direction. However, polarized light evokes intrinsic response in the visual system of primates and humans but little is known of the underlying neural mechanisms. The latter has been termed polarization sensitivity [21], which differs from true polarization vision, which is the ability to discriminate between different degrees and/or directions of linear and/ or elliptical polarization [22, 23] combined with complex behavioral responses [21].
The behavioral component associated with polarization vision further differentiates it from polarization sensitivity which manifests with stereotyped behavioral responses such as changes in navigation. Polarization sensitivity is mediated exclusively by the ultraviolet, middle and long spectral classes of cone photoreceptors [21, 24]. Humans can perceive polarization sensitivity as yellowish horizontal bar or bow-tie shape, with fuzzy edges usually referred to as Haidinger’s brush [25]. The latter was described by the mineralogist Wilheim Karl Ritter von Haidinger in 1844, as Lichtpolarisationsbüschel [25, 26, 27, 28]. Helmholtz H [27] proposed the radial analyzer hypothesis to explain the Haidinger’s phenomenon among the many other explanations [21, 27, 28, 29]. Helmholtz H [27] postulated that the yellow/dark brushes result from selective absorption of linearly polarized light by radiallysymmetric macular structures.
The neural substrates for processing polarization sensitivity and color perception lie within the visual cortex. The visual cortex comprises the primary visual cortex which is organized into a ventral occipitotemporal stream for representation of ‘what’ system, and the dorsal occipitoparietal stream demonstrates the ‘where’ [30, 31].
However, there is evidence to support integration of both dorsal and ventral stream information [32, 33]. There are anatomical and physiological correlates of the functional segregation of the two visual streams, by the arterial network of the blood flow supply system in the visual cortex. The visual pathways and extrastriate cortex ‘color centers’ [32] obtain blood supply from the territories of the posterior (PCA) and middle (MCA) cerebral arteries [34]. The vascular supply to the visual system as in other regions of the brain comes from these principal arteries of the circle of Willis that give rise to two different systems of secondary vessels called the ganglionic and cortical systems. The cortical and ganglionic systems are independent of each other and do not communicate at any point in their peripheral distribution. There is, between the parts supplied by the two systems, a borderline of diminished nutritive activity [34, 35]. The dorsal stream is perfused principally from the ganglionic system from the subcortical region to the cortical region, while the cortical system supplies the ventral stream from the cortical region to the subcortical region.
In a recent study, we applied conventional functional positron emission tomography and magnetic resonance imaging (fPET/MRI) technique to demonstrate cerebral metabolic changes during color processing in [36] the left visual cortex in male mice, but in the right visual cortex in females [37]. However, the conventional methods have poor image resolution and could not be used to segregate the processes taking place in various parts of the visual system. Therefore, we applied Fourier analysis of cerebral metabolism of [18F] fluorodeoxyglucose ([18F]FDG) to segregate gender- related differences in color processing, in male mice, in the ventral stream within the left visual cortex, while in female mice, in the dorsal stream within the right visual cortex [38]. We already demonstrated in human studies that, in men, the right hemisphere is dominant for major cognitive functions of general intelligence, [39] facial processing, [40] and color processing [41] while it women, the left hemisphere was dominant [39, 40, 41].
We postulate that, the effects of polarized light occur in areas of the brain in the primary visual cortex that are well-isolated and could accommodate non-trivial quantum effects. We propose that, the cytochrome oxidase (CO) blobs are regions found over the entire primary visual cortex which show increased metabolic activity [42]. These regions of the primary visual cortex of primates organized in CO blobs, might prevent the extremely high-speed of environment- induced decoherence in the brain. The color-sensitive neurons are found in the CO blobs inserted into hypercolumn that receive input from both eyes in a retinotopic pattern [43]. The CO blobs in V1 and CO stripes in V2 have been shown to receive direct input from the koniocellular layers of LGN and pulvinar nuclei, respectively [44, 45]. We therefore propose that, the CO blobs are ideal markers of modular organization of visual cortex that are spatially and functionally connected through nested hierarchical neural networks of structures that could possibly be implicated as environment for the effects of polarized light and non- trivial features of quantum mechanics such as coherence, tunnelling and maybe entanglement. It is plausible that, long-term quantum coherence would result from electron tunnelling within the CO blobs, which manifest by amplifying the lowest level quantum fluctuations upwards, modulating macroscopic increased cerebral metabolic activity.
To uncover the latter phenomenon, we applied Fourier time series analysis of the frequency-domain of the SUV mean values as a surrogate marker of cerebral metabolism to reveal the phenomena of long-term potentiation (LTP) and long-term depression in the cortical (CLTP, CLTD) and subcortical (SLTP, SLTD) regions during polarized light effects and yellow light, in male and female mice, respectively. We presume that, female mice would implement frequency- differencing [38, 41, 46] for photons in polarized light that induce non-trivial quantum fluctuations within the CO blobs in the dorsal stream in the right visual cortex. On the other hand, male mice, interactions by wavelength-differencing [46, 47] of polarized and yellow lights would follow classical fundamental principle of superposition of waves in the ventral stream in the left visual cortex.
We presumed that, yellow light in the long-wavelength spectrum would elicit wavelength-differencing effects in male mice, based on the wave nature of light. In contrast, polarized light comprising of photon particles travelling in one plane would elicit frequency-differencing effects in female mice, based on particle effects of light. The present work was designed to test the wave and particle duality effects of light on cerebral metabolism in the visual cortex in male and female mice, respectively. We explored the application of fundamental principles of classical and quantum superposition to explain the findings of the present work.
Materials and Methods
Experimental Animals
The experimental procedures have been described in detail elsewhere [37, 38]. All animal experiments were performed in accordance with the ‘Principles of laboratory animal care’ (NIH publication no. 85e23, revised 1985) as well as specific national laws approved by the institutional review board of the state of Saxony, Germany (Regierungspräsidium Leipzig, TVV08/13, Germany). The animals were anesthetised with isoflurane and all efforts were made to minimize pain. Five male and five female CD-1 mice (10 - 12 weeks, male = 34 ± 2.8 g; female = 26 ± 1.7 g) were housed under a 12 hour light: 12 hour dark cycle at 24°C, 60% humidity in a vented temperature-controlled animal cabinet (HPP110, Memmert GmbH & Co. KG; Schwabach, Germany), with free access to food and water. There was no randomization, such that animals were repeatedly imaged with PET on consecutive days to keep the daytime of measurement (e.g. the glucose/ insulin levels) and circadian entrainment constant.
There was no significant variation in weight of the animals over the several days of study in male (Day 1 = 34.5 ± 2.8g; Day 2 = 34.4 ± 2.4g; Day 3 = 33.7 ± 2.3g; Day 4 = 34.7 ± 2.3g; Day 5 = 34.3 ± 2.5g; Day 6 = 34.6 ± 2.5g; Day 7 = 34.1 ± 2.6g) and female mice (Day 1 = 25.6 ± 1.7g; Day 2 = 25.4 ± 1.3g; Day 3 = 25.5±1.5g; Day 4 = 25.6 ± 1.2g; Day 5 = 26.4 ± 1.4g; Day 6 = 26.2 ± 1.4g; Day 7 = 26.5 ± 1.3g). We applied intraperitoneal injections on the radiotracer ([18F]FDG), and the dose injected in male (Day 1 = 12.05 ± 1.23 MBq; Day 2 = 12 ± 0.9 MBq; Day 3 = 11.7 ± 1.2 MBq; Day 4 = 10.6 ± 0.5 MBq; Day 5 = 12.1 ± 1.7 MBq; Day 6 = 10.8 ± 1.2 MBq; Day 7 = 11.9 ± 1 MBq) and female (Day 1 = 12.7 ± 1.23 MBq; Day 2 = 12.7 ± 1.3 MBq; Day 3 = 12.6 ± 0.9 MBq; Day 4 = 13.9 ± 0.7 MBq; Day 5 = 11.4 ± 0.9 MBq; Day 6 = 12.3 ± 1.2 MBq; Day 7 = 12 ± 1.4 MBq) mice did not significantly change over the several days of the study. The random blood sugar levels were similar in male (10.1 ± 1.5 mmol/L) and female (7.8 ± 1.8 mmol/L) mice. At the end of the study, under anesthesia, the animals were euthanized by cervical dislocation.
Stimulation with Polarized and Yellow Lights
Figures 1a-1i (vi), shows the stimulations and protocol timeline similar to that used in previous studies [37, 38] we fixated the head of the animal and aligned the eye along a visual axis. The light stimulation passing through a polarizing filter directs polarized light along the axis of polarization. Then the yellow filter was placed in the filter grove in the light path of a custom-made animal chromatoscope. The stimulation device is a double barrel optic placed around both eyes and the nose ridge to separate both visual fields. A white screen illuminated through a light guide (OSL2YFB fibre bundle, Thorlabs Inc., Newton, New Jersey, USA) by a remote light source was placed at one end of the optical construction.
![Figure 1: Schematic diagram of the chromatoscope and scan protocol. The mouse head (Figure 1a) is positioned such that the eye (Figure 1b) is aligned for stimulation along the visual axis. The polarizing filter (Figure 1c) was used for monocular stimulation with the polarized light (Figure 1d) and then with yellow light through a Wratten Kodak Yellow filter (Figure 1e) placed in a groove of a binocular (Figure1f) holder (Figure 1g) attached to a fibre optic (Figure 1h) of a light source of 150 W luminosity with a color temperature of about 3200 K and 20 lumens/watt. Figure 1 (i) show the protocol timeline of injection, stimulation and data acquisition implemented in the order: (i) 5 min after initiation of anesthesia about 12 MBq [18F]FDG were injected i.p. and immediately followed by 20 min of light stimulation. Warming and respiration monitoring was continued throughout the whole scan protocol. (ii) After stimulation, the mouse was transferred to the PET scanner and it was started for a 20 min whole body scan, (iii) followed by an MRI scan for another 10 min.](/fulltextimages/6145/fig_1.png)
Figure 1: Schematic diagram of the chromatoscope and scan protocol. The mouse head (Figure 1a) is positioned such that the eye (Figure 1b) is aligned for stimulation along the visual axis. The polarizing filter (Figure 1c) was used for monocular stimulation with the polarized light (Figure 1d) and then with yellow light through a Wratten Kodak Yellow filter (Figure 1e) placed in a groove of a binocular (Figure1f) holder (Figure 1g) attached to a fibre optic (Figure 1h) of a light source of 150 W luminosity with a color temperature of about 3200 K and 20 lumens/watt. Figure 1 (i) show the protocol timeline of injection, stimulation and data acquisition implemented in the order: (i) 5 min after initiation of anesthesia about 12 MBq [18F]FDG were injected i.p. and immediately followed by 20 min of light stimulation. Warming and respiration monitoring was continued throughout the whole scan protocol. (ii) After stimulation, the mouse was transferred to the PET scanner and it was started for a 20 min whole body scan, (iii) followed by an MRI scan for another 10 min.
The light source used was a tungsten coil filament of a general service lamp that ran at a constant 21 V and 150 W, with maximum light output of the bulb of 40,000 foot candles (∼430,000 lux) power at tip of the fibre optic at maximum bulb intensity of 1.4 W/m2, a color temperature of about 3200 K and 20 lumens/watt (OSL2 High-Intensity Fiber Light Source, Thorlabs Inc., Newton, New Jersey, USA). The mouse eye had a fully dilated pupil with a numerical aperture of 0.49, which is twice the numerical aperture of the human eye. The white unpolarized light is passed through the polarizing filter and then the yellow filter through one eye over a circular region of ∼24° diameter on the retina. The light fixation point was positioned such that the rays were aligned with the transmission axis of the polarizer filter and focused along the visual axis direct to the fovea. Recordings were made in a laboratory room illuminated by ceiling- mounted fluorescent lamps (150 lux). The light stimulations were accomplished at about the same time of day in the same animal over the several days of study, to maintain synchronization (entrainment) to nature’s circadian cycle of ∼24 hours. The study in all animals in one day lasted for 6 hours from about 9:30 AM to 3:30 PM, with most male mice studied in the morning hours and female mice in the afternoon hours.
Testing Color Vision and Polarization E-Vector in Mice Using PET/MRI
The spectral absorption curves for the two types of cone pigment found in the mouse retina have λmax as follows: UV (ultraviolet) (360 nm); M (510 nm). The gelatine Wratten filter Deep Yellow (No. 12) with medium dominant wavelength of 510.7 nm (Kodak Photographic Filters) and the linear polarizing filter (LPVISA050-MP2; 12.5 mm OD, Wavelength range: 480-550 nm, Ø10.9 mm CA; Extinction ratio >10,000:1) were used. The linear polarizing filter used is a better alternative to conventional polymer- based polarizers because the ellipsoid silver nanoparticles embedded in sodium-silicate glass are used to generate the polarizing effect. Although both polarizer types absorb the light polarized perpendicular to the transmission axis, the nanoparticles have a significantly higher damage threshold and a dramatically better extinction ratio. The sodium- silicate glass is sandwiched between index-matched glass substrates, and a line is marked on the edge of the polarizing filter to indicate the polarization axis.
The mice were positioned prone in a special mouse bed (heated up to 37°C), with the head fixed to a mouth piece for the anaesthetic gas supply with 1.8% of isoflurane in 40% air and 60% oxygen (Anesthesia unit U-410, AgnTho’s AB, Lidingö, Sweden; Gas blender 100, MCQ Instruments, Rome, Italy) while the respiration was monitored for the duration of investigation. The radiotracer was administered to the animals through an i.p. injection of 12 ± 1 MBq [18F]FDG (Supplier: Prof. M. Patt, Department of Nuclear Medicine, University Hospital Leipzig, Leipzig, Germany) immediately followed by one 20 min stimulation. Following the injection, a whole body PET scan was started for a duration of 20 min, using a preclinical Scanner (nanoScan® PET-MRI, Mediso Medical Imaging Systems, Budapest, Hungary) as shown in the timeline of the scan protocol. For the stimulation, the anesthetized animal was positioned with both eyes open and fixed peeping through the double barrel optic connected to a light source behind the white screen. Mice under narcosis had their eyes open, pupil maximally dilated and did not blink. We employed short duration monocular deprivation for the duration of the stimulation (20 minutes) to excite the contralateral eye. Closure of eye was achieved by covering with 5% dexpanthenol ointment (Bepanthen, Bayer, and Germany).
Each animal was investigated only once a day while one stimulation and one [18F]FDG injection were applied followed by a 24 h recovery period. The experiment was designed with a high-throughput protocol of time-shift overlaid parallelization. This meant that rather than carrying out single experiments in one animal after another, we overlaid several tasks with start of stimulation in one animal preceding the other by about 25 minutes, therefore shortening the overall time for experiments due to a carefully planned time-motion study.
The following three study conditions were used:
- Dark: both eyes (1) closed (short: dark)
- Polarizer: left (2) or right (3) eye open and subjected to standard light source with polarizing filter (short: PolarizerL, PolarizerR)
- Yellow: left (4) or right (5) eye open and subjected to standard light source with yellow filter (short: YellowL, YellowR).
Imaging and Analysis with PET/MRI
The PET image was corrected for random coincidences, dead time, scatter and attenuation, based on a whole body MRI scan (T1 weighted gradient echo sequence (GRE), TR= 20 ms; TE= 6.4 ms; matrix size: 160x160x62, resolution: 0.04x0.04x0.05 cm, slice thickness: 0.5mm acquisition duration 12 min) immediately following the PET acquisition. The attenuation correction is based on a 2-tissue segmentation, animal tissue (attenuation of water) and air. Based on this segmentation a material map is calculated with two homogenous regions containing the µ-values (water and air) to calculate the photon attenuation of the mouse [48]. The T1 images from this sequence were also used for the identification of anatomical details. The PET data was collected by a continuous whole body scan during the entire investigation in list-mode (scan duration 20 min). Subsequently, the data was reconstructed into 4 uniform time frames (5 min each). The reconstruction parameters for the list mode data were 3D-ordered subset expectation maximization (OSEM) with 4 iterations and 6 subsets, energy window: 400-600 keV, coincidence mode: 1-5, ring difference 81.
Two observers performed the coregistration of the fPET/ MRI data, the delineation of the volume of interest (VOI), and the data analysis using ROVER (ABX advanced biochemical compounds, Radeberg, Germany, v.2.1.15). Starting with manual coregistration of the PET images to the respective T1 weighted MR data of each animal, then followed by delineation of the VOI in the right and left hemispheres, using the MRI information from the GRE scan. The VOI in the visual cortex with tracer concentration is a sample volume of a cylindrical mask in a space stretching from the primary visual cortex to the extrastriate cortex perfused by both the ganglionic branches (e.g lenticulostriate arteries) and cortical arteries from the main stems of the middle cerebral artery (MCA) and posterior cerebral artery (PCA) [34, 49].
A micro-CT image demonstrates the actual mesh of arterial trees within the area marked as VOI [49]. The contour VOI is defined as a stack of planar, closed polygons called regions-of-interest (ROI). The contours are manually and semi-automatically outlined on the loaded images, and the pixels contained within the contour boundaries are considered for the VOI statistics. The contour vertices coordinates are defined as the (x, y, z) triples, of which the x, y and z offsets are in mm from the image origin. For data analysis three separated VOIs were delineated. First, a whole cortex (Ctx) cylindrical mask with (x, y, z) pixel size (20, 20, 20) or (0.6 cm, 0.6 cm, 0.6 cm) was created to cover most arteries of the two parts of this brain area [37, 38]. It was centered at the midline in coronal view of the fPET/ MRI image. Using the transverse plane for orientation of tracer accumulation, the VOI extends from the ventromedial occipital region through the posterior inferior temporal cortex. Two sub-volume VOIs with mask (x, y, z) pixel size (10, 10, 10) or (0.3 cm, 0.3 cm, 0.3 cm) were placed from the midpoint to the right border (visCtxR) and to the left border (visCtxL) of the Ctx mask [37, 38].
The definition of the VOIs was in homologous areas on both sides of the brain in coronal plane. Hemisphere-specific [18F]FDG accumulation was expressed as standardized uptake value (SUV) [50, 51]. The SUV is defined as the ratio of the tissue radioactivity concentration c (Bq/g) at time point t, and the injected activity divided by the body weight. The investigation of specific tracer uptake was performed at four mid-frame time points: 29.5, 34.5, 39.5 and 44.5 min, after the radiotracer injection. The SUV values were obtained over time for group a (males) and group B (females) under the aforementioned light stimulation conditions, for the three brain regions Ctx, visCtxR and visCtxL. We refrained from kinetic modeling, but used the SUV values as a surrogate marker for CMRGlc. The consideration was that, a full quantification of cerebral metabolic rate of glucose (CMRGlc) would require dedicated kinetic modeling as well as arterial blood sampling. Considering the small blood volume of mice, repeated arterial blood sampling is challenging, furthermore the study design did not allow us to obtain PET data in this study immediately following the injection of [18F]FDG.
Data Statistics
All analyses were performed using the software packages Statistica for Windows (Dell, Aliso Viejo, CA, USA) and SPSS Version 20 (IBM, Armonk, NY, USA). Results are displayed as Mean ± SD. We examined the sample data for randomness using the Runs test in SPSS before further calculations, and the test revealed that the samples were randomly selected. Random data has autocorrelation near zero for any and all time lags separations and the Box-Ljung Q statistic was not significant based on asymptotic chi-square approximation at any lag. This was followed by multivariate generalization applying a MANOVA with repeated measures test to the same data. The multivariate test Wilks’ lambda (Λ) was calculated. Although the multivariate test provides information of the significance of at least one mean pairing, it is unclear from the multivariate test for which individual comparison the observed mean difference is significant. Therefore, in order to determine the significance of these differences, a series of univariate ANOVA and paired t-tests are conducted. To examine the contribution of the main effects we estimated the partial eta2 as the ratio of variance associated with an effect, plus that effect and its error variance.
Partial η2= SSeffect / SSeffect+ SSerror.
The results show the percentage of variance in each effect or interaction, and the error that is accounted for by that effect.
One of the core assumptions is that of sphericity [51, 52], a special case of circularity assumptions, which checks if the variance/covariance matrix of the observed data follows a particular pattern. This pattern usually should be identified as one with equal variances in the diagonal and equal covariance in the off-diagonal elements. We tested sphericity by inspecting the Mauchly’s Test for equivalence of the hypothesized and the observed variance/ covariance patterns before proceeding with further analysis. Furthermore, specific differences between various conditions were analysed using the paired or unpaired t-test. The level of significance was set at p≤0.05. The stationarity assumption of the time series was tested with the Augmented Dickey-Fuller (ADF) test using the software package STATA (Stata Corp LLC, College Station, TX, USA). It is known that the unit roots can cause unpredictable results in the data of a time series analysis. The ADF test is the unit root test for stationarity with the power to handle complex models compared to the Dickey-Fuller test [53] (see Supplementary Information for details).
Time Series Analysis
We applied spectrum analysis to examine the cyclical patterns of data of the mean ± SD SUV values (see Supplementary Information for theoretical details). The exploration of the cyclical components is based on the rationale that it may correlate to the frequency of neuronal discharges in a given region of the brain during the observed phenomenon. We sort to uncover just a few recurring cycles of different lengths in the time series of metabolic activity that may reveal the seemly random noise of neuronal activity. Fourier transform algorithm and [54] other statistical analyses were applied using standard software (Time series and forecasting module, Statistica for Windows, StatSoft, OK, USA) and SPSS Version 20 (IBM). The spectrum analysis was applied to the SUV values provided in Table 1, to obtain spectral density coefficients given in Table 2, in male and female mice, respectively.
The time series with 20 data points for each stimulus condition were analysed for males and females, respectively. The analysis begins in Fourier analysis dialog window, by choosing spectral density estimates and the Hamming window [55, 56], then Plot to display cyclical patterns in male and female mice, respectively. The single series Fourier analysis was used to derive the spectral density estimates, and were plotted, the frequency regions with the highest estimates were marked as peaks. The spectral density estimates between two minima including the peak (as maxima) were analysed to examine the effects of stimuli on cortical and subcortical sites. The spectral density peaks were identified as cortical (C-peak) and subcortical (S-peaks) whose peaks occurred at regular frequency intervals of 0.2 and 0.4, respectively. The response to stimulus was evaluated using the area under the curve for a particular stimulus and was compared to that derived from another stimulus.
Further statistical analysis was carried out using the five data points from trough-to-peak-to-trough for the C-peak and S-peak, respectively, as shown in Table 2. A cross-spectrum analysis was implemented to examine the relationship between the two times series in the left and right visual cortex during stimulation with polarized and yellow lights through the contralateral eye, in male and female mice, respectively [57, 58]. The cross-amplitude values were computed as the square root of the sum of the squared cross-density and quad-density values. It was interpreted as a measure of the covariance between the respective frequency components in the two series. The phase spectrum estimates show the extent to which each frequency component of one series leads the other. The gain was interpreted as the standard least squares regression coefficient for the respective frequencies. The squared coherency was interpreted as the squared correlation coefficient of the two time series in the given context.
Another way to consider coherency or a possibility of entanglement dynamics is to examine the two time series in a multiple regression analysis and find the “best fit” model to describe the relationship of the spectral coefficients derived from photon effects of yellow light and polarized light stimuli in male and female mice. The hypotheses:
Ho: β = 0 (energy of photons in Polarized light is not a useful predictor of energy of photons in Yellow light.) Ho: β ≠ 0 (energy of photons in Polarized light is a useful predictor of energy of photons in Yellow light.) Significance level α = 0.05.
We reject the null hypothesis if p-value ≤ 0.05.
We determine the linear relationship among the variables in the regression analysis by examining the ANOVA table in SPSS output. If the value of F statistic is statistically significant at a level of 0.05 or less, this suggests a linear relationship among the variables. The regression coefficient values in column B of the table represent the extent to which the value of the independent variable contributes to the value of the dependent variable. The t-value in the coefficients table indicates the variables statistical significance. After visual inspection of the scatter plot the data was fitted with linear and nonlinear models including:
- Linear model with equation: Y = b0 + (b1 * X).
- Logarithmic model with equation: Y = b0 + (b1 * ln(X)).
- Exponential model with equation: Y = b0 * (e**(b1 * X)) or ln(b0 = ln(b0) + (b1 * X).
The most fitted curve was used for further analysis. The R value denotes the simple correlation between both time series. The R2 value indicates how much of the total variation in the dependent variable can be explained by the independent variable.
Results
Gender Differences in PET Images
The PET images, in sagittal, coronal and transverse views, from which the SUV data were derived are shown in male mice and female mice. The images clearly show gender differences in dark condition and during stimulation with polarized light and yellow light in transverse view. In male mice, compared to dark condition (transverse), polarized light stimulation (transverse) showed the least radiotracer accumulation in both visual cortices, while yellow light stimulation (transverse) showed the highest radiotracer enhancement in both visual cortices.
On the other hand, in female mice, compared to dark condition (transverse), polarized light stimulation (transverse) showed highest radiotracer accumulation in both visual cortices, but yellow light stimulation (transverse), showed the least radiotracer accumulation. In other words, gender differences in the PET images were most pronounced during polarized light stimulation, with greater tracer accumulation in the visual cortex in female (transverse) than in male (transverse) mice. On the other hand, in male but not female mice, there was greater tracer accumulation during yellow light stimulation in the visual cortex transverse). The quantitative measurements of SUV values were made within the VOI positioned on the vascular network in the right and left visual cortex, on PET and MRI images (Figures 2A-I).
![Figure 2: The PET images (Figure 2 A-I), in sagittal, coronal and transverse views, from which the SUV data were derived are shown in male mice (Figure 2 A-C) and female mice (Figure 2 D-F). The VOI setup in mouse brain using a micro-CT image [49] is shown in transverse view (Figure 2 G), in PET (Figure 2 H) and PET/MRI (Figure 2 I) images. The image shows the arterial tree of the middle and posterior cerebral arteries including the cortical and ganglionic branches in the mouse brain. The figure illustrates the VOIs used for data analysis in relation to the brain vascular system, red: Ctx, black: visCtxL and green: visCtxR [with permission].](/fulltextimages/6145/fig_2.png)
Figure 2: The PET images (Figure 2 A-I), in sagittal, coronal and transverse views, from which the SUV data were derived are shown in male mice (Figure 2 A-C) and female mice (Figure 2 D-F). The VOI setup in mouse brain using a micro-CT image [49] is shown in transverse view (Figure 2 G), in PET (Figure 2 H) and PET/MRI (Figure 2 I) images. The image shows the arterial tree of the middle and posterior cerebral arteries including the cortical and ganglionic branches in the mouse brain. The figure illustrates the VOIs used for data analysis in relation to the brain vascular system, red: Ctx, black: visCtxL and green: visCtxR [with permission].
Gender Differences in Spectral Coefficients
One of the core underlying assumptions in the univariate RM-ANOVA procedure is that of sphericity. If sphericity is observed the RM-ANOVA procedure provides a powerful test about the repeated measures. In order to test sphericity we inspect Mauchly’s Test, which tests for the equivalence of the hypothesized and the observed variance/covariance patterns. The test is not significant, W= 0.838; χ2 (2) = 2.995, p = 0.224, suggesting that the observed matrix does have approximately equal variances and equal covariance’s.
To analyze the gender-related differences in the right (visCtxR) and left (visCtxL) visual cortex during all conditions, a MANOVA with repeated measures of spectral density coefficients derived from [18F]FDG SUV, with a 3 x 2 x 2 x 2 design: three levels of Stimuli (Dark, Polarized light, Yellow light) and two levels of Side (right, left), two levels of Gender (male, female) and two levels of Peaks (C-peak, S-peak) is performed. There is a main effect of the Stimuli, F(2,15) =
11.591, Wilk’s Λ = 0.393, partial η2= 0.607, p <0.001. There is a main effect of Side, F(1,16) = 12.187, Wilk’s Λ = 0.568, partial η2= 0.432, p <0.05. There is a four-way interaction between, Stimuli x Side x Gender x Peaks, F (2,15) = 6.796, partial η2= 0.475, Wilk’s Λ = 0.525, p <0.05. The partial eta2 suggests that Stimuli accounted for 60.7% of the variance in the dependent variable, and acting along with Side (which accounted for 43.2%) accounted for all the variance.
Figures 3(A-B) shows the Box and Whiskers plots of means ±SD of spectral density coefficients of both C-peak and S-peak in male and female mice. Paired t-test comparison revealed side-to-side differences in male mice (Figure 3A). During Yellow light stimulation, the right (visCtxR = 0.0449±0.0393), was higher than the left (visCtxL = 0.0195±0.0116), mean difference = 0.0254±0.0320 (95% confidence interval = 0.0025, 0.0483), t = 2.51, df (9), p < 0.05, due to attenuation effects of the stimulus in the left visual cortex. The right visual cortex, was not activated but rather remained quiescent and lower than in dark condition (visCtxR = 0.0523±0.043), mean difference = 0.0074±0.0049 (95% confidence interval = 0.0039, 0.0109), t = 4.775, df (9), p < 0.001. On the other hand, polarized light did not cause side-to-side differences, but the left visual cortex (RvisCtxL = 0.03±0.033), was attenuated relative to dark condition (0.077±0.095), mean difference = 0.046±0.062 (95% confidence interval = 0.002, 0.091), t = 2.364, df (9), p < 0.05.
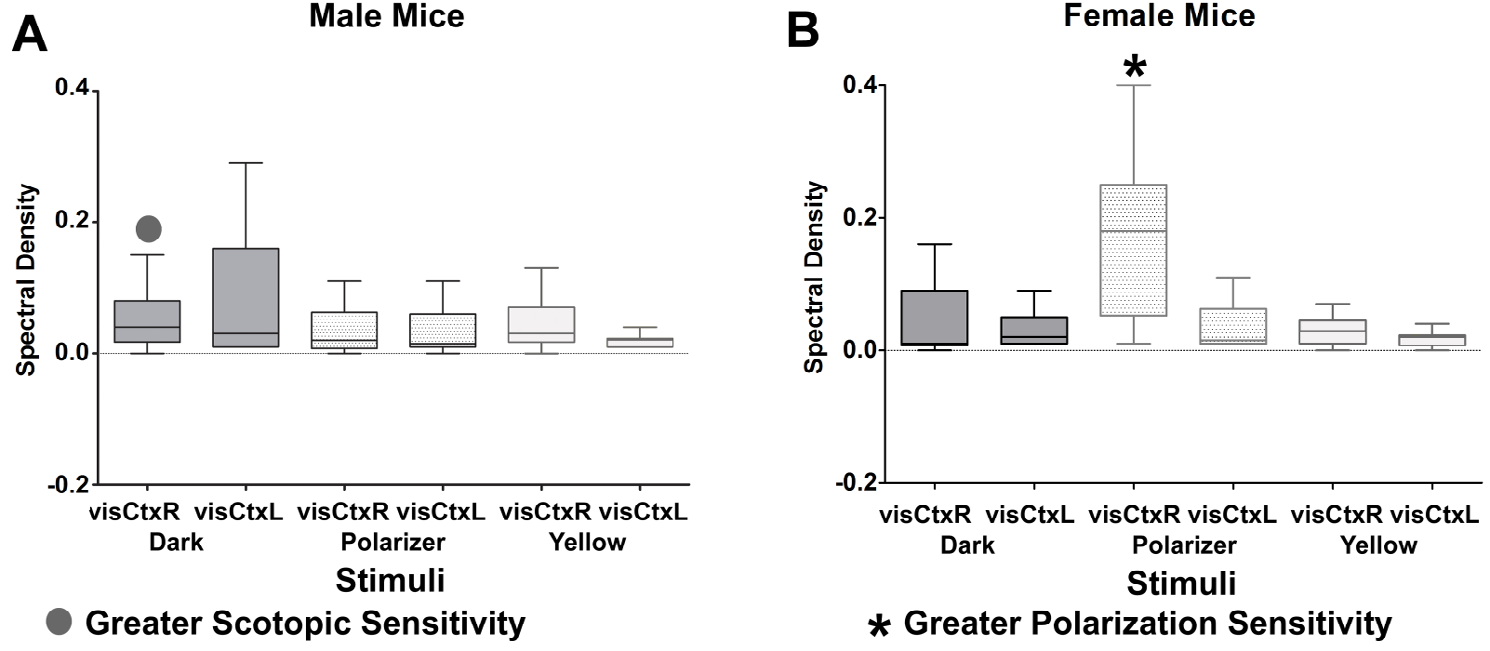
Figure 3 (A-B): shows the Box and Whiskers plots of means±SD of spectral density coefficients of both C-peak and S-peak in male (Figure 3A) and female (Figure 3B) mice. Male mice had higher scotopic sensitivity than female mice, while female mice had higher polarization sensitivity than male mice (see Figure 3 A-B, dot and asterisks).
To identify the visual stream where responses were elicited in male and female mice, a one-ANOVA was undertaken for C-peak and S-peak, respectively. The analysis revealed that there is a significant gender-related difference in scotopic vision under [59] dark condition and during polarized light stimulation. In male mice under dark condition, the C-peak in the right visual cortex (LvisCtxR = 0.033±0.025) was higher than that in female mice (LvisCtxR = 0.0053±0.003), F (1,9) = 5.94, MS = 0.002, p < 0.05. Conversely, in female mice during polarized light stimulation, the S-peak in the right visual cortex (LvisCtxR = 0.195±0.139) was higher than that in male mice (LvisCtxR = 0.017±0.01), F (1,9) = 8.1, MS = 0.079, p < 0.05. In other words, male mice had higher scotopic sensitivity than female mice; while female mice had higher polarization sensitivity than male mice (see Fig. 3 A-B, dot and asterisks).
We tested our postulates, to examine if polarization e-vector is processed within the same three-dimensional color space in male and female mice. We applied t-test statistics of paired samples. In male mice, the effects of polarized light significantly attenuated cortical C-peak in the ventral stream of the left visual cortex (RvisCtxL = 0.0107±0.006) compared to dark condition (visCtxL = 0.016±0.009), mean difference = 0.0057±0.004 (95% confidence interval = 0.00037, 0.011), t = 2.97, df (4), p < 0.05. There was opponent response of polarizer/yellow pairs. Compared to polarized light effects, the yellow light stimulation (RvisCtxL = 0.02±0.0135) produced opponent response of accentuation of C-peak, mean difference = 0.0097±0.0076 (95% confidence interval = 0.019, 0.0003), t = 2.85, df (4), p < 0.05.
In female mice, the opposite trend to that in male mice was observed. The effects of polarized light on the subcortical S-peak in the dorsal stream in the right visual cortex (LvisCtxR = 0.195±0.139) was significantly accentuated compared to dark condition (visCtxR = 0.075±0.057), mean difference = 0.12±0.083 (95% confidence interval = 0.223, 0.018), t = 3.26, df (4), p < 0.05. There was opponent response of polarizer/yellow pairs. The polarized light effects was significantly higher than that during yellow light stimulation (LvisCtxR = 0.019±0.012), mean difference = 0.037±0.026 (95% confidence interval = 0.005, 0.069), t = 3.25, df (4), p < 0.05.
The spectral density plot defined the cluster of frequencies around the cortical and subcortical peaks most implicated in the processing mechanisms in male and female mice, respectively. It is worthy to note that, the scale used in male mice for the spectral density plots of C-peaks and S-peaks were about twice higher than that for female mice for dark condition and yellow light stimulation. Conversely, for the effects of polarized light, in female mice, the scale for the spectral density C-peaks and S-peaks were at least three times higher than in male mice. The gender-related difference was significant during stimulation with polarized light, in female mice, the subcortical S-peak was sixteen times higher than that in male mice (Figures 4A-L), (p<0.05).
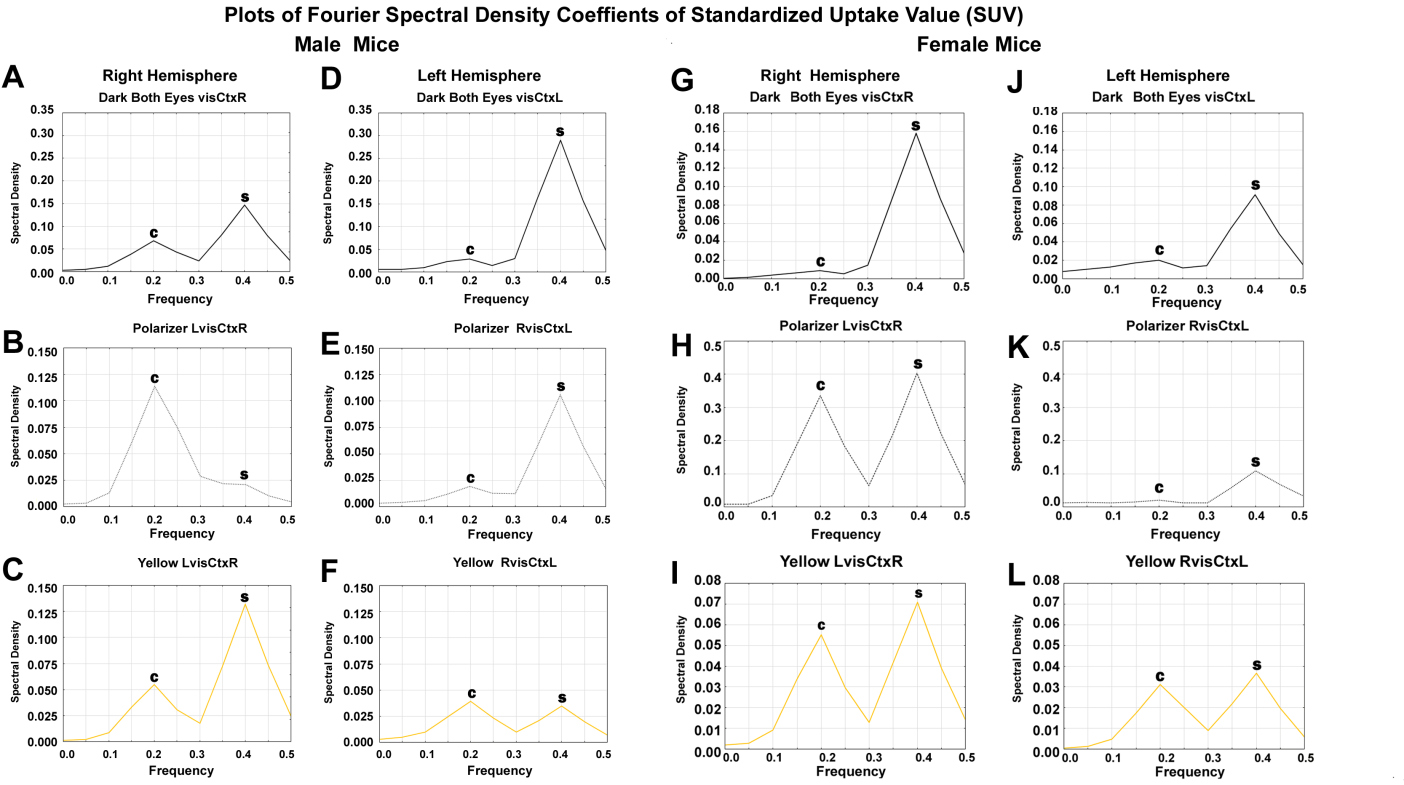
Figure 4 (A-L): The changes in spectral density C-peaks and S-peaks across frequencies in the right and left visual cortex, in male and female mice are graphically illustrated in Figure 4 A-L. In male mice (Figure 4 A-F), there is significant attenuation of C-peak in ventral stream of the left visual cortex due to the effects of polarized light (Figure 4 E) compared to dark condition (Figure 4 D) and yellow light (Figure 4 F) stimulation, (p < 0.05). On the other hand, in female mice, there is significant accentuation of S-peak in the dorsal stream of the right visual cortex due to the effects of polarized light (Figure 4 H) compared to dark condition (Figure 4 I) and yellow light (Figure 4 I) stimulation, p < 0.05).
Table 1 presents the raw data of SUV values for male and female mice in visCtxR and visCtxL during dark condition, stimulation with polarized and yellow lights through the right and left eye, respectively. Tables 2 & 3 shows the results of the spectral analysis of SUV values. Table 4 summarizes the spectral density coefficients for C-peak and S-peak in male and female mice in dark condition and during polarized light and yellow light stimulations.
| Stimulation | Dark | Dark | PolarizerR | PolarizerR | PolarizerL | PolarizerL | YellowR | YellowR | YellowL | YellowL |
|---|---|---|---|---|---|---|---|---|---|---|
| Visual Cortex | visCtxR | visCtxL | visCtxR | visCtxL | visCtxR | visCtxL | visCtxR | visCtxL | visCtxR | visCtxL |
| Time | Male Mice (n=5) | |||||||||
| 150 | 1.48 | 1.28 | 1.06 | 1.02 | 1 | 1 | 1.48 | 1.31 | 1.16 | 1.08 |
| 150 | 1.41 | 1.23 | 1.4 | 1.38 | 1.33 | 1.23 | 1.24 | 1.32 | 1.01 | 0.91 |
| 150 | 1.52 | 1.55 | 1.41 | 1.18 | 1.21 | 1.2 | 1.54 | 1.5 | 1.42 | 1.46 |
| 150 | 0.99 | 0.97 | 1.29 | 1.35 | 1.92 | 1.65 | 1.48 | 1.43 | 1.19 | 1.13 |
| 150 | 1.38 | 1.34 | 1.41 | 1.33 | 1.13 | 1.2 | 1.48 | 1.55 | 1.16 | 1.18 |
| 450 | 1.44 | 1.2 | 1.08 | 1.15 | 1 | 0.94 | 1.5 | 1.36 | 1.2 | 1.18 |
| 450 | 1.35 | 1.21 | 1.42 | 1.51 | 1.36 | 1.33 | 1.26 | 1.37 | 1.07 | 0.96 |
| 450 | 1.52 | 1.73 | 1.36 | 1.35 | 1.2 | 1.15 | 1.57 | 1.62 | 1.49 | 1.46 |
| 450 | 1.06 | 1.07 | 1.36 | 1.33 | 1.85 | 1.82 | 1.47 | 1.45 | 1.21 | 1.27 |
| 450 | 1.49 | 1.47 | 1.38 | 1.4 | 1.27 | 1.18 | 1.56 | 1.49 | 1.29 | 1.24 |
| 750 | 1.53 | 1.32 | 1.11 | 1.09 | 0.97 | 1 | 1.51 | 1.25 | 1.26 | 1.29 |
| 750 | 1.38 | 1.21 | 1.52 | 1.52 | 1.43 | 1.34 | 1.27 | 1.41 | 1 | 0.93 |
| 750 | 1.45 | 1.66 | 1.36 | 1.24 | 1.22 | 1.22 | 1.64 | 1.6 | 1.5 | 1.47 |
| 750 | 1.12 | 1.15 | 1.38 | 1.51 | 1.78 | 1.84 | 1.53 | 1.48 | 1.33 | 1.22 |
| 750 | 1.46 | 1.45 | 1.45 | 1.36 | 1.22 | 1.3 | 1.46 | 1.57 | 1.29 | 1.32 |
| 1050 | 1.48 | 1.41 | 1.12 | 1.16 | 1 | 1 | 1.6 | 1.38 | 1.3 | 1.26 |
| 1050 | 1.29 | 1.24 | 1.48 | 1.44 | 1.41 | 1.28 | 1.21 | 1.36 | 0.99 | 0.97 |
| 1050 | 1.55 | 1.61 | 1.42 | 1.28 | 1.13 | 1.2 | 1.57 | 1.59 | 1.5 | 1.5 |
| 1050 | 1.19 | 1.14 | 1.44 | 1.35 | 1.86 | 1.72 | 1.53 | 1.44 | 1.31 | 1.29 |
| 1050 | 1.44 | 1.37 | 1.38 | 1.32 | 1.27 | 1.25 | 1.52 | 1.46 | 1.4 | 1.43 |
Table 1: The SUV values for each time measurement obtained during dark condition, polarized and yellow light stimulation in time
| Time | Female Mice (n=5) | |||||||||
|---|---|---|---|---|---|---|---|---|---|---|
| 150 | 1.14 | 0.99 | 1.21 | 1.29 | 1.37 | 1.18 | 1.21 | 1.24 | 1.28 | 1.21 |
| 150 | 1.31 | 1.22 | 1.28 | 1.27 | 1.44 | 1.43 | 1.35 | 1.23 | 1.32 | 1.39 |
| 150 | 1.06 | 1.11 | 1.42 | 1.44 | 1.41 | 1.5 | 1.15 | 1 | 1.01 | 1.01 |
| 150 | 1.39 | 1.37 | 1.07 | 1.1 | 1.55 | 1.69 | 1.16 | 1.18 | 1.26 | 1.28 |
| 150 | 1.21 | 1.25 | 1.42 | 1.38 | 1.51 | 1.49 | 1.16 | 1.18 | 1.23 | 1.32 |
| 450 | 1.17 | 1.16 | 1.24 | 1.42 | 1.31 | 1.13 | 1.25 | 1.27 | 1.38 | 1.28 |
| 450 | 1.26 | 1.28 | 1.27 | 1.37 | 1.36 | 1.44 | 1.4 | 1.25 | 1.41 | 1.41 |
| 450 | 1.03 | 1.12 | 1.45 | 1.5 | 1.49 | 1.57 | 1.21 | 0.98 | 1.08 | 1.01 |
| 450 | 1.4 | 1.31 | 1.23 | 1.16 | 1.62 | 1.8 | 1.19 | 1.23 | 1.23 | 1.29 |
| 450 | 1.18 | 1.17 | 1.38 | 1.45 | 1.67 | 1.56 | 1.19 | 1.23 | 1.21 | 1.29 |
| 750 | 1.11 | 1.17 | 1.32 | 1.4 | 1.26 | 1.1 | 1.25 | 1.19 | 1.3 | 1.35 |
| 750 | 1.33 | 1.33 | 1.27 | 1.34 | 1.35 | 1.38 | 1.47 | 1.23 | 1.52 | 1.51 |
| 750 | 1.01 | 1.1 | 1.45 | 1.46 | 1.51 | 1.5 | 1.16 | 1.01 | 1.05 | 1.13 |
| 750 | 1.46 | 1.49 | 1.24 | 1.18 | 1.6 | 1.59 | 1.18 | 1.19 | 1.27 | 1.22 |
| 750 | 1.16 | 1.14 | 1.45 | 1.56 | 1.63 | 1.62 | 1.18 | 1.19 | 1.25 | 1.3 |
| 1050 | 1.17 | 1.05 | 1.43 | 1.41 | 1.2 | 1.12 | 1.27 | 1.2 | 1.28 | 1.25 |
| 1050 | 1.35 | 1.32 | 1.29 | 1.35 | 1.29 | 1.3 | 1.41 | 1.34 | 1.44 | 1.53 |
| 1050 | 0.97 | 1.09 | 1.65 | 1.51 | 1.62 | 1.53 | 1.23 | 1.08 | 1.14 | 1.09 |
| 1050 | 1.37 | 1.33 | 1.27 | 1.18 | 1.55 | 1.59 | 1.18 | 1.17 | 1.24 | 1.28 |
| 1050 | 1.11 | 1.14 | 1.49 | 1.44 | 1.5 | 1.49 | 1.18 | 1.17 | 1.24 | 1.2 |
Table 2: Time series in female mice.
| Stimulation | Dark | Dark | PolarizerR | PolarizerR | PolarizerL | PolarizerL | YellowR | YellowR | YellowL | YellowL | |
|---|---|---|---|---|---|---|---|---|---|---|---|
| Visual Cortex | visCtxR | visCtxL | visCtxR | visCtxL | visCtxR | visCtxL | visCtxR | visCtxL | visCtxR | visCtxL | |
| Male Mice | |||||||||||
| C-peak | 0.005 | 0.006 | 0.001 | 0.004 | 0.003 | 0.011 | 0.002 | 0.005 | 0.002 | 0.005 | |
| 0.012 | 0.01 | 0.002 | 0.006 | 0.013 | 0.031 | 0.004 | 0.01 | 0.008 | 0.009 | ||
| 0.038 | 0.023 | 0.003 | 0.012 | 0.061 | 0.142 | 0.019 | 0.025 | 0.033 | 0.038 | ||
| 0.068 | 0.029 | 0.004 | 0.019 | 0.114 | 0.248 | 0.034 | 0.039 | 0.055 | 0.068 | ||
| 0.043 | 0.015 | 0.005 | 0.013 | 0.075 | 0.134 | 0.019 | 0.023 | 0.031 | 0.038 | ||
| S-peak | 0.023 | 0.03 | 0.013 | 0.012 | 0.028 | 0.031 | 0.013 | 0.01 | 0.017 | 0.023 | |
| 0.081 | 0.162 | 0.054 | 0.058 | 0.022 | 0.035 | 0.051 | 0.021 | 0.073 | 0.098 | ||
| 0.147 | 0.29 | 0.099 | 0.106 | 0.021 | 0.049 | 0.088 | 0.035 | 0.132 | 0.18 | ||
| 0.08 | 0.157 | 0.06 | 0.057 | 0.01 | 0.026 | 0.048 | 0.02 | 0.073 | 0.1 | ||
| 0.025 | 0.048 | 0.025 | 0.017 | 0.005 | 0.008 | 0.016 | 0.007 | 0.025 | 0.033 | ||
| Female Mice | |||||||||||
| C-peak | 0.002 | 0.01 | 0.002 | 0.014 | 0.009 | 0.008 | 0.002 | 0.001 | 0.003 | 0.006 | |
| 0.004 | 0.013 | 0.005 | 0.012 | 0.034 | 0.034 | 0.006 | 0.005 | 0.009 | 0.012 | ||
| 0.007 | 0.017 | 0.025 | 0.015 | 0.184 | 0.171 | 0.028 | 0.017 | 0.034 | 0.033 | ||
| 0.009 | 0.02 | 0.045 | 0.02 | 0.335 | 0.305 | 0.05 | 0.031 | 0.055 | 0.048 | ||
| 0.005 | 0.012 | 0.026 | 0.012 | 0.184 | 0.164 | 0.027 | 0.02 | 0.03 | 0.025 | ||
| S-peak | 0.015 | 0.014 | 0.014 | 0.012 | 0.064 | 0.047 | 0.006 | 0.009 | 0.013 | 0.013 | |
| 0.086 | 0.054 | 0.049 | 0.058 | 0.22 | 0.142 | 0.012 | 0.022 | 0.042 | 0.055 | ||
| 0.158 | 0.091 | 0.088 | 0.109 | 0.403 | 0.26 | 0.021 | 0.037 | 0.071 | 0.103 | ||
| 0.087 | 0.049 | 0.052 | 0.068 | 0.22 | 0.146 | 0.012 | 0.02 | 0.039 | 0.059 | ||
| 0.028 | 0.015 | 0.02 | 0.033 | 0.068 | 0.051 | 0.005 | 0.006 | 0.014 | 0.022 |
Table 3: Spectral coefficients (mean ± SD) in the contralateral right and left visual cortex in male and female mice, percent cha
- Table 3: Fourier spectral density obtained during dark condition, stimulation with polarized and yellow light in male and female mice, respectively.
- Stimulation through Eye
- (R, L)
- Brain area
- C-peak
- Male
- Female
- Δ % df
- F-value p <
- &
- *Dark visCtxR
- C-peak
- 0.033±0.025
- 0.005±0.003
- 85%
- 1,8
- 5.938
- 0.05
- S-peak
- 0.071±0.051
- 0.075±0.057
- 5.63%
- 1,8
- 0.009
- NS
- *Dark visCtxL
- C-peak
- 0.016±0.009
- 0.015±0.004
- 6.30%
- 1,8
- 0.166
- NS
- S-peak
- 0.137±0.105
- 0.045±0.032
- 67%
- 1,8
- 3.558
- NS
- PolarizerL visCtxR
- C-peak
- 0.053±0.045
- 0.149±0.132
- -181%
- 1,8
- 2.351
- NS
- S-peak
- 0.172±0.01
- 0.195±0.139
- -13.40%
- 1,8
- 8.112
- 0.05
- PolarizerR visCtxL
- C-peak
- 0.011±0.006
- 0.015±0.004
- -26.70%
- 1,8
- 1.543
- NS
- S-peak
- 0.05±0.038
- 0.056±0.037
- -12%
- 1,8
- 0.061
- NS
- YellowL visCtxR
- C-peak
- 0.026±0.021
- 0.026±0.021
- 0%
- 1,8
- 0.001
- NS
- S-peak
- 0.064±0.046
- 0.036±0.024
- 44%
- 1,8
- 1.481
- NS
- YellowR visCtxL
- C-peak
- 0.02±0.014
- 0.015±0.012
- 25%
- 1,8
- 0.456
- NS
- S-peak
- 0.019±0.011
- 0.019±0.012
- 0%
- 1,8
- 0
- NS
Table 4: Spectral coefficients (mean ± SD) in the contralateral right and left visual cortex in male and female mice, percent
We localized the gender-related differences, which showed significant percent change (Δ %) under dark condition, where the cortical C-peak in the right visual cortex (visCtxR) in male mice was by 85% higher than in female mice (p<0.05). Conversely, in female mice, during stimulation with polarized light through the left eye in the right visual cortex (LvisCtxR), the subcortical S-peak was higher by 13.4% than in male mice, (p<0.05). In other words, the findings agree with the tracer accumulation on PET images showing that female mice had greater effects of polarized light stimulation than in male mice due to subcortical activity within the dorsal stream. However, a more specific definition of the processes underlying the gender differences would be needed to determine the differences in mechanisms.
Figures 5(A-F), shows the plots of cross-correlation function (CCF) by frequency in male mice, there is a significant correlation at lag zero, then gradually decremental side lobes in a sine wave pattern suggesting that, the two dominant sine waves could be crest-to-trough but shifted in phase. This may indicate that, there is wavelength-differencing at C-peaks within the ventral stream in the left visual cortex for paired comparisons of polarizer RvisCtxL vs yellow RvisCtxL, polarizer RvisCtxL vs polarizer LvisCtxR and yellow RvisCtxL vs yellow LvisCtxR, respectively in male mice. Note that despite variations in amplitudes at the various lags, the general pattern is the same. On the other hand, in female mice, there is a significant correlation at lag zero, with uniformly low side lobes in a coin-flipping sequence. This may suggest that, the dominant interaction is at zero lag, but at successive lags there is randomness. This may be indicative of frequency-differencing of pseudo-random particles at S-peaks within the dorsal stream in the right visual cortex for paired comparisons of polarizer LvisCtxR vs yellow LvisCtxR, polarizer LvisCtxR vs polarizer RvisCtxL and yellow LvisCtxR vs yellow RvisCtxL. Note that despite variations in amplitudes at the various lags, the general pattern is the same.
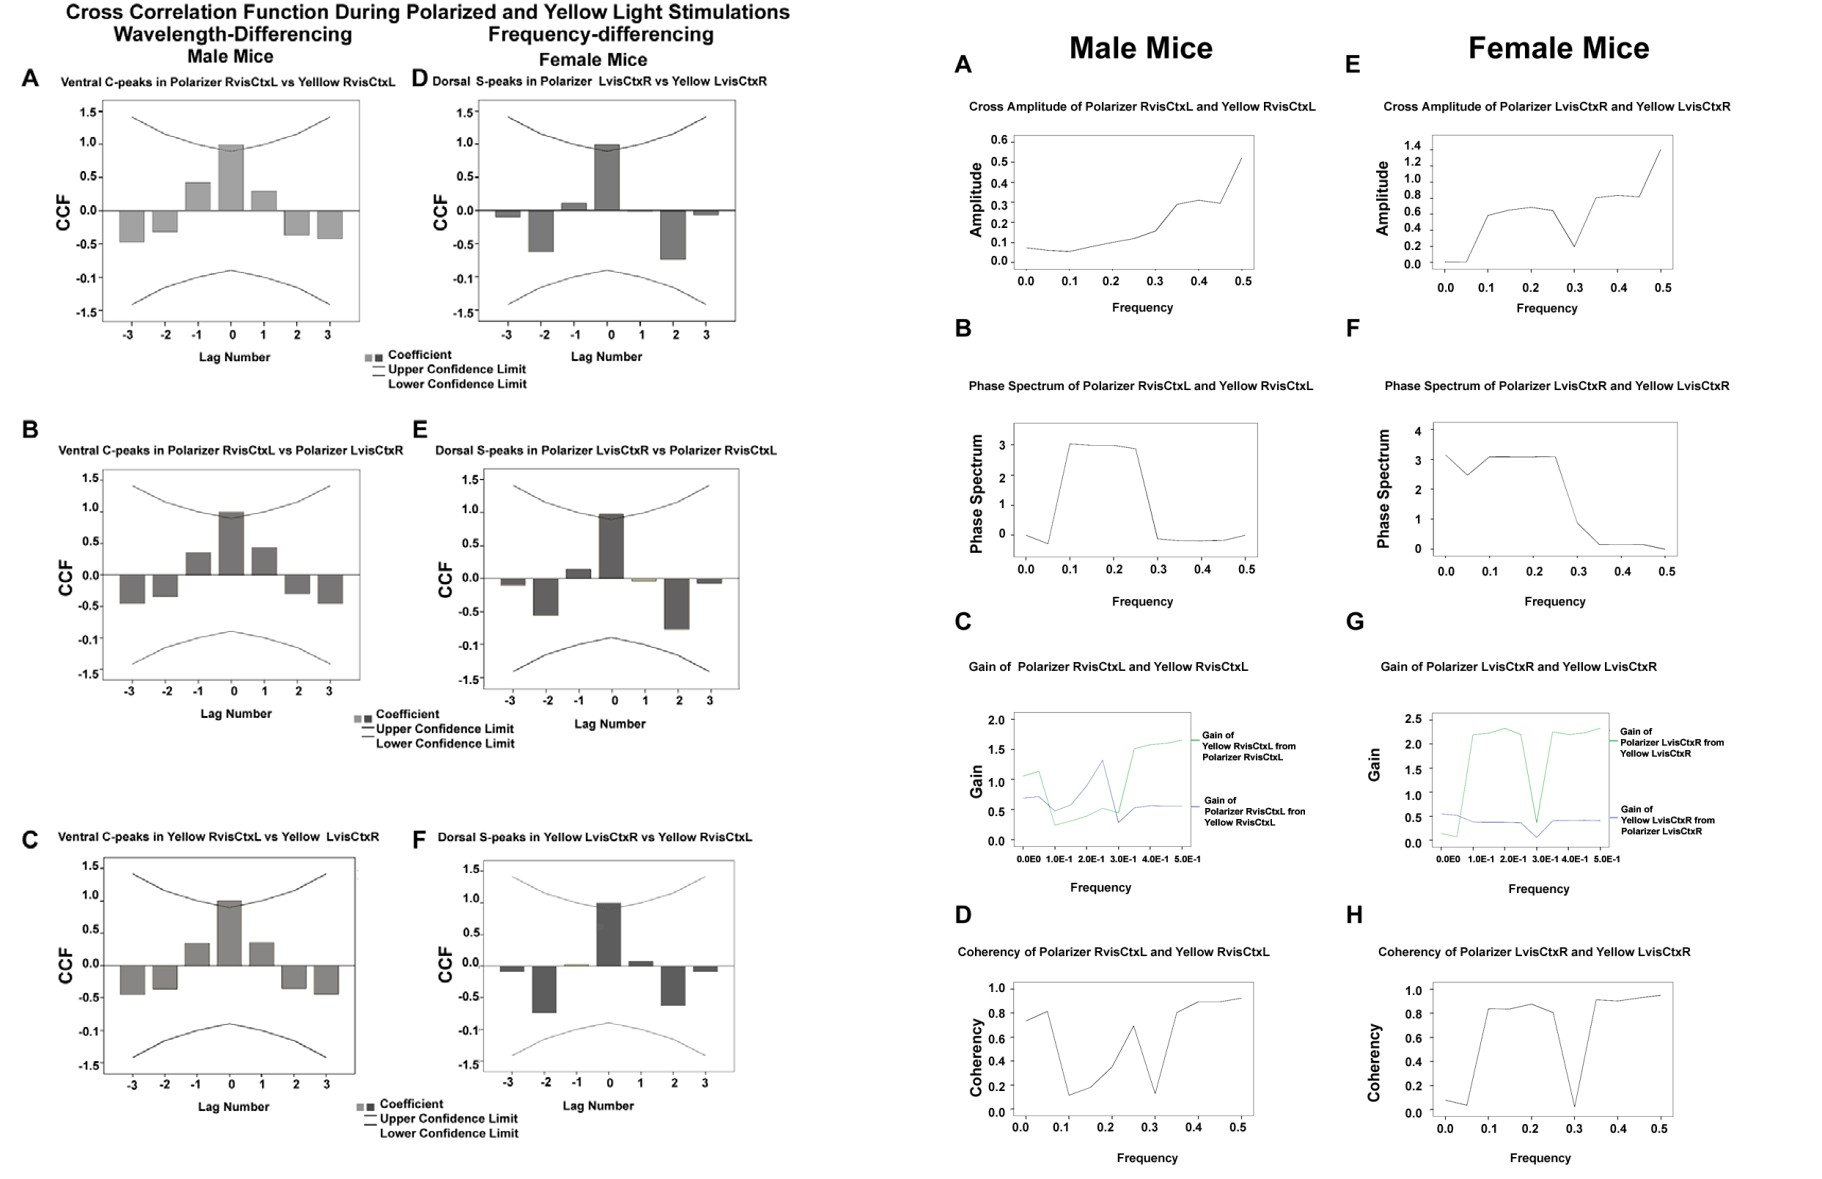
Figure 5(A-F): shows the plots of CCF by frequency in male mice demonstrating wavelength-differencing (Figure A-C), and in female mice showing frequency-differencing (Figure 5 D-F).
In male mice, we can distinguish the effects of yellow light at low frequency (0.0 to 0.25) interacting at orthogonal axis by destructive superposition with long wavelength component of the e-vector of the polarizer resulting in low amplitude, with phase shift, as e-vector leads yellow light, with high coherency at the frequency of 0.25, but low coherency at other lower frequency range. At higher frequencies (0.26 to 0.5), the e-vector short waves act alone inducing high amplitude effects, with no phase shifts, no gain and high coherency of effects (Figures 6A-H).
Figure 6(A-H): display the changes in cross amplitude, phase spectrum, gain and coherency in male (Figure 6A-D) and female mice (Figure 6 E-H).
On the other hand, in female mice, the random particles are differentiable into spectral bands as low frequency and high frequency with border divide at frequency of 0.3. The particles of the two spectral bands have equal numbers of right spin and left spin that oscillate at different frequencies at any given time, and interact by quantum superposition to induce effects resulting in high amplitude, in the low and high frequency ranges. The phase relationship of the two bands show a constant high phase shift. There is a high lead gain of the high frequency polarized photons over those of the low frequency spectral band within the yellow range. There is high coherency in the system in the low and high frequency ranges. In other words, the effects of the particles on brain metabolism both at low and high frequency ranges are intrinsically linked or synchronized.
The curves for linear and non-linear (logarithmic and exponent) regression line in male and female mice are shown in Figures 7A & B. The result of the multiple regression analysis shows that, in male mice, the linear relationship among the variables is not significant. On the other hand, in female mice, the linear and nonlinear relationship among the variables in the regression analysis is significant p < 0.0001, and the linear is the ‘best fit’, F (1,9) = 1043.4, MS = 0.004, p < 0.0001; R = 0.996, R2 = 0.992. The b coefficient suggest the units of photon energy in Yellow light that increase for a single unit increase in photon energy of Polarized light. The data shows that, one point increase in photon energy of Polarized light corresponds to 0.166 point increase in photon energy of Yellow light. Therefore, we could predict photon energy of Yellow light by computing: Yellow light photon energy = 0.002 + (0.166 * Polarized light energy).
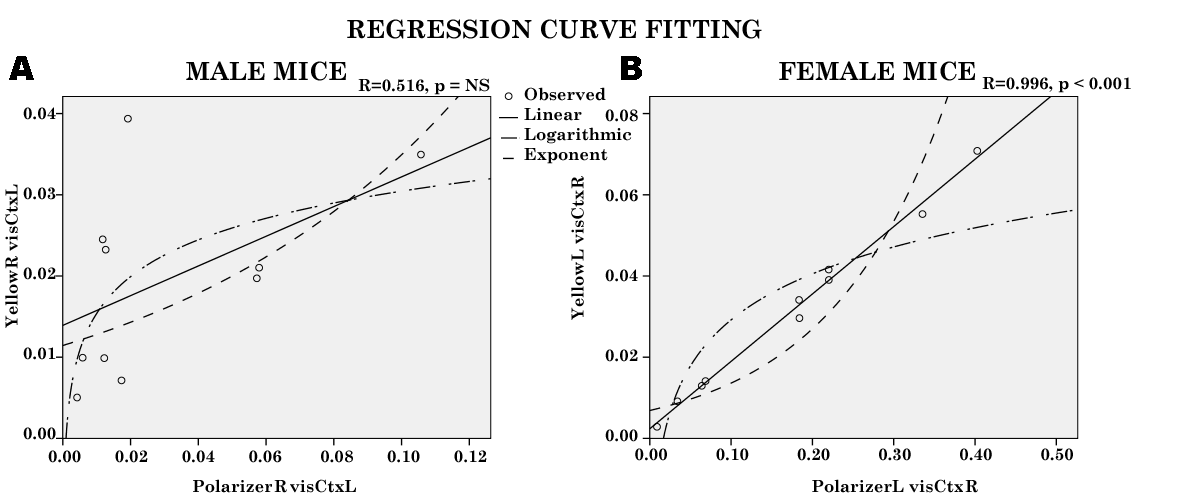
It is important that the b coefficient is positive; that is, higher energy of photons of Polarized light is associated with higher energy of Yellow light, in other words, both systems enhance each other. The coefficient of determination R2 is 0.992, which suggests that, about 99.2% of the variation in the photon energy of Yellow light is explained by the photon energy of Polarized light. The value of R2 is close to 1, and could indicate “entangled” processes in both systems. The t-test statistic T = 32.3, and p < 0.0001, suggests that we reject the null hypothesis. In other words, at the α = 0.05 level of significance there exists enough evidence to conclude that the slope of the time series regression line is not zero and, hence, photon energy in Polarized light is useful as a predictor of photon energy in Yellow light. In other words entanglement could be presumed between photons of Polarized light and those of Yellow light.
Discussion
The present study suggests that, there are major gender- related differences documented on PET images during the processing of polarized photon particles, which elicited greater tracer accumulation in the visual cortex in female than in male mice. On the other hand, yellow long-wave light evoked more tracer accumulation in the visual cortex in male but not female mice. Furthermore, male mice had higher scotopic sensitivity and luminance contrast than female mice. The statistical data analysis and correlation plots demonstrated that, in male mice, long-wavelength yellow light and e-vector components interacted by fundamental principles of classical destructive superposition which led to very low coherence or ‘decoherence’ except at only one frequency of 0.25. On the other hand, in female mice, the random particles are differentiable into spectral bands as low frequency and high frequency with border divide at frequency of 0.3. The particles of the two spectral bands have equal numbers of right spin and left spin that oscillate at different frequencies at any given time, and interact by quantum superposition to induce effects resulting in high coherence. In other words, male mice were sensitive to light wave effects, while female mice were sensitive to particle effects of light.
Let us presume that the reason for the gender differences observed in the present study comes from the treatment of light in quantum mechanics as having properties of waves and particles. In 1801, Thomas Young, performed the classical double-slit experiments a model of the quantum phenomenon, and could be applied to explain the present results. If light photons behave like waves passing through the double-slit, then where the waves interact crest-to-crest with no phase difference, they would strengthen each other and show a bright spot. On the other hand, where they met crest-to-trough with high phase difference, they would cancel each other and show a dark spot. The result is known as wave interference pattern. In the present study, lets us assume that light behaves like a wave in male mice. Since, yellow light has long wavelength, if the shorter wavelength of polarized light interfere crest-to-trough with yellow light travelling in the orthogonal axis at high phase difference, both would cancel each other, resulting in low cross-amplitude, high phase difference, with long wavelength yellow leading shorter wavelength polarizer light, and low coherence except at the frequency of 0.25, where they interact close to crest-to-crest.
Conversely, if we repeat the double-slit experiment, and light behaves as particles, and we send the light particles through the slits one by one, the interference pattern still shows up. The photon particles behaved as if they ‘know’ where they would go if they were in a wave. In other words, all possible paths of these particles can interfere with each other, even though only one of the possible paths actually happens, that is, all realities exist at once, until the final result occurs, in what is described as quantum superposition. In our experiment, in female mice, let us presume that the re- emitted photons are released as particles in the brain cells. In the lower frequency range, the effects of yellow light photons and polarized light photons interact to enhance each other as shown by high cross amplitude, with opposite spins that is at constant high phase difference, and at high gain as the effects of higher frequency polarized light photons lead those of lower frequency yellow light. There is high coherence between the effects of photons of yellow and polarized lights. The principles of classical superposition of the waves could be applied to explain the result in male mice, while the result in female mice could be explained using quantum superposition. Furthermore, we examined the mathematical evidence for an ‘entangled state’, using the multiple regression curve fitting of the relationship between the effects of polarized light and yellow light stimuli in male and female mice. In female mice, but not male, the coefficient of determination R2 is close to 1, and could indicate “entangled” processes in both polarized and light systems.
As intriguing as the aforementioned preposition sounds, there are fundamental questions to be resolved. The application of quantum mechanics would imply that entanglement occurs in the brain. The entangled photons would exist in a fragile state, carefully shielded from any noise in the surrounding brain environment. The question that arises is, in what environment within the visual cortex does the presumed entangled state occur? The visual process comprises of receptoral and neural stages. The photoreceptors and other retinal cells would convey photonic signals due to effects of exogenous visible electromagnetic photons. However, photon signals can also arise from within the neural processing apparatus, for example, direct electrical stimulation to neurons of the visual system would cause subjective perception of point of light called phosphenes [60]. The latter suggests that, re-emitted photons could arise at the neural stage in the primary and secondary visual cortex during visual perception. We propose that the CO blobs identified as areas of high oxidative activity, are microenvironments within the primary and secondary visual cortex that could possibly protect from brain environmental ‘decoherence’, and provide for ‘coherence’ for sufficiently long periods of time. It has been suggested that CO blobs activity is coupled with spike activity in neurons [42].
These re-emitted photons on receptoral stimulation arise from within mitochondrial CO-rich blobs in supragranular layers of V1 and stripes throughout the entire V2. The CO- rich blobs are the functional unit for phosphene induction and also could be elicited in V3, v4, V5/ MT+, intraparietal sulcus regions [60]. This suggests that, the visual cortex provides widespread units of microenvironment that protects from brain environmental ‘decoherence’. To our knowledge, there has been no report on gender-differences in the structure and histochemistry of CO blobs in the visual cortex of animals and humans.
Our result suggests that, there may be quantum coherence or entanglement in the processing of polarized and yellow light stimuli in the visual system in female mice, similar to the non-trivial quantum processes observed in photosynthesis in plants and bacteria [61]. These processes include quantum tunnelling of the photons. Quantum tunnelling is an effect causing particles to overcome an energy barrier which is higher than their state of energy. This could be likened to a car passing through a wall without damaging itself or the wall. Our result from the multiple regression analysis suggests that, the photons of yellow and polarized light interact to enhance each other. We presume that, in the visual cortex, the high metabolic activity in the CO blobs may indicate the presence of multiple ‘photon tunnelling corridors’ of ultra-fast pathways for charge separation similar to that observed in photosynthesis [62]. Under conditions of broad-spectrum excitation, there is dipolar coupling between localized excited states in different groups of CO blobs, which not only delocalized the excited state but also generates ‘coherences’ that give rise to oscillatory dynamics in brain metabolic activity that could be seen on fPET images during polarized light stimulation in female mice but not male mice. Similar observations have been made in the photosynthetic process [1, 63].
The explanation of the gender-related difference could also imply that in the male mice, the transmission medium of CO blobs through which the wave propagates is homogenous or nearly the same, while in female mice the wave travels differently. These presumed effects within the CO blobs could be modelled similar to the rectangular potential barrier [64]. The Schrödinger equation can be adapted to these effects presuming that, in optics, medium A is similar to a vacuum with a travelling wave solution, while medium B is similar to a glass with exponential solutions. The presumed effects in the male medium A, could be the inverse in the female medium B. Moreover, we demonstrated that, blue/yellow opponent pairs could be modelled by exponential curves in men, while in women by logarithmic curves, which may reflect the wave/ particle divide based on the inverse relationship between wavelength and frequency [46, 41].
The correlation of the effects of polarized light and yellow within the same color space creates a three dimensional space along orthogonal coordinates of x-yellow, y-blue and z-polarization in one direction and luminance in the other [46, 41]. On the one hand, in male mice, the z-axis is tilted towards the direction for luminance contrast or grey scale and hence the higher scotopic sensitivity. On the other hand, in female mice, the z-axis is directed predominantly towards polarization sensitivity. It therefore follows that processes of wave superposition and quantum superposition would have effects in all three-dimensions of the color space. Incidence of e-vector at Brewster’s angle would elicit 100% degree of polarization which would result in color opponency along the blue/yellow axis of the color space [46, 41].
Hence the blue-yellow Haidinger’s brushes are a manifestation of the color opponent response due to changes along the z-axis of e-vector polarization in the 3D-color space. In human studies, the differences have been found in the perception of color between males and females in their ability to accurately identify color terms and [65] in size of color vocabulary used [66]. Given that humans can differentiate as many as 10 million colors as has been estimated, it therefore follows that the complex combinatorial calculations using several qubits (unit of quantum computing) within the color space, would be required. The findings suggest that female mice but not male mice implement a quantum algorithm for polarization in color space calculations, and may explain the gender advantage of females over males.
Conclusion
The present study is presumptive at best, that the principles of classical physics and quantum mechanics could be applied to brain metabolism during processing of visual stimuli. There is need for further research to associate the findings in male mice with classical superposition of waves, and in female mice with quantum superposition of photons in entangled state. We hope that this preliminary study will stimulate interest in research on applications of quantum mechanics in processing of polarized light and color stimulations of the visual cortex in humans and animals. The present animal model could be used in the study of brain degenerative diseases. Simulations in animal models could be adapted for use in design of artificial intelligence (AI) quantum computers, with a wide range of applications. Further, studies are required to harmonize these findings and to explore practical clinical applications in brain laterality disorders such as dyslexia, autism spectrum and attention deficit hyperactive disorders (ADHD). In other words, could laterality disorders result when information processing switches from left to right visual cortex or vice versa in a male or female subject as was demonstrated for linguistic processing in dyslexia [67]. The gender-related differences identified in the present study also support the notion of gender complementarity in normal and pathological brain conditions.
References
-
Engel GS, Calhoun TR, Read EL, Ahn TK, Mančal T, et al. (2007) Evidence for wavelike energy transfer through quantum coherence in photosynthetic systems. Nature 446: 782-786.
-
Lee H, Cheng YC, Fleming GR (2007) Coherence Dynamics in Photosynthesis: Protein Protection of Excitonic Coherence. Science 316(5830): 1462-1465.
-
Arndt M, Juffmann T, Vedral V (2009) Quantum physics meets biology. HFSP J 3(6): 386-400.
-
Collini E, Wong CY, Wilk KE, Curmi PMG, Brumer P, et al. ( 2010) Coherently wired light-harvesting in photosynthetic marine algae at ambient temperature. Nature 463(7281): 644-647.
-
Panitchayangkoon G, Hayes D, Fransted KA, Caram JR, Harel E, et al., (2010) Long-lived quantum coherence in photosynthetic complexes at physiological temperature. Proc Natl Acad Sci 107(29): 12766-12770.
-
Sarovar M, Ishizaki A, Fleming GR, Whaley KB (2010) Quantum entanglement in photosynthetic light- harvesting complexes. Nat Phys 6(6): 462-467.
-
Chenu A, Scholes GD (2015) Coherence in Energy Transfer and Photosynthesis. Annu Rev Phys Chem 66(1): 69-96.
-
Brookes JC (2017) Quantum effects in biology: golden rule in enzymes, olfaction, photosynthesis and magnetodetection. Proc R Soc A Math Phys Eng Sci 473(2201): 20160822.
-
(2001) The quantum brain: the search for freedom and the next generation of man. Choice Rev Online 39(4): 39- 2186.
-
Jedlička P (2005) Neuroethics, reductionism and dualism. Trends Cogn Sci 9(4): 172.
-
Jedlicka P (2017) Revisiting the Quantum Brain Hypothesis: Toward Quantum (Neuro) biology. Front Mol Neurosci 10: 366.
-
Bliss TVP, Lomo T (1973) Long-lasting potentiation of synaptic transmission in the dentate area of the anaesthetized rabbit following stimulation of the perforant path. J Physiol 232(2): 331-356.
-
Ito M (1989) Long-Term Depression. Annu Rev Neurosci 12(1): 85-102.
-
Wang M, Lam TT, Zhang S, Tso MOM, Naash MI (1994) Mutations In Rhodopsin Increase The Susceptibility Of Retina To Light Damage. In Investigative Ophthalmology & Visual Science 35(4): 1517.
-
Mender D (2014) A Vast Yet Limited Gift: Loewenstein, W. Physics in Mind: A Quantum View of the Brain (New York, Basic Books, 2013, 325 pp.). Neuro Quantology 12(1).
-
Huelga SF, Plenio MB (2013) Vibrations, quanta and biology. Contemp Phys 54(4): 181-207.
-
Ball P (2011) Physics of life: The dawn of quantum biology. Nature 474(7351): 272-274.
-
Aguilar LMA, Robledo-Sanchez C, Carrasco MLA, Otero MMM (2012) The principle of superposition for waves: The amplitude and phase modulation phenomena. Appl Math Inf Sci 6(2): 307-315.
-
Tan KC, Jeong H (2018) Entanglement as the Symmetric Portion of Correlated Coherence. Phys Rev Lett 121(22): 220401.
-
Marshall J, Cronin TW (2011) Polarisation vision. Curr Biol 21(3): 101-105.
-
McGregor J, Temple S, Horváth G (2014) Human Polarization Sensitivity. Polarized Light and Polarization Vision in Animal Sciences. Springer Berlin Heidelberg, pp: 303-315.
-
Jundi B, Homberg U (2012) Receptive field properties and intensity-response functions of polarization- sensitive neurons of the optic tubercle in gregarious and solitarious locusts. J Neurophysiol 108(6): 1695-1710.
-
Temple SE, Scott-Samuel NE, Miles C, Graham L, Miller J, et al. (2015) Perceiving polarization with the naked eye: characterization of human polarization sensitivity. Proc R Soc B Biol Sci 282(1811): 20150338.
-
Coughlin DJ, Hawryshyn CE (1995) A cellular basis for polarized-light vision in rainbow trout. J Comp Physiol A 176(2): 261-272.
-
Haidinger W (1844) Ueber das directe Erkennen des polarisirten Lichts und der Lage der Polarisationsebene. Ann der Phys und Chemie 139(9): 29-39.
-
Grünberg J, Hofer IN, Honer M, Zimmermann K, Knogler K, et al. (2005) In vivo evaluation of 177Lu-and 67/64Cu- labeled recombinant fragments of antibody chCE7 for radioimmunotherapy and PET imaging of L1-CAM- positive tumors. Clin Cancer Res 11(14): 5112-5120.
-
Von Helmholtz H (1867) Handbuch der physiologischen Optik: mit 213 in den Text eingedruckten Holzschnitten und 11 Tafeln 9.
-
Naylor EJ, Stanworth A (1955) The measurement and clinical significance of the Haidinger effect. Trans Opthal Soc U K 75: 67-79.
-
Zhevandrov ND (1995) Polarisation physiological optics. Physics-Uspekhi 38(10): 1147-1166.
-
Ungerleider LG, Haxby JV (1994) ‘What’ and ‘where’ in the human brain. Curr Opin Neurobiol 4(2): 157-165.
-
Ungerleider LG (1982) Two cortical visual systems. Anal Vis Behav pp: 549-586.
-
McKeefry D, Zeki S (1997) The position and topography of the human colour centre as revealed by functional magnetic resonance imaging. Brain 120(12): 2229-2242.
-
Perry CJ, Fallah M (2014) Feature integration and object representations along the dorsal stream visual hierarchy. Front Comput Neurosci 8: 84.
-
Gray H, Clemente CD (1985) Grey’s Anatomy of the Human Body, 30th American edn. Muscles fasciae leg. Philadelphia Lea Febiger, pp: 574-575.
-
Takechi H, Onoe H, Shizuno H, Yoshikawa E, Sadato N, et al. (1997) Mapping of cortical areas involved in color vision in non-human primates. Neurosci Lett 230(1): 17- 20.
-
Bartels A, Zeki S (2000) The architecture of the colour centre in the human visual brain: new results and a review. Eur J Neurosci 12(1): 172-193.
-
Njemanze PC, Kranz M, Amend M, Hauser J, Wehrl H, et al. (2017) Gender differences in cerebral metabolism for color processing in mice: A PET/MRI Study. PLoS One 12(7): 0179919.
-
Njemanze P, Kranz M, Brust P (2019) Fourier Analysis of Cerebral Metabolism of Glucose: Gender Differences in Mechanisms of Color Processing in the Ventral and Dorsal Streams in Mice. Forecasting 1(1): 135-156.
-
Njemanze P (2005) Cerebral lateralization and general intelligence: Gender differences in a transcranial Doppler study. Brain Lang 92(3): 234-239.
-
Njemanze PC (2007) Cerebral lateralisation for facial processing: Gender-related cognitive styles determined using Fourier analysis of mean cerebral blood flow velocity in the middle cerebral arteries. Laterality Asymmetries Body, Brain Cogn 12(1): 31-49.
-
Njemanze PC (2011) Gender-related differences in physiologic color space: a functional transcranial Doppler (f TCD) study. Exp Transl Stroke Med 3(1): 1-8.
-
Wong-Riley M (1979) Changes in the visual system of monocularly sutured or enucleated cats demonstrable with cytochrome oxidase histochemistry. Brain Res 171(1): 11-28.
-
Livingstone MS, Hubel DH (1984) Anatomy and physiology of a color system in the primate visual cortex. J Neurosci 4(1): 309-356.
-
Livingstone MS, Hubel DH (1982) Thalamic inputs to cytochrome oxidase-rich regions in monkey visual cortex. Proc Natl Acad Sci U S A 79(19): 6098-6101.
-
Levitt MA, Cook LAS, Simon BC, Williams V (1995) Biochemical Markers of Cerebral Injury in Patients with Minor Head Trauma and Ethanol Intoxication. Acad Emerg Med 2(8): 675-680.
-
Njemanze PC (2010) Gender-related asymmetric brain vasomotor response to color stimulation: a functional transcranial Doppler spectroscopy study. Exp Transl Stroke Med 2(1): 21.
-
A Vision of the Brain. By S. Zeki. (Pp. 366; illustrated; £18.95.) (1993) Blackwell Scientific Publications: Oxford, Psychol Med 23(4): 1057.
-
Bandi P, Zsoter N, Koncz P, Babos M, Hobor S, et al. (2012) Automated material map generation from MRI scout pairs for preclinical PET attenuation correction. 2012 Annual International Conference of the IEEE Engineering in Medicine and Biology Society IEEE.
-
Ghanavati S, Yu LX, Lerch JP, Sled JG (2014) A perfusion procedure for imaging of the mouse cerebral vasculature by X-ray micro-CT. J Neurosci Methods 221: 70-77.
-
Thie JA (2004) Understanding the standardized uptake value, its methods, and implications for usage. J Nucl Med 45(9): 1431-1434.
-
Watts DG, Jenkins G (1968) Spectral analysis and its applications. San Fr.
-
Kwiatkowski D, Phillips PCB, Schmidt P, Shin Y (1992) Testing the null hypothesis of stationarity against the alternative of a unit root. J Econom 54(1-3): 159-178.
-
Newman DA (2008) Book Review: Newman: Kenny DA, Kashy DA, Cook WL (2006) Dyadic Data Analysis. New York: Guilford. Organ Res Methods 13(3): 603-607.
-
Bloomfield P (2000) Fourier analysis of Time Series. Wiley Series in Probability and Statistics. John Wiley & Sons Inc.
-
Poularikas D (2018) Handbook of formulas and tables for signal processing. CRC press.
-
Harris FJ (1978) On the use of windows for harmonic analysis with the discrete Fourier transform. Proc IEEE 66(1): 51-83.
-
Brockwell PJ, Davis RA (1991) Multivariate Time Series. Springer Series in Statistics. Springer New York, pp: 401- 462.
-
Tahmasebi P, Hezarkhani A, Sahimi M (2012) Multiple- point geostatistical modeling based on the cross- correlation functions. Comput Geosci 16(3): 779-797.
-
Njemanze PC, Gomez CR, Horenstein S (1992) Cerebral Lateralization and Color Perception: A Transcranial Doppler Study. Cortex 28(1): 69-75.
-
Bókkon I, Vimal RLP (2013) Theoretical Implications on Visual (Color) Representation and Cytochrome Oxidase Blobs. Act Nerv Super 55(1-2): 15-37.
-
van Amerongen H, van Grondelle R, Valkunas L (2000) Photosynthetic Excitons. World Scientific.
-
van Brederode ME, van Mourik F, van Stokkum IHM, Jones MR, van Grondelle R (1999) Multiple pathways for ultrafast transduction of light energy in the photosynthetic reaction center of Rhodobacter sphaeroides. Proc Natl Acad Sci 96(5): 2054-2059.
-
Arnett DC, Moser CC, Dutton PL, Scherer NF (1999) The First Events in Photosynthesis: Electronic Coupling and Energy Transfer Dynamics in the Photosynthetic Reaction Center from Rhodobactersphaeroides. J Phys Chem B 103(11): 2014-2032.
-
Griffiths DJ (2005) Introduction to quantum mechanics. 2nd Pearson, Chapter 2. Time-independent schrodinger Equ pp: 90-91.
-
Yang Y (2000) Sex and Skill Differences in Translation of English Color Words by Chinese Students. Percept Mot Skills 91(3): 1181-1192.
-
Lyons (1995) Colour in language. Colour Art Sci 194223.
-
Njemanze PC, Beck OJ, Gomez CR, Horenstein S (1991) Fourier analysis of the cerebrovascular system. Stroke 22(6): 721-726.
- Contribution of 18FDG PET in Atypical HORTON Disease
- Living Conditions, Healthy Practice and State of Households of a Town Rural in Colombia
- Background to the Health and Safety Regulation at Work in Colombia
- Risk Factors Psychology Workers Sena (Center for the Petrochemical Industry) Regional Bolívar, Colombia
- Diffuse Intense Pleural FDG Uptake with Smooth Thickening: A MARKER of Tuberculosis in Isolated Pleural Effusion
- Hypermetabolic Splenomegaly with Infarct in FDG PET/CT: A Clue to Scrub Typhus in PUO