Plant Diversity and Carbon Storage Potential Across Different Land Use Types in Infrastructure Development Landscapes in Cameroon: Implications for no Net Loss of Biodiversity
This study investigated biodiversity change and carbon storage potential of different land use types in infrastructure development landscapes in Cameroon, focusing on the Dibombe Hydropower Project area in the Littoral Region of the Country. Line transects were used to collect flora inventory data in seven different land use types. We assessed flora diversity, aboveground biomass (AGB), and the presence of threatened species across various land use types, including riparian forests, cocoa plantations, fallow land, and croplands. Our findings reveal rich biodiversity across the study area, with forests harbouring the highest species diversity (159 species, Simpson Diversity Index of 0.92). Cocoa plantations also showed significant diversity (136 species, Simpson Index of 0.89), suggesting their potential role in restoration of degraded landscapes and biodiversity conservation. Riparian forests haboured the highest AGB of 100 tons/ha, highlighting their importance for carbon sequestration. The study identified two endangered species, Guibourtia tessmannii and Microberlinia bisulcata and 23 vulnerable species, underscoring the conservation value of the ecosystem. The high presence of cocoa agroforest with rich biodiversity potential demonstrates their potential for integrating biodiversity conservation. Our results emphasize the significance of a landscape-level approach to biodiversity offsetting stating that the combination of biodiversity rich land use types with high carbon storage land use types can serve as a model in offsetting biodiversity loss within large infrastructure development landscapes under minimal construction impacts. The study provides valuable insights for policymakers and project developers in designing effective NNL approaches including accounting for carbon stock in conservation aims and promotion the use of agroforestry systems in restoration of degraded landscapes and biodiversity conservation.
Nforbelie LN¹*, Sonke B² and Fongod AG³
Abbreviations
AGB: Aboveground Biomass; E: Environmental Stress Index; GIS: Geographic Information System; GPS: Global Thesis Positioning System; HPP: Hydropower Plant; IUCN: International Union for Conservation of Nature; IVI: Important Value Index; NNL: No Net Loss; RS: Riparian Sampling; SID: Simpson Index of Diversity.
Introduction
Biodiversity loss due to large infrastructure development projects has been a major concern to humanity. Several attempts are being made to limit this loss and the global push for sustainable development has brought the concept of “No Net Loss” (NNL) of biodiversity to the forefront of environmental policy and practice, particularly in infrastructure development projects. No Net Loss aims to balance unavoidable biodiversity losses in one area with equivalent gains elsewhere, ensuring that overall ecological integrity is maintained or improved [1]. This approach has gained traction as a potential solution to the ongoing biodiversity crisis, exacerbated by habitat loss, fragmentation, and degradation from human activities.
In tropical regions, with disproportionate share of the world’s biodiversity, implementing effective NNL strategies remains a major call for concern. These areas are characterized by high species richness, endemism, threatened species and complex ecological interactions, making it difficult to accurately assess and offset biodiversity impact. Moreover, the rapid pace of infrastructure development in many tropical countries, driven by economic growth and poverty alleviation goals, often conflicts with conservation objectives. However, implementing NNL policies for biodiversity in infrastructure development projects, particularly in tropical regions, faces significant challenges due to high biodiversity, endemism, and ecosystem service importance [1]. Indeed, a global review of NNL outcomes revealed that only about one-third of policies and offsets achieved their goals, primarily in wetland ecosystems [2]. Biodiversity offsetting is a crucial strategy for mitigating the environmental impacts of infrastructure development projects, particularly in biodiversity-rich regions like Cameroon’s tropical rainforests [3]. However, achieving true NNL of biodiversity through offsetting remains challenging. Studies indicate that offset sites often have a lower potential for ecological gains compared to certain losses at impact sites, as many selected areas are already semi-natural habitats. To ensure effective biodiversity offsetting, a landscape-level approach is necessary, considering indirect and cumulative impacts [3]. Additionally, more detailed information on the ecological quality of offset sites and multiple comparisons of ecosystem states are needed to better evaluate the equivalence between gains and losses. However, offset sites are often selected through rapid appraisal jeopardizing the quality of information needed to inform policy and practice regarding effective offsetting. Meanwhile, detailed diagnosis of vegetation cover and biodiversity on large infrastructure sites could provide potential options for planning and implementing biodiversity offsetting strategies on a landscape scale. Hence, land use types that minimize biodiversity loss within infrastructure development landscapes could be useful in informing policy and practice towards achieving NNL biodiversity while land use types with high carbon storage potential are vital for improving the ecological health of the landscape through climate regulation. This implies that land use types with high plant diversity and a consequential carbon storage potential serve as a model for offsetting biodiversity loss on large infrastructure development sites using a landscape approach under conditions of minimized damage during infrastructure development. The aim of this study was to assess plant diversity changes and variation in carbon storage across different land use types using the Dibombe Hydropower Project in Cameroon as a large infrastructure development project model. By examining flora species diversity, aboveground biomass, and the presence of threatened species across various land use types, we seek to provide insights that can inform policy and practice for effective No Net Loss strategies in this tropical forest ecosystem.
Materials and Methods
Study Site
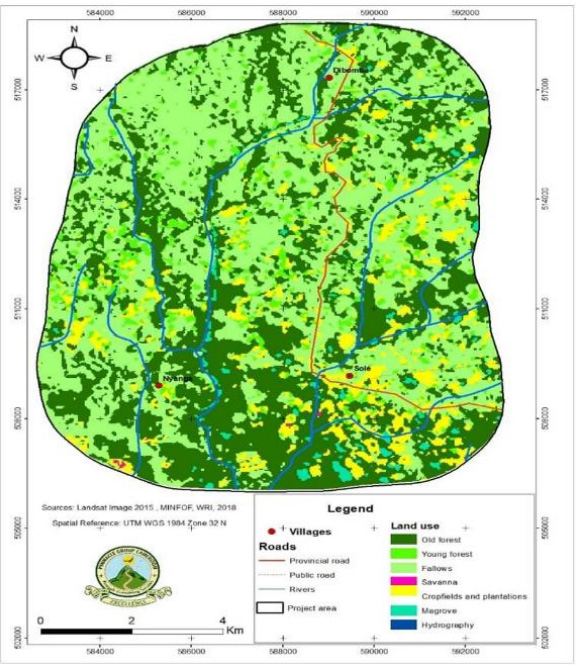
The study was conducted within the proposed Dibombe Hydropower Project (HPP) area in the Littoral Region of Cameroon Figure 1. The proposed Dibombe River catchment hydropower plant is a Run-of-River Hydropower Plant in the Littoral Region-Cameroon. It covers the Loum and Djombe-Penja sub-divisions of the Moungo division and the Yabassi sub-division of the Nkam division. The closest communities to the study site are Mabombe, Lamba and Sole to the left bank of the Dibombe river where the HPP infrastructure will be established while Njanga, Boneko and Penja are communities to the right bank of the Dibome River within the area affected by the 11km long transmission line corridor (Figure 1). The project area encompasses diverse land use types, including riparian forests, cocoa plantations, fallow land, and croplands, providing a representative sample of the region’s land use systems. The vegetation around the study area characteristically falls within the lowland evergreen Atlantic or coastal rainforests zone of the Congo Basin. The forest type belongs to the Lower Guinea region of endemism [4] and is abundant in leguminous trees (Fabaceae). Agriculture is the main source of subsistence for the local population. Palms, cocoa, coffee, white paper and banana plantation are the major agricultural activities practiced within the study site. The study area, located within the Littoral Region of Cameroon, experiences a hot and humid climate with high and constant temperatures averaging 27.4°C annually. Rainfall is intense, peaking at 700 mm in August and averaging 3664.2 mm from 1998 to 2007. The region’s geology includes basalts, syntectonic granites, porphyroid granites, and gneisses, contributing to its high tectonic instability. Soils in the area are primarily loam, sandy, and lateritic. Hydrologically, the Douala Basin is significant due to its sandy formations which serve as primary aquifers, recharged by local precipitation and surface water infiltration. The Wouri hydrographic basin features a dendritic drainage pattern, characterized by falls, rapids, and pools, particularly in the Dibombe River.
![Figure 1: The proposed Dibombe River catchment hydropower plant is a Run-of-River Hydropower Plant in the Littoral Region-Cameroon. It covers the Loum and Djombe-Penja sub-divisions of the Moungo division and the Yabassi sub-division of the Nkam division. The closest communities to the study site are Mabombe, Lamba and Sole to the left bank of the Dibombe river where the HPP infrastructure will be established while Njanga, Boneko and Penja are communities to the right bank of the Dibome River within the area affected by the 11km long transmission line corridor (Figure 1). The project area encompasses diverse land use types, including riparian forests, cocoa plantations, fallow land, and croplands, providing a representative sample of the region’s land use systems. The vegetation around the study area characteristically falls within the lowland evergreen Atlantic or coastal rainforests zone of the Congo Basin. The forest type belongs to the Lower Guinea region of endemism [4] and is abundant in leguminous trees (Fabaceae). Agriculture is the main source of subsistence for the local population. Palms, cocoa, coffee, white paper and banana plantation are the major agricultural activities practiced within the study site. The study area, located within the Littoral Region of Cameroon, experiences a hot and humid climate with high and constant temperatures averaging 27.4°C annually. Rainfall is intense, peaking at 700 mm in August and averaging 3664.2 mm from 1998 to 2007. The region’s geology includes basalts, syntectonic granites, porphyroid granites, and gneisses, contributing to its high tectonic instability. Soils in the area are primarily loam, sandy, and lateritic. Hydrologically, the Douala Basin is significant due to its sandy formations which serve as primary aquifers, recharged by local precipitation and surface water infiltration. The Wouri hydrographic basin features a dendritic drainage pattern, characterized by falls, rapids, and pools, particularly in the Dibombe River.](/fulltextimages/13869/fig_1.jpeg)
Data Collection
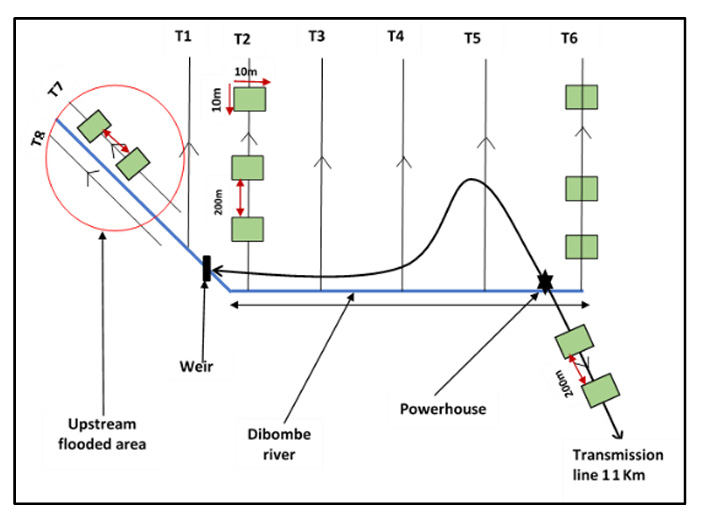
Botanical surveys were carried out across different land use types within the project area using the line transect sampling design inspired by several authors [5, 6]. Line transects have been proven to be robust and more accurate plant sampling techniques in both homogenous and heterogenous landscapes as they provide higher chances of fully capturing species diversity and land use change at the same time compared to plots. Ngansop, et al. [6, 7] employed this sampling technique based on its accuracy and reliability to assess natural regeneration of non-timber forest products across different land use types in southeastern Cameroon. A base line of about 6 km long and 20 m wide was cut that runs from T1 to T6 and is oriented along the geographic north. The equidistance between each transect was 1 km and all transects were numbered and named from T1-T2- T3-T4-T5-T6. Transects T1-T2-T3-T4-T5-T6 were established around the proposed HPP project footprint area while transects T7-T8-T9 were established upstream around the potential reservoir area. The start and end of each transect was numbered and named. Along each transect, small quadrats of 5 m × 5 m were established to collect data for understorey plants. The transect lines RS1, RS2 and RS3 were aligned along the left bank of the Dibombe river along the impoundment area. These transect total about 3km and were linked to each other. A total of nine transects were established with approximately 1650 ha of the proposed project-affected area were sampled (Figure 2). Along each transect, all trees with a diameter ≥5 cm were measured at 1.3 m breast height. For trees with early ramification (e.g. Cocoa plant), their diameter were measured at 30 cm above the ground. Palms and Raphia trees were not measured for their diameter, rather their total height were estimated. The later steps were followed by taxonomic identification of the species. After these, the land use type was determined based on GIS imagery and confirmed by ground truthing.
Data Analysis
Assessment of Species Diversity: Species diversity was evaluated using the number of species, number of individuals and diversity indexes Simpson index of diversity (SID) and was expressed per transect and per land use type. The number of species was simply represented as the count of each species per sampling unit (transect or land use type). Species abundance was determined as the number of individuals for a given species. The Simpson diversity index combines species richness and evenness (relative abundance of the different species) across a the transect or land use type considered. The important value index (IVI) was calculated for key tree species to assess their ecological dominance. Assessing conservation status: The conservation status of each species was determined based on the IUCN redlist for plant species. Complementary endangered status was obtained to conform species vulnerability at the national level using Onana [8]. Additionally, the distribution of threatened species was analyzed by computing their relative abundances to determine conservation priorities within the project area.
Computation of Aboveground Biomass (AGB): Aboveground Biomass (AGB) was computed independently for woody plants and non-woody plants (e.g. Palms and Raphia). For woody plants, equation 5 of Chave, et al. [9] was used to compute the AGB of the trees. This equation uses the diameter of the trees, their wood density and the environmental stress index (E). The E of Chave, et al. [9] captures variability of the environment and represents acts as a proxy for tree total height. The later index was calculated from precipitation and temperature data of the locality. For this, the GPS coordinate of each transect was used to retrieve the precipitation and temperature data used to calculate the stress index. The wood density for each species was obtained from the Dryad global wood density database [10]. For species without wood density values in the Dryad global wood density database, a mean wood density value of the transect was attributed to them. For Palms and Raphia, the equation 8 of Migolet, et al. [11] developed for Palms in the Congo Basin was used. This formular uses the total height of the palm tree as shown thus: AGB=a+b log(HT) × where AGB is aboveground biomass in kg (in ton when divided by 1000), a and b are the coefficients of the intercept and slope of the model and HT is the total height of the palm or Raphia plant.
Results
Land Use Types
Seven land use types were identified across the study area along the Debombe river area from GIS imagery and confirmed by walking the nine transects (Figure 3). In order of importance (number of transects and surface area covered) the land use types include cocoa agroforests (eight transects, 16-ha), forest (six transects, 12-ha), fallow and palm plantation (four transects, 8-ha each), cropland and riparian forest (three transects, 6-ha each) and Rubber plantation (1 transect, 2-ha).
For the HPP infrastructure site, six land types were identified with the absence of the riparian forest. The forest and cocoa agroforests were the most important land use types around the infrastructure site covering 6 transects and 12-ha each. Palm plantations spread along four transects (8- ha), the fallow and cropland each occupied 4-ha along two transects while rubber plantation covered 2-ha along one transect. Four land use types were identified around the Reservoir area including riparian forest (6-ha), fallow and cocoa agroforests (4-ha each) and Cropland (2-ha). For the transmission line, six major land use types were identified including cocoa agroforests, palm plantation, cropland, fallow, riparian forest and old forest. Cocoa agroforests which represented the most important land use type along the transmission line is a type of agriculture systems wherein the cacao plant (Theobroma cacao) is the predominant cash crop. The plant is grown at a regular distance of about 4-5 m interval and can grow 5-10 m high. Few other trees species are purposefully allowed in the cacao farms for shade, fruits or as non-timber forest products (Medicine, spice, xxx). Few of these trees include Irvingia gabonensis (bush mango), Ricinodendron heudelotii (spice), Cola lateritia (monkey kola), Garcinia kola (bitter kola). Other food crops also intercropped in the Cocoa agroforests include Musa spp (banana and plantain), Xanthosoma sagittifolium (Cocoyam), Manihot esculenta (cassava).
Like the Cocoa agroforests, oil palm plantations equally cover an important portion along the transmission like. The palm plant (Elaeis guineensis) is planted as a cash crop at an interval of 7-9 m. Unlike the cocoa agroforests, rarely are other tree species found among mature palm plantations. Singleton timber trees in the palm plantation were recorded, for instance, Pterocarpus soyauxii (red padouk), Milicia excelsa (iroko). The land use type identified as cropland characterizes areas where all other natural occurring vegetation was removed and replaced by active agriculture. The type of farming in this land use type is mainly for subsistence and food crops are the main plants. Some crops identified were Zea mays (corn), Arachis hypogaea (groundnut), banana and plantain. However, some trees spotted are Albizia zygia, Alchornea cordifolia and Alstonia boonei.
The land use type identified as fallow defines those areas where the original forests were cut for the purpose of agriculture, cultivated for a certain period and later abandoned. Unlike the later three land use types, fallows were densely covered with mostly liana species and other plants of secondary growth (e.g. Anthocleista Schweinfurthii). Relics of the previously cultivated plants were identified in the area such as palms, cocoa, cocoyam and cassava. Species such as Adenia spp, Hypselodelphys danckelmaniana and Haumania spp are the major climbers (lianas) recorded.
Plant Species Diversity Across Different Land Use Types
Overall, 328 species were counted across the seven different land use types (Annex 1). The overall Simpson index of diversity of 0.87 was determined Table 1. Among the 205 genera and 52 families recorded and Fabaceae with 42 species were the most abundant family while Cola with 11 species represents the most genera. Plant species diversity assessment within the entire project affected area revealed a rich diversity of plant species across different land use types. Species diversity measured using the Simpson Diversity Index, showed high values across all land use types, indicating well-balanced ecosystems Table 1.
| Land Use Types | Number of Species (count) | Simpson Index of Diversity |
|---|---|---|
| Cocoa agroforests | 120 | 0.53 |
| Cropland | 102 | 0.67 |
| Fallow land | 99 | 0.88 |
| Forest | 263 | 0.97 |
| Palm plantation | 62 | 0.64 |
| Riparian forests | 105 | 0.98 |
| Rubber plantation | 1 | 0 |
| Total | 328 | 0.87 |
Table 1: Species diversity across seven land use types.
The results indicate that forests harboured the highest number of species (159) and the highest Simpson Diversity Index (0.92), highlighting their importance as biodiversity hotspots. Cocoa plantations also showed significant diversity, with 136 species and a diversity index of 0.89, suggesting that these agroforestry systems may play a role in biodiversity conservation. Riparian forests, despite having fewer species than cocoa plantations, maintained a high diversity index (0.87), underscoring their ecological significance. Fallow lands and other land use types (cropland and rubber plantations) exhibited lower species numbers but still maintained relatively high diversity indices.
Occurrence of Threatened Species Across Different Land use Types
The verification of the IUCN status of all plant species revealed the presence of 2 endangered species (EN), Guibourtia tesmannii and Microberlinia bisulcata all belonging to the Fabaceae family, 23 vulnerable species (VU), and 2 near-threatened (NT) species. Most of the species fell under the category of least concern (LC) while a few were not evaluated by the IUCN. A cross-examination of the species in the different land use types revealed the presence of most of the vulnerable species in forests, cocoa agroforests and riparian forests. Interestingly, some of these species were found in cropland while plantations recorded the least abundance of threatened species Table 2.
| Scientific name | Family | IUCN status | Relative abundance | |
|---|---|---|---|---|
| Red doussié | Afzelia bipindensis | Fabaceae | VU | 3.33 |
| White doussié | Afzelia pachyloba | Fabaceae | VU | 0.83 |
| Ozanbili | Antrocaryon micraster A. Chev. & Guill. | Anacardiaceae | VU | 3.33 |
| Ozanbili | Araliopsis soyauxii Engl. | Rutaceae | VU | 1.67 |
| Moabi | Baillonella toxisperma Pierre | Sapotaceae | VU | 0.33 |
| Moabi | Crateranthus talbotii Baker f. | Lecythidaceae | VU | 1.67 |
| Ozigo | Dacryodes buettneri (Engl.) H.J.Lam | Burseraceae | VU | 0.17 |
| Igaganga | Dacryodes igaganga Aubrév. & Pellegr. | Burseraceae | VU | 0.83 |
| Cameroon ebony | Diospyros crassiflora Hiern | Ebenaceae | VU | 5.33 |
| Cameroon ebony | Drypetes preussii (Pax) Hutch. | Putranjivaceae | VU | 1.67 |
| Cameroon ebony | Drypetes staudtii (Pax) Hutch. | Putranjivaceae | VU | 1.67 |
| White tiama | Entandrophragma angolense C.DC. | Meliaceae | VU | 0.17 |
| Sapellii | Entandrophragma cylindricum (Sprague) Sprague | Meliaceae | VU | 0.83 |
| Sipo | Entandrophragma utile (Dawe & Sprague) Sprague | Meliaceae | VU | 0.17 |
| Bitter kola | Garcinia kola Heckel | Clusiaceae | VU | 9.5 |
| Limbali | Gilbertiodendron klainei (Pierre ex Pellegr.) J.Léonard | Fabaceae | VU | 0.17 |
| Black Guarea | Guarea thompsonii Sprague & Hutch. | Meliaceae | VU | 0.17 |
| Bubinga | Guibourtia tessmannii (Harms) J. Léonard | Fabaceae | EN | 5.83 |
| African mahogany | Khaya ivorensis A. Chev. | Meliaceae | VU | 0.83 |
| Azobe/red ironwood | Lophira alata Banks ex C.F.Gaertn. | Ochnaceae | VU | 0.67 |
| Zingana | Microberlinia bisulcata A. Chev. | Fabaceae | EN | 0.17 |
| Abura | Mitragyna stipulosa (DC.) Kuntze | Rubiaceae | NT | 0.33 |
| Bilinga | Nauclea diderrichii (De Wild.) Merr. | Rubiaceae | NT | 1.67 |
| Koto | Pterygota bequaertii De Wild. | Malvaceae | VU | 0.67 |
| ng | Sterculia oblongum (Mast.) Pierre ex A. Chev. | Malvaceae | VU | 6 |
| ng | Strychnos staudtii Strychnos L. | Loganiaceae | VU | 0.33 |
| Avodiré | Turraeanthus africana (Welw. ex C.DC.) Pellegr. | Meliaceae | VU | 16 |
Table 2: Relative abundance of threatened species across different land use types.
Carbon Storage Potential of the Different Land use Types
The assessment of aboveground biomass across different land use types provided insights into the carbon storage potential of the ecosystem (Table 1). The results show that riparian forests stored the highest amount of aboveground biomass (100 tons/ha), highlighting their crucial role in carbon sequestration and climate regulation. Fallow lands and cocoa plantations also demonstrated significant carbon storage potential, with 33 tons/ha and 29 tons/ha, respectively. These findings suggest that allowing natural regeneration in fallow lands and maintaining diverse agroforestry systems like cocoa plantations could contribute substantially to carbon sequestration efforts. The total AGB for the HPP site (1327.8 tons) and the reservoir area (850.2 tons) indicates the significant carbon storage capacity of the entire project area, emphasizing the importance of careful land use planning and management to minimize carbon losses (Table 3).
| Number of Transects | Sampled Area (ha) | Average diameter per ha | Total Stem density | Average stem density | Total AGB (Mg) | Average AGB (Mg/ha) | |
|---|---|---|---|---|---|---|---|
| Cocoa agroforests | 12 | 24 | 13.1 | 4947 | 206.12 | 509.47 | 21.23 |
| Cropland | 7 | 14 | 15.18 | 1550 | 110.71 | 307.81 | 21.99 |
| Fallow land | 4 | 8 | 14.51 | 1031 | 128.88 | 166.41 | 20.8 |
| Forest | 12 | 24 | 15.21 | 5235 | 218.12 | 1256.88 | 52.37 |
| Palm plantation | 6 | 12 | 18.15 | 1113 | 92.75 | 315.6 | 26.3 |
| Riparian forests | 2 | 4 | 18.13 | 497 | 124.25 | 208.51 | 52.13 |
| Rubber plantation | 1 | 2 | 23.62 | 6 | 3 | 1.07 | 0.54 |
| Total | 44 | 88 | 117.9 | 14379 | 883.83 | 2765.75 | 195.36 |
Table 3: Average and total values for stem density, diameter and Aboveground Biomass (AGB) by Land Use Type.
Discussion
Land use Types, Species Diversity and Carbon Storage and Threatened Species
Six major land use types were observed occupying important surface areas across the different transects surveyed. The highest proportions were observed for cocoa agroforests, forests and fallows and palm plantations, respectively. The predominance of these land use types is evidence of the high anthropogenic action on the landscape. These findings are in line with the findings of Biah, et al. [12] which highlighted that anthropogenic pressure causes regressive conversion of forests to croplands, fallows and other land use types. The high species diversity observed across different land use types, particularly in forests and cocoa plantations, aligns with previous studies highlighting the biodiversity richness of tropical ecosystems [13]. The significant diversity in cocoa plantations (136 species, Simpson Index 0.89) suggests that agroforestry systems can contribute to biodiversity conservation, supporting the findings of Strassburg, et al_. [14] in the Brazilian Atlantic Forest. The aboveground biomass results highlight the carbon storage potential of different land use types. General decrease in carbon stocks as one move from forest to plantations. This could be attributed to the high level of anthropogenic factors driving the conversion of forests to other land use types. Basuki, et al. [15] observed that land forest conversion to other land types significantly influences on carbon sinks. This underscores the importance of preserving and restoring these ecosystems for climate change mitigation, as emphasized by Strassburg, et al._ [14] Riparian forests stored the highest amount (100 tons/ha). The significant AGB in fallow lands (33 tons/ha) suggests that natural regeneration in these areas could provide substantial benefits for carbon sequestration and habitat restoration.
The identification of threatened species within the project area, including two endangered species (Guibourtia tessmannii, Microberlinia bisulcata) and several vulnerable species, emphasizes the conservation value of the ecosystem. This aligns with the challenges highlighted by Jones, et al. [1] regarding the implementation of NNL policies in biodiversity-rich tropical regions. The presence of these species across different parts of the project area supports the need for a landscape-level approach to biodiversity offsetting, as suggested by Wachter, et al. [3] Achieving true “no net loss” of biodiversity remains challenging, as noted by Weissgerber. et al, the high biodiversity and presence of threatened species in the project area suggest that finding equivalent offset sites with similar ecological value may be difficult. This underscores the importance of prioritizing avoidance and minimization of impacts before considering offsetting measures.
Implications of Biodiversity Spread and Carbon Storage of Different Land use Types for Achieving no Net Loss Within Large Infrastructure Projects
The study revealed a dynamic infrastructure development landscape in which different land use types are observed with a considerable change in biodiversity across the different types. These findings underscore the important role that forest play in conserving biodiversity. The study also highlights the place of cocoa agroforest in minimizing biodiversity loss after the conversion of forests, with important carbon stocks that play a vital role in maintaining the ecological balance of the ecosystem in the absence of forest as it mimics the forest in its vegetation structure and plant diversity [16]. The predominance of cocoa agroforests in the study site could therefore be used as a measure of reducing biodiversity loss in infrastructure development landscapes where they are abundant. The analysis of the different land use types also revealed the abundance and spread of the major land use types on the landscape. This implies that minimizing damage during the construction works could considerably limit biodiversity loss as what may be lost on the construction site could possibly be compensated for in similar land use types elsewhere on the same landscape. This favours the conservation of threatened species on a landscape scale. This possibility is supported by the fact that majority of the threatened species were found in three land use types (forest, cocoa agroforests and riparian forests).
Infrastructure development in tropical regions often overlaps with critical, natural, and modified habitats, necessitating biodiversity offsets to ensure no net loss of biodiversity values and a net gain of critical habitat in accordance with internationally recognised standards. Net gains refer to additional conservation outcomes for the biodiversity values that designated the critical habitat and include conservation actions benefiting biodiversity value. In Cameroon, two primary classes of biodiversity offsets are applicable for critically endangered fauna: restoration offsets and averted offsets. Restoration offsets involve protecting or restoring habitats for populations of critically endangered/endangered fauna that have suffered significant non-Project related impacts in the past (i.e., populations at greatly reduced densities compared to previous levels), thereby allowing them to recover. Restoration offsets offer the advantage of delivering tangible gains and mitigating issues of predicting potential future losses. Averted offsets enhance protection of existing but threatened biodiversity values, preventing predicted future losses unrelated to Project activities. This involves implementing conservation actions at sites where large populations of the biodiversity value face threats from hunting, capture, and agricultural habitat clearance, aiming to reduce these threats as much as possible. The gains made represent the ‘averted loss,’ i.e., the difference between predicted loss under a counterfactual scenario and actual loss under an offset scenario.
Case studies in Cameroon, such as the Chad-Cameroon pipeline project, exemplify the focus on averted loss, leading to the establishment of the Campo Ma’an National Park to protect its rich wildlife (chimpanzees, elephants, and gorillas) and flora, and the Mbam-Djerem National Park to safeguard its wildlife (hippopotamus, elephants, chimpanzees, pangolins, etc.) from poaching. The construction of the Lom Panger Dam further financed the continuous support of the Mbam- Djerem National Park. Challenges in Cameroon include long-term planning and integrating developmental projects into biodiversity conservation strategies. Many national parks are downsized or reduced due to major infrastructure developments. Additional pressure was exerted on the Campo Ma’an National Park by the Memvele Dam and Hydropower Project, and similarly, the Mbam-Djerem National Park was impacted by the Lom Panger Dam Project. Furthermore, measuring the results of biodiversity offsets to determine no net loss (NNL) and net gain (NG) poses challenges, requiring consistent management of protected sites and sound inventories over 20 years to generate solid data supporting sustained NNL/NG justification. Demonstrating net gain, while difficult, is considered essentially achieved when the population of biodiversity values (e.g., chimpanzees, gorillas, elephants) is stable or preferably increasing. To ensure net gain, it is recommended to undertake both offset and restoration of project sites, as well as onsite set-asides, to maximise opportunities for biodiversity conservation [17, 18, 19].
Conclusion
This study demonstrates the potential of biodiversity rich landscapes in contributing to biodiversity conservation and carbon sequestration in the context of infrastructure development projects in Cameroon. The findings of this study provide valuable insights into achieving No Net Loss of biodiversity in infrastructure development projects in Cameroon’s tropical forests combining biodiversity richness with high carbon storage land use types. The findings support the implementation of NNL strategies that incorporate, agroforestry practices, and targeted conservation of threatened species. This study contributes in providing baseline data on plant diversity, carbon storage potential, the spread of threatened species and their implications in reducing biodiversity loss within large infrastructure development projects to inform policy and practice regarding biodiversity offsetting in Cameroon using an onsite landscape approach. This study concludes that the combination of biodiversity rich land use types with high carbon storage land use types can serve as a model in offsetting biodiversity loss within large infrastructure development landscapes under minimal construction impacts. However, future research should focus on long-term monitoring of naturally regenerating areas to better understand their trajectory and ecological equivalence to old forests.
| Species | Frequency | Number of stems | Min. diameter | Max. diameter | Basal area (m3) | Important Value Index |
|---|---|---|---|---|---|---|
| Afzelia bipindensis | 3 | 10 | 6.3 | 56.8 | 0.5 | 0.21 |
| Afzelia pachyloba | 1 | 2 | 8.3 | 63.7 | 0.32 | 0.1 |
| Aidia micrantha | 1 | 1 | 6.8 | 6.8 | 0 | 0.01 |
| Albizia adianthifolia | 1 | 1 | 30.3 | 30.3 | 0.07 | 0.03 |
| Albizia ferruginea | 1 | 3 | 6.1 | 10.2 | 0.01 | 0.03 |
| Albizia zygia | 12 | 86 | 4.8 | 111.5 | 6.33 | 2.24 |
| Alchornea cordifolia | 7 | 25 | 5.1 | 14.4 | 0.12 | 0.25 |
| Allanblackia floribunda | 2 | 10 | 5.9 | 40.2 | 0.31 | 0.16 |
| Allophylus africanus | 1 | 1 | 6.1 | 6.1 | 0 | 0.01 |
| Alstonia boonei | 13 | 37 | 5.6 | 159.2 | 5.9 | 1.8 |
| Amphimas ferrugineus | 4 | 4 | 19.3 | 102.9 | 2.25 | 0.61 |
| Amphimas pterocarpoides | 2 | 5 | 9.9 | 25.5 | 0.14 | 0.08 |
| Angylocalyx pynaertii | 2 | 2 | 10.8 | 13.7 | 0.02 | 0.03 |
| Anisophyllea polyneura | 1 | 1 | 24 | 24 | 0.05 | 0.03 |
| Anisophyllea sp. | 1 | 1 | 19.6 | 19.6 | 0.03 | 0.02 |
| Annickia affinis | 4 | 8 | 5.4 | 58.1 | 0.48 | 0.2 |
| Anonidium mannii | 1 | 1 | 30.6 | 30.6 | 0.07 | 0.03 |
| Anthocleista schweinfurthii | 2 | 4 | 9.9 | 31.8 | 0.12 | 0.07 |
| Anthocleista Schweinfurthii | 4 | 13 | 6.4 | 22.3 | 0.18 | 0.16 |
| Anthocleista vogelii | 3 | 5 | 5.4 | 21.5 | 0.06 | 0.07 |
| Anthonotha fragrans | 1 | 1 | 70.1 | 70.1 | 0.39 | 0.11 |
| Anthonotha lamprophylla | 2 | 9 | 5.6 | 22.8 | 0.1 | 0.1 |
| Anthonotha macrophylla | 8 | 39 | 5.1 | 21.3 | 0.3 | 0.4 |
| Anthostema aubryanum | 7 | 76 | 5.1 | 40.6 | 1.1 | 0.85 |
| Antiaris sp. | 1 | 1 | 15.4 | 15.4 | 0.02 | 0.02 |
| Antiaris toxicaria | 1 | 2 | 35 | 101.3 | 0.9 | 0.24 |
| Antidesma membranaceum | 3 | 11 | 5.7 | 20.7 | 0.11 | 0.12 |
| Antrocaryon klaineanum | 2 | 5 | 7.6 | 23.6 | 0.1 | 0.07 |
| Antrocaryon micraster | 5 | 14 | 6.8 | 181.5 | 4.04 | 1.13 |
| Aoranthe cladantha | 9 | 55 | 5.1 | 26.4 | 0.37 | 0.54 |
| Araliopsis soyauxii | 3 | 5 | 7.2 | 33.8 | 0.13 | 0.09 |
| Baillonella toxisperma | 2 | 2 | 54.1 | 86.1 | 0.81 | 0.23 |
| Baphia laurifolia | 1 | 3 | 9.3 | 16.1 | 0.04 | 0.04 |
| Baphia leptobotrys | 6 | 64 | 5.1 | 35 | 0.89 | 0.71 |
| Baphia sp. | 2 | 3 | 11.9 | 22.1 | 0.06 | 0.05 |
| Barteria fistulosa | 6 | 19 | 5.4 | 15 | 0.14 | 0.21 |
| Beilschmiedia obscura | 2 | 5 | 8.9 | 33.4 | 0.21 | 0.1 |
| Berlinia sp. | 1 | 1 | 63.9 | 63.9 | 0.32 | 0.09 |
| Berlinia sp.2 | 1 | 2 | 6.3 | 15.1 | 0.02 | 0.03 |
| Bikinia le-testui | 5 | 8 | 5.9 | 140.1 | 2.55 | 0.72 |
| Blighia sapida | 1 | 3 | 6.1 | 7.3 | 0.01 | 0.03 |
| Blighia unijugata | 1 | 1 | 16.6 | 16.6 | 0.02 | 0.02 |
| Blighia welwitschii | 3 | 13 | 5.7 | 24.8 | 0.17 | 0.15 |
| Bombax buonopozense | 1 | 1 | 15 | 15 | 0.02 | 0.02 |
| Brachystegia mildbraedii | 1 | 9 | 5.4 | 63.7 | 0.51 | 0.2 |
| Bridelia sp. | 1 | 1 | 9 | 9 | 0.01 | 0.02 |
| Caloncoba glauca | 1 | 2 | 6.4 | 7.3 | 0.01 | 0.02 |
| Calpocalyx dinklagei | 1 | 1 | 25 | 25 | 0.05 | 0.03 |
| Canarium schweinfurthii | 6 | 14 | 5.7 | 87.9 | 1.24 | 0.45 |
| Canthium sp. | 1 | 1 | 6.4 | 6.4 | 0 | 0.01 |
| Carapa littoralis | 2 | 3 | 8.5 | 33.9 | 0.11 | 0.06 |
| Carapa procera | 12 | 77 | 5.1 | 34.6 | 1.04 | 0.88 |
| Carapa sp. | 1 | 2 | 10.5 | 12.5 | 0.02 | 0.03 |
| Cecropia peltata | 14 | 458 | 5.1 | 47.1 | 4.95 | 4.5 |
| Ceiba pentandra | 9 | 23 | 5.1 | 191.1 | 5.39 | 1.55 |
| Celtis zenkeri | 1 | 2 | 18 | 18.5 | 0.05 | 0.03 |
| Christiana africana | 3 | 9 | 5.1 | 71.7 | 0.66 | 0.25 |
| Chrysobalanus sp. | 1 | 2 | 8 | 8.4 | 0.01 | 0.02 |
| Chrysophyllum africanum | 4 | 9 | 5.1 | 72.5 | 0.7 | 0.26 |
| Chrysophyllum boukokoense | 2 | 5 | 9.1 | 26.4 | 0.1 | 0.07 |
| Chrysophyllum ubanguiense | 1 | 1 | 17.2 | 17.2 | 0.02 | 0.02 |
| Chytranthus sp. | 1 | 1 | 9 | 9 | 0.01 | 0.02 |
| Chytranthus talbotii | 1 | 1 | 8.8 | 8.8 | 0.01 | 0.02 |
| Citharexylum flexuosum | 2 | 2 | 15.8 | 45.4 | 0.18 | 0.07 |
| Citrus limon | 1 | 1 | 23.9 | 23.9 | 0.04 | 0.02 |
| Citrus reticulata | 8 | 27 | 8 | 49.4 | 0.9 | 0.47 |
| Citrus sinensis | 8 | 47 | 5.1 | 35.4 | 1.08 | 0.65 |
| Cleistopholis glauca | 7 | 18 | 5.4 | 44.7 | 0.36 | 0.26 |
| Cleistopholis patens | 5 | 19 | 6.7 | 60.5 | 0.86 | 0.38 |
| Cocos nucifera | 4 | 4 | 0 | 0.06 | ||
| Coelocaryon preussii | 7 | 29 | 5.7 | 76.1 | 2.05 | 0.76 |
| Coffea canephora | 6 | 148 | 5.2 | 16.7 | 0.71 | 1.25 |
| Coffea sp. | 2 | 9 | 5.1 | 8.6 | 0.03 | 0.08 |
| Cola anomala | 2 | 4 | 11.1 | 21.3 | 0.07 | 0.06 |
| Cola argentea | 3 | 4 | 5.4 | 12.4 | 0.02 | 0.05 |
| Cola chlamydantha | 1 | 1 | 10 | 10 | 0.01 | 0.02 |
| Cola ficifolia | 4 | 15 | 5.4 | 26.4 | 0.19 | 0.18 |
| Cola lepidota | 7 | 42 | 5.1 | 35.4 | 0.58 | 0.48 |
| Cola marsupium | 3 | 6 | 5.1 | 19 | 0.08 | 0.08 |
| Cola nitida | 12 | 537 | 5.3 | 86.3 | 26.27 | 10.3 |
| Cola rostrata | 4 | 7 | 7.4 | 40.9 | 0.41 | 0.18 |
| Cola sp. | 5 | 26 | 5.4 | 18.5 | 0.22 | 0.27 |
| Cordia africana | 2 | 4 | 6.2 | 9.9 | 0.02 | 0.05 |
| Corynanthe pachyceras | 3 | 7 | 6.1 | 38.5 | 0.21 | 0.12 |
| Coula edulis | 1 | 1 | 11.8 | 11.8 | 0.01 | 0.02 |
| Crateranthus talbotii | 1 | 5 | 8.6 | 29.7 | 0.14 | 0.08 |
| Craterispermum aristatum | 1 | 1 | 9.7 | 9.7 | 0.01 | 0.02 |
| Crotonogyne sp. | 1 | 4 | 6.4 | 11.8 | 0.03 | 0.04 |
| Crudia gabonensis | 3 | 16 | 6.7 | 38.9 | 0.38 | 0.23 |
| Crudia klainei | 1 | 2 | 18.2 | 31.5 | 0.1 | 0.05 |
| Cylicodiscus gabunensis | 1 | 1 | 130.6 | 130.6 | 1.34 | 0.34 |
| Cyrtogonone argentea | 1 | 1 | 27.8 | 27.8 | 0.06 | 0.03 |
| Dacryodes buettneri | 6 | 35 | 5.4 | 37.3 | 0.79 | 0.48 |
| Dacryodes edulis | 16 | 277 | 5.1 | 66.9 | 9.69 | 4.43 |
| Dacryodes heudelotii | 1 | 1 | 17.8 | 17.8 | 0.02 | 0.02 |
| Dacryodes igaganga | 2 | 2 | 42 | 52.5 | 0.36 | 0.12 |
| Dacryodes klaineana | 1 | 1 | 9.3 | 9.3 | 0.01 | 0.02 |
| Dacryodes macrophylla | 11 | 127 | 5.1 | 114.6 | 4.53 | 2.08 |
| Dacryodes sp. | 1 | 1 | 8.6 | 8.6 | 0.01 | 0.02 |
| Dasylepis blackii | 3 | 7 | 5.7 | 21.2 | 0.07 | 0.09 |
| Dasylepis sp. | 1 | 1 | 20.1 | 20.1 | 0.03 | 0.02 |
| Desbordesia insignis | 10 | 95 | 5.7 | 159.2 | 29.63 | 8.05 |
| Desplatsia dewevrei | 1 | 1 | 13.4 | 13.4 | 0.01 | 0.02 |
| Detarium macrocarpum | 3 | 4 | 13.4 | 99.7 | 1.32 | 0.37 |
| Dialium bipindense | 8 | 30 | 6.1 | 116.2 | 3.02 | 1.01 |
| Dialium pachyphyllum | 1 | 1 | 10.2 | 10.2 | 0.01 | 0.02 |
| Dialium zenkeri | 7 | 26 | 5.7 | 57.3 | 1.21 | 0.53 |
| Didelotia letouzeyi | 2 | 2 | 12.1 | 15 | 0.03 | 0.03 |
| Diospyros canaliculata | 2 | 5 | 5.9 | 25.5 | 0.07 | 0.07 |
| Diospyros crassiflora | 8 | 29 | 5.4 | 100.3 | 1.52 | 0.63 |
| Diospyros hoyleana | 2 | 2 | 7.6 | 11.8 | 0.02 | 0.03 |
| Diospyros iturensis | 2 | 20 | 6.1 | 20 | 0.21 | 0.21 |
| Diospyros mannii | 2 | 5 | 6.6 | 38.2 | 0.14 | 0.08 |
| Diospyros pseudomespilus | 1 | 1 | 15.3 | 15.3 | 0.02 | 0.02 |
| Diospyros sp. | 11 | 158 | 5.1 | 45.9 | 2.21 | 1.72 |
| Diospyros suaveolens | 9 | 282 | 5.1 | 37.6 | 3.04 | 2.77 |
| Discoglypremna caloneura | 8 | 25 | 6.4 | 60.5 | 1.14 | 0.51 |
| Disilipes sp. | 1 | 1 | 7.3 | 7.3 | 0 | 0.01 |
| Distemonanthus benthamianus | 6 | 29 | 5.1 | 79.6 | 1.73 | 0.67 |
| Drypetes gossweileri | 2 | 5 | 12.1 | 22.9 | 0.13 | 0.08 |
| Drypetes preussii | 1 | 1 | 24.2 | 24.2 | 0.05 | 0.03 |
| Drypetes sp. | 1 | 1 | 32.8 | 32.8 | 0.08 | 0.03 |
| Drypetes staudtii | 2 | 10 | 6.5 | 24.3 | 0.18 | 0.13 |
| Duboscia macrocarpa | 3 | 3 | 21.7 | 95.5 | 0.8 | 0.24 |
| Duguetia staudtii | 1 | 1 | 15 | 15 | 0.02 | 0.02 |
| Elaeis guineensis | 16 | 998 | 0 | 7.05 | ||
| Endodesmia calophylloides | 6 | 67 | 5.1 | 44.3 | 0.82 | 0.71 |
| Entandrophragma angolense | 1 | 1 | 20.1 | 20.1 | 0.03 | 0.02 |
| Entandrophragma congoense | 3 | 3 | 8.3 | 25.8 | 0.06 | 0.06 |
| Entandrophragma cylindricum | 1 | 1 | 9.9 | 9.9 | 0.01 | 0.02 |
| Entandrophragma utile | 1 | 1 | 60.5 | 60.5 | 0.29 | 0.08 |
| Eribroma oblongum | 6 | 21 | 5.9 | 98.7 | 1.87 | 0.65 |
| Eriocoelum macrocarpum | 8 | 278 | 5.1 | 95.5 | 3.33 | 2.81 |
| Erythrophleum ivorense | 2 | 4 | 10.8 | 63.7 | 0.63 | 0.2 |
| Ficus exasperata | 15 | 217 | 5.1 | 58.6 | 3.77 | 2.55 |
| Ficus mucuso | 10 | 30 | 5.1 | 105.1 | 2.96 | 1.01 |
| Ficus sp. | 1 | 1 | 5.1 | 5.1 | 0 | 0.01 |
| Ficus sur | 1 | 1 | 52.5 | 52.5 | 0.22 | 0.07 |
| Fillaeopsis discophora | 1 | 1 | 6.7 | 6.7 | 0 | 0.01 |
| Fleroya ledermannii | 2 | 11 | 5.7 | 31.2 | 0.11 | 0.12 |
| Fleroya stipulosa | 1 | 1 | 19.8 | 19.8 | 0.03 | 0.02 |
| Funtumia africana | 6 | 34 | 5.1 | 101.9 | 1.36 | 0.61 |
| Funtumia elastica | 7 | 23 | 5.1 | 54.1 | 0.82 | 0.41 |
| Gambeya beguei | 2 | 2 | 8.6 | 11.8 | 0.02 | 0.03 |
| Garcinia kola | 10 | 22 | 5.4 | 63.7 | 0.99 | 0.47 |
| Garcinia mannii | 5 | 62 | 5.1 | 26.1 | 0.71 | 0.64 |
| Garcinia smeathmanii | 1 | 3 | 8.6 | 9.9 | 0.02 | 0.03 |
| Garcinia sp. | 1 | 1 | 15.7 | 15.7 | 0.02 | 0.02 |
| Gilbertiodendron klainei | 3 | 5 | 11.1 | 191.1 | 3.4 | 0.9 |
| Gilletiodendron kisantuense | 2 | 3 | 6.1 | 43.6 | 0.22 | 0.09 |
| Grewia coriacea | 3 | 4 | 6.1 | 51 | 0.25 | 0.11 |
| Guarea thompsonii | 5 | 6 | 6.1 | 26.1 | 0.14 | 0.11 |
| Guibourtia tessmannii | 2 | 2 | 9.6 | 55.7 | 0.25 | 0.09 |
| Harungana madagascariensis | 4 | 8 | 5.1 | 16.3 | 0.06 | 0.1 |
| Heisteria parvifolia | 1 | 2 | 12.4 | 27 | 0.07 | 0.04 |
| Heisteria sp. | 3 | 3 | 12.6 | 14.4 | 0.04 | 0.05 |
| Hevea brasiliensis | 2 | 73 | 5.3 | 53.5 | 1.93 | 1 |
| Holoptelea grandis | 3 | 3 | 9.6 | 22.9 | 0.06 | 0.06 |
| Homalium le-testui | 6 | 11 | 5.4 | 101.6 | 1.23 | 0.42 |
| Homalium sp. | 5 | 47 | 5.1 | 42.7 | 0.69 | 0.53 |
| Hylodendron gabunense | 3 | 16 | 5.6 | 69.1 | 0.96 | 0.37 |
| Hymenostegia afzelii | 4 | 17 | 5.7 | 25.2 | 0.2 | 0.2 |
| Hypodaphnis zenkeri | 8 | 31 | 6.7 | 85.7 | 1.84 | 0.72 |
| Indetermine 2 | 1 | 2 | 7.5 | 8.9 | 0.01 | 0.02 |
| Indetermine NA | 5 | 13 | 5.8 | 20.4 | 0.12 | 0.15 |
| Irvingia gabonensis | 10 | 23 | 6.8 | 127.4 | 5.86 | 1.68 |
| Irvingia grandifolia | 8 | 13 | 6.4 | 127.4 | 3.06 | 0.9 |
| Irvingia robur | 2 | 8 | 5.7 | 30.9 | 0.15 | 0.11 |
| Irvingia smithii | 1 | 1 | 5.7 | 5.7 | 0 | 0.01 |
| Khaya ivorensis | 1 | 2 | 7.3 | 11.1 | 0.01 | 0.02 |
| Klaineanthus gaboniae | 7 | 26 | 5.9 | 101.9 | 2.41 | 0.82 |
| Klainedoxa gabonensis | 3 | 4 | 37.6 | 66.9 | 1.07 | 0.31 |
| Lannea welwitschii | 9 | 17 | 6.1 | 86 | 2.69 | 0.85 |
| Lasiodiscus fasciculiflorus | 1 | 1 | 9.9 | 9.9 | 0.01 | 0.02 |
| Lasiodiscus marmoratus | 1 | 2 | 9.6 | 9.9 | 0.01 | 0.02 |
| Lasiodiscus sp. | 1 | 2 | 8.8 | 9 | 0.01 | 0.02 |
| Lecaniodiscus cupanioides | 1 | 3 | 15.4 | 24.9 | 0.09 | 0.05 |
| Lecaniodiscus sp. | 1 | 1 | 5.8 | 5.8 | 0 | 0.01 |
| Lecythidaceae | 1 | 1 | 23 | 23 | 0.04 | 0.02 |
| Lepidobotrys staudtii | 1 | 1 | 23.5 | 23.5 | 0.04 | 0.02 |
| Lophira alata | 2 | 4 | 14.7 | 63.7 | 0.49 | 0.16 |
| Lovoa trichilioides | 2 | 5 | 7.3 | 14 | 0.05 | 0.06 |
| Macaranga assas | 3 | 8 | 5.7 | 10.5 | 0.04 | 0.09 |
| Macaranga barteri | 7 | 142 | 5.1 | 43.2 | 1.96 | 1.52 |
| Macaranga hurifolia | 4 | 28 | 5.1 | 18.2 | 0.2 | 0.27 |
| Macaranga monandra | 5 | 20 | 5.1 | 24 | 0.26 | 0.24 |
| Macaranga sp. | 1 | 1 | 10.8 | 10.8 | 0.01 | 0.02 |
| Macaranga spinosa | 2 | 4 | 7 | 8.9 | 0.02 | 0.05 |
| Maesobotrya barteri | 2 | 4 | 6.5 | 10.9 | 0.03 | 0.05 |
| Maesopsis eminii | 4 | 10 | 6.7 | 32.2 | 0.27 | 0.16 |
| Majidea fosteri | 10 | 61 | 5.4 | 38.1 | 1.1 | 0.76 |
| Majidea sp. | 1 | 1 | 36.4 | 36.4 | 0.1 | 0.04 |
| Mangifera indica | 4 | 7 | 10.4 | 87.6 | 2.42 | 0.67 |
| Manilkara sp. | 1 | 1 | 40.1 | 40.1 | 0.13 | 0.05 |
| Maprounea membranacea | 1 | 2 | 10.8 | 14 | 0.02 | 0.03 |
| Maranthes glabra | 4 | 12 | 6.4 | 28.7 | 0.18 | 0.15 |
| Maranthes sp. | 2 | 3 | 11.3 | 12.6 | 0.03 | 0.04 |
| Mareyopsis longifolia | 3 | 18 | 5.4 | 57.3 | 1.96 | 0.63 |
| Margaritaria discoidea | 3 | 5 | 6.4 | 58.4 | 0.38 | 0.15 |
| Massularia acuminata | 6 | 19 | 5.1 | 19.1 | 0.09 | 0.2 |
| Microberlinia bisulcata | 1 | 1 | 40.6 | 40.6 | 0.13 | 0.05 |
| Milicia excelsa | 5 | 7 | 11.8 | 76.8 | 1.59 | 0.48 |
| Milletia sp. | 2 | 2 | 8.7 | 10.3 | 0.01 | 0.03 |
| Millettia sanagana | 5 | 10 | 6.4 | 23.6 | 0.13 | 0.14 |
| Mitragyna stipulosa | 1 | 1 | 15.5 | 15.5 | 0.02 | 0.02 |
| Monodora tenuifolia | 1 | 1 | 9.2 | 9.2 | 0.01 | 0.02 |
| Monopetalanthus letestui | 2 | 2 | 11.8 | 11.8 | 0.02 | 0.03 |
| Morinda deplanchei | 1 | 1 | 25.5 | 25.5 | 0.05 | 0.03 |
| Morinda lucida | 14 | 65 | 5.7 | 51 | 1.8 | 0.99 |
| Musanga cecropioides | 15 | 772 | 5.1 | 79.6 | 39.87 | 15.32 |
| Myrianthus arboreus | 11 | 60 | 5.7 | 30.3 | 1.15 | 0.78 |
| NA | 2 | 3 | 17.8 | 23.9 | 0.11 | 0.06 |
| Nauclea diderrichii | 3 | 5 | 9.4 | 45.5 | 0.2 | 0.1 |
| Nauclea pobeguinii | 4 | 6 | 8.3 | 35.2 | 0.19 | 0.12 |
| Newbouldia laevis | 1 | 2 | 8.7 | 11.8 | 0.02 | 0.03 |
| Odyendyea gabonensis | 5 | 25 | 6.1 | 41.4 | 0.6 | 0.36 |
| Olax sp. | 2 | 5 | 7.7 | 13.7 | 0.05 | 0.06 |
| Oncoba glauca | 2 | 2 | 6.4 | 6.4 | 0.01 | 0.03 |
| Oncoba sp. | 1 | 1 | 7.3 | 7.3 | 0 | 0.01 |
| Oncoba welwitschia | 1 | 14 | 5.4 | 9.3 | 0.06 | 0.12 |
| Ormocarpum bernierianum | 2 | 3 | 15.6 | 40.8 | 0.19 | 0.08 |
| Ouratea sp. | 1 | 4 | 6.3 | 9.9 | 0.02 | 0.04 |
| Pancovia sp. | 1 | 2 | 5.3 | 17.3 | 0.03 | 0.03 |
| Panda oleosa | 4 | 6 | 8.9 | 79.6 | 1.14 | 0.35 |
| Parkia bicolor | 2 | 5 | 7.3 | 73.2 | 0.86 | 0.26 |
| Passiflora sp. | 1 | 5 | 5.7 | 11.1 | 0.02 | 0.05 |
| Pauridiantha floribunda | 1 | 16 | 5.3 | 8.9 | 0.07 | 0.14 |
| Pausinystalia macroceras | 1 | 9 | 6.5 | 40.7 | 0.42 | 0.17 |
| Penianthus longifolius | 2 | 33 | 5.1 | 9.6 | 0.12 | 0.27 |
| Pentaclethra macrophylla | 5 | 15 | 5.1 | 119.4 | 2.23 | 0.69 |
| Persea americana | 12 | 51 | 5.5 | 54.5 | 2.01 | 0.93 |
| Petersianthus macrocarpus | 6 | 25 | 6.5 | 55.7 | 0.66 | 0.38 |
| Phyllanthus discoideus | 1 | 1 | 10.8 | 10.8 | 0.01 | 0.02 |
| Picralima nitida | 2 | 2 | 10.5 | 30.3 | 0.08 | 0.05 |
| Piptadeniastrum africanum | 13 | 33 | 5.1 | 111.5 | 3.42 | 1.16 |
| Plagiosiphon multijugus | 8 | 80 | 5.4 | 63.7 | 4.3 | 1.67 |
| Plagiostyles africana | 6 | 80 | 5.4 | 127.4 | 4.76 | 1.77 |
| Polyalthia suaveolens | 6 | 37 | 5.4 | 47.8 | 1.26 | 0.61 |
| Polysphaeria macrophylla | 2 | 5 | 6.2 | 20.6 | 0.06 | 0.06 |
| Pouteria altissima | 1 | 1 | 28 | 28 | 0.06 | 0.03 |
| Pouteria pierrei | 1 | 1 | 10.5 | 10.5 | 0.01 | 0.02 |
| Pseudospondias microcarpa | 9 | 15 | 5.4 | 19.4 | 0.16 | 0.21 |
| Psidium guajava | 5 | 17 | 5.4 | 17.5 | 0.18 | 0.2 |
| Psychotria arborea | 1 | 3 | 5.8 | 10.3 | 0.02 | 0.03 |
| Psydrax sp. | 3 | 5 | 8.5 | 24.4 | 0.12 | 0.08 |
| Pterocarpus mildbraedii | 12 | 32 | 5.4 | 43 | 0.79 | 0.5 |
| Pterocarpus soyauxii | 13 | 100 | 5.1 | 111.5 | 5.81 | 2.22 |
| Pterygota bequaertii | 2 | 2 | 11.6 | 76.1 | 0.47 | 0.14 |
| Pycnanthus angolensis | 11 | 55 | 5.4 | 121 | 11.4 | 3.27 |
| Raphia monbuttorum | 4 | 5 | 0 | 0.06 | ||
| Rauvolfia caffra | 1 | 1 | 9.9 | 9.9 | 0.01 | 0.02 |
| Rauvolfia vomitoria | 12 | 81 | 5.1 | 34.7 | 0.83 | 0.85 |
| Ricinodendron heudelotii | 9 | 22 | 8.9 | 121 | 2.94 | 0.94 |
| Rinorea dentata | 2 | 12 | 5.4 | 8.8 | 0.05 | 0.11 |
| Rothmannia lujae | 7 | 31 | 5.7 | 41.4 | 0.45 | 0.37 |
| Rothmannia sp. | 3 | 6 | 13.2 | 28 | 0.27 | 0.13 |
| Rothmannia talbotii | 2 | 8 | 5.8 | 17.7 | 0.08 | 0.09 |
| Sabicea sp. | 1 | 1 | 0 | 0.01 | ||
| Santiria trimera | 5 | 22 | 6.1 | 43 | 0.72 | 0.37 |
| Sapium ellipticum | 1 | 2 | 28.7 | 41.4 | 0.2 | 0.07 |
| Sapium sp. | 1 | 4 | 10.5 | 19.4 | 0.07 | 0.05 |
| Scorodophloeus zenkeri | 2 | 3 | 20.5 | 35 | 0.17 | 0.08 |
| Scottellia klaineana | 6 | 39 | 5.7 | 79.6 | 2.58 | 0.95 |
| Scyphocephalium mannii | 7 | 49 | 5.1 | 159.2 | 9.09 | 2.63 |
| Sorindeia grandifolia | 4 | 15 | 7.3 | 62.1 | 0.5 | 0.26 |
| Sous reserve | 1 | 2 | 8 | 8.6 | 0.01 | 0.02 |
| Spathodea campanulata | 2 | 3 | 6.7 | 13.1 | 0.02 | 0.04 |
| Spondianthus preussii | 1 | 2 | 11.1 | 69.4 | 0.39 | 0.12 |
| Spondianthus sp. | 1 | 79 | 5.1 | 21 | 0.8 | 0.75 |
| Spondias mombin | 9 | 731 | 5.1 | 27.7 | 5.8 | 6.58 |
| Stachyothyrsus staudtii | 1 | 1 | 45.9 | 45.9 | 0.17 | 0.05 |
| Staudtia kamerunensis | 14 | 140 | 5.4 | 111.5 | 9.89 | 3.51 |
| Sterculia mildbraedii | 4 | 7 | 6.7 | 45.9 | 0.3 | 0.15 |
| Sterculia rhinopetala | 2 | 26 | 8.2 | 30.9 | 0.78 | 0.39 |
| Sterculia subviolacea | 2 | 2 | 15.8 | 22.3 | 0.06 | 0.04 |
| Sterculia tragacantha | 5 | 10 | 6.4 | 33.8 | 0.19 | 0.15 |
| Strephonema pseudocola | 1 | 1 | 36.6 | 36.6 | 0.11 | 0.04 |
| Strombosia grandifolia | 6 | 75 | 5.1 | 66.9 | 2.62 | 1.21 |
| Strombosia pustulata | 12 | 55 | 5.1 | 71.7 | 1.81 | 0.91 |
| Strombosia scheffleri | 3 | 7 | 5.1 | 26.1 | 0.15 | 0.11 |
| Strombosia sp. | 2 | 2 | 7.8 | 24.4 | 0.05 | 0.04 |
| Strombosia sp.2 | 1 | 1 | 121 | 121 | 1.15 | 0.3 |
| Strombosiopsis tetrandra | 5 | 15 | 5.1 | 57.3 | 1.36 | 0.48 |
| Strychnos staudtii | 2 | 2 | 9.3 | 25.7 | 0.06 | 0.04 |
| Symphonia globulifera | 2 | 3 | 5.7 | 24 | 0.07 | 0.05 |
| Synsepalum dulcificum | 1 | 1 | 12.7 | 12.7 | 0.01 | 0.02 |
| Syzygium sp. | 1 | 1 | 15.9 | 15.9 | 0.02 | 0.02 |
| Tabernaemontana crassa | 7 | 38 | 5.7 | 34.1 | 0.56 | 0.45 |
| Tapura africana | 2 | 4 | 11.7 | 25.5 | 0.11 | 0.07 |
| Terminalia superba | 7 | 16 | 17.9 | 79.6 | 2.66 | 0.82 |
| Tetraberlinia bifoliolata | 1 | 8 | 5.7 | 120.4 | 2.14 | 0.59 |
| Tetraberlinia polyphylla | 1 | 1 | 8.6 | 8.6 | 0.01 | 0.02 |
| Tetrapleura tetraptera | 2 | 2 | 15.3 | 39.4 | 0.14 | 0.06 |
| Tetrorchidium didymostemon | 8 | 74 | 5.1 | 27.2 | 1.02 | 0.82 |
| Theobroma cacao | 15 | 4856 | 5.1 | 136 | 56.99 | 47.94 |
| Thomandersia hensii | 3 | 6 | 8.8 | 17.8 | 0.06 | 0.08 |
| Thomandersia sp. | 1 | 2 | 6.4 | 6.7 | 0.01 | 0.02 |
| Treculia africana | 1 | 2 | 7.9 | 8.5 | 0.01 | 0.02 |
| Treculia africanus | 6 | 97 | 5.1 | 47.8 | 1.62 | 1.12 |
| Treculia obovoidea | 2 | 52 | 5.5 | 41.1 | 1.21 | 0.67 |
| Treculia sp. | 1 | 1 | 9.2 | 9.2 | 0.01 | 0.02 |
| Trema orientalis | 4 | 7 | 5.4 | 9.6 | 0.03 | 0.08 |
| Tricalysia pangolina | 1 | 1 | 6.3 | 6.3 | 0 | 0.01 |
| Tricalysia sp. | 2 | 2 | 6 | 8.6 | 0.01 | 0.03 |
| Trichilia dregeana | 4 | 6 | 7.6 | 32.2 | 0.2 | 0.12 |
| Trichilia prieuriana | 3 | 27 | 7.4 | 50.3 | 1.26 | 0.52 |
| Trichilia rubescens | 3 | 9 | 5.9 | 70.1 | 0.55 | 0.22 |
| Trichilia tessmannii | 3 | 5 | 9.6 | 63.7 | 0.36 | 0.14 |
| Trichilia welwitschii | 10 | 75 | 5.1 | 26.1 | 0.67 | 0.76 |
| Trichoscypha acuminata | 4 | 6 | 11.1 | 51.6 | 0.5 | 0.19 |
| Trichoscypha macrophylla | 1 | 1 | 22.3 | 22.3 | 0.04 | 0.02 |
| Trichoscypha sp. | 1 | 2 | 10.2 | 10.9 | 0.02 | 0.03 |
| Turraeanthus africana | 6 | 32 | 5.6 | 48.4 | 0.94 | 0.5 |
| Uapaca guineensis | 5 | 11 | 7 | 95.5 | 1.72 | 0.54 |
| Uapaca paludosa | 4 | 7 | 6.8 | 35 | 0.17 | 0.12 |
| Uapaca sp. | 1 | 1 | 26.5 | 26.5 | 0.06 | 0.03 |
| Uapaca staudtii | 1 | 1 | 9.7 | 9.7 | 0.01 | 0.02 |
| Uvariastrum pierreanum | 2 | 2 | 6.1 | 25.4 | 0.05 | 0.04 |
| Vitex doniana | 3 | 5 | 8.3 | 44.3 | 0.42 | 0.16 |
| Vitex grandifolia | 6 | 14 | 6.1 | 76.4 | 0.82 | 0.34 |
| Vitex rivularis | 2 | 3 | 7.6 | 59.7 | 0.29 | 0.11 |
| Vitex sp. | 2 | 4 | 6.1 | 37.5 | 0.12 | 0.07 |
| Voacanga africana | 2 | 2 | 7 | 7.3 | 0.01 | 0.03 |
| Warneckea pulcherrima | 2 | 2 | 12.8 | 57.3 | 0.27 | 0.09 |
| Xylopia aethiopica | 2 | 3 | 10.8 | 37.9 | 0.2 | 0.08 |
| Xylopia quintasii | 2 | 3 | 15 | 27.4 | 0.13 | 0.07 |
| Zanthoxylum gilletii | 3 | 5 | 10.5 | 30.1 | 0.24 | 0.11 |
| Zanthoxylum macrophylla | 7 | 45 | 5.4 | 54.1 | 0.95 | 0.6 |
Annex 1: Species-specific characteristics.
References
-
Jones IL, Bull JW (2019) Major dams and the challenge of achieving “No Net Loss” of biodiversity in the tropics. _Sustainable Development_.
-
Ermgassen SO, Baker J, Griffiths RA, Strange N, Struebig MJ, et al. (2019) The ecological outcomes of biodiversity offsets under “no net loss” policies: A global review. Conservation Letters 12.
-
Quétier F, De Wachter P, Dessard H, Gersberg M, Halleson D, et al. (2015) Biodiversity offsets: opportunities and challenges for managing cumulative impacts of large-scale land-based investments on Africa’s forest landscapes and their biodiversity.
-
Te F (1979) The Guineo-Congolian region and its relationships to other phytochoria. Bulletin Du Jardin Botanique National de Belgique/Bulletin van de Nationale Plantentuin van Belgie 49(1): 11-55.
-
Fongnzossie FE, Ngansop TM, Zapfack VA, Kemeuze DJ, Sonwa M (2014) Density and natural regeneration potential of selected non-Timber Forest Products species in the semi-deciduous rainforest of southeastern Cameroon’. African Study Monographs Supplementary Issue 49: 67-88.
-
Ngansop TM, Biye EH, Fongnzossie FE, Forbi PF, Chimi DC (2019) Using transect sampling to determine the distribution of some key non-timber forest products across habitat types near Boumba-Bek National Park, South-east Cameroon. BMC Ecol 19(3).
-
Nath NR, Pélissier R, Garcia C (2010) Comparative efficiency of and accuracy of variable area transects versus square plots for sampling tree diversity and density. Agroforest syst 79: 223-236.
-
Onana JM (2011) The Vascular Plants of Cameroon: A Taxonomic Checklist with IUCN Assessments. Flore du C. National Herbarium Cameroon.
-
Chave J, Réjou-Méchain M, Búrquez A, Chidumayo E, Colgan MS, et al. (2014) Improved allometric models to estimate the aboveground biomass of tropical trees. Glob Chang Biol 20: 3177-3190.
-
Zanne AE, Lopez-Gonzalez G, Coomes DA, Ilic J, Jansen S, et al. (2009) Global wood density database. Dryad 235: 33.
-
Migolet P, Goïta K, Ngomanda A, Biyogo APM (2020) Estimation of aboveground oil palm biomass in a mature plantation in the Congo Basin. Forests 11: 1-23.
-
Biah I, Azihou AF, Guendehou S, Sinsin B (2024) Land use/land cover change and carbon footprint in tropical ecosystems in Benin, West Africa. Trees, Forests and People 15(2024): 100488.
-
Latawiec AE, Crouzeilles R, Brancalion PH, Rodrigues RR, Sansevero JB, et al. (2016) Natural regeneration and biodiversity: a global meta‐analysis and implications for spatial planning. Biotropica 48.
-
Strassburg BB, Barros FS, Crouzeilles R, Iribarrem A, Santos JS, et al. (2016) The role of natural regeneration to ecosystem services provision and habitat availability: a case study in the Brazilian Atlantic Forest. Biotropica 48.
-
Basuki I, Kauffman J, Murdiyarso D, Ansari G (2016) Carbon stocks and emissions from degradation and conversion of tropical peat swamp forests in west Kalimantan. Indonesia pp: 260-263.
-
Sonwa DJ, Nkongmeneck BA, Weise SF, Tchatat M, Adesina AA (2007) Diversity of plants in cocoa agroforests in the humid forest zone of Southern Cameroon. Biodivers Conserv 16: 2385-2400.
-
IUCN (2021) The IUCN Red List of Threatened Species. Version 2020-3.
-
Mensah S, Noulèkoun F, Ago EE (2020) Aboveground tree carbon stocks in West African semi-arid ecosystems: dominance patterns, size class allocation and structural drivers. Glob Ecol Conserv 24: e01331.
-
Nguekeng PB, Jiofack RB, Mbouwe IF, Tchanou AV (2018) Plant Diversity, Ecological Services, and Carbon Stock Assessment in Cocoa Agroforestry Plantations of Forest and Savannah Transitions in Cameroon. Forest Biomass and Carbon.
- Plant Diversity, Regeneration Dynamics, and Socio-Ecological Impacts at the Forest-Savanna Transition Zone, Cameroon
- Bird Community, Feeding Guilds and Habitat Associations Along the Proposed River Dibombe Hydropower and Transmission Line Project in Nkam and Moungo Divisions, Cameroon
- Optimization and Modelling for the Remediation of Brilliant Green Dye and Ni2+ ions from Water Using Advanced gC3N4/PVA@ Alginate Bio-Polymeric Hydrogel Beads
- The Negative Implications of Using Cell Phones on Human Health and Environment
- A Comprehensive Survey of Population Ecology in Insects
- Evaluation of Coiled Tubing Limitations to Drill Out Frac Plugs