Advancing In vitro Antioxidant Activity Assessment: A Comprehensive Methodological Review and Improved Approaches for DPPH, FRAP and H2O2 Assays
The study of antioxidants and their implications in numerous sectors, from food engineering to medicine and pharmacy, is of great interest to the scientific community. The presence of free radicals in the body has been linked to various human diseases. Fortunately, antioxidants can counteract these harmful molecules and reduce their negative impact. This highlights the importance of researching natural antioxidants found in plants. Free radicals are closely tied to the development of conditions like diabetes, cancer, and heart and neurological disorders. Exploring plants could lead to the discovery of new bioactive compounds with strong antioxidant properties. Natural resources, particularly herbs, have played a significant role in traditional medicine, benefiting the development of modern medical treatments. Throughout history, plants have been a valuable source of healing remedies. However, no scientific attempt has been made to verify the spontaneous uses claimed in the literature. As a result, to perform more studies and collect more data, scientists need to find low-cost, simple in vitro approaches to test the efficacy of natural anti-oxidant substances. On such background, this methodology focuses on providing the three basic antioxidant assays previously utilized by the researchers to evaluate the antioxidant capacity of herbs, plants, etc. By providing these clear methodologies, young scientists and new scholars can get a brief idea of the antioxidant assays and then which can be utilized productively. Therefore, the current paper gives a detailed overview of the most important tests used to quantify antioxidant activity. Three key antioxidant assays are highlighted here: the DPPH (2,2-diphenyl-1-picrylhydrazyl- hydrate) assay, the FRAP (Ferric reducing antioxidant power) assay, and the H2O2 (Hydrogen Peroxide free radical scavenging activity assay) and dependable with minor alterations.
Introduction
Several diseases in humans are linked to the build-up of free radicals. Antioxidants can scavenge free radicals and reduce their impact [1]. As a result, the research for naturally occurring antioxidants of plant origin is critical. Several harmful pathophysiological processes, including cancer, diabetes, and cardiovascular and neurological illnesses, are strongly linked to free radical development [2, 3]. A free radical is an atomic or molecular structure with an unpaired electron that is unstable. In healthy human cells, this unstable radical has the potential to become stable through electron pairing with biological macromolecules such as proteins, lipids, and DNA, causing protein and DNA damage [2]. Because of reduced cellular antioxidant-defining systems, such radical-caused cell damage may become more common. Although all biological systems contain natural antioxidant defense mechanisms that remove damaged molecules, these strategies can be ineffective [1]. As a result, consuming antioxidants is critical for protecting cells from free radical damage. Antioxidants are chemicals that prevent and stabilize free radical damage by delivering electrons from antioxidants to damaged cells. Antioxidants also convert free radicals into waste by-products that are excreted by the body. Intake of antioxidant-rich fruits and vegetables has been shown to reduce the risk of a variety of diseases caused by free radicals [4].
The inclusion of phytochemicals such as polyphenols, carotenoids, and vitamins E and C contributes to these health advantages [5]. Although phenolic compounds are commonly found in both edible and non-edible herbs, cereals, fruits, vegetables, oils, spices, and other plant materials, scientific information on the antioxidant properties of endemic plants is limited because endemic plants are only available in certain regions and are only known by local populations. As a result, evaluating such qualities remains a fascinating and helpful endeavor, particularly in the search for promising natural antioxidant sources for functional foods and/or nutraceuticals [5].
On such background, this methodology focuses on providing the three basic antioxidant assays previously utilized by the researchers to evaluate the antioxidant capacity of herbs, plants, etc. By providing these clear methodologies, young scientists and new scholars can get a brief idea of the antioxidant assays and then which can be utilized productively. Here we discussed that there are three major antioxidant assays namely, the DPPH (2,2-diphenyl- 1-picryl-hydrazyl-hydrate) assay, FRAP (Ferric reducing antioxidant power) assay, and H2O2 (Hydrogen Peroxide free radical scavenging activity assay) assay.
Chemicals and Reagents
The following chemicals and reagents were used in this study. Methanol, 2,2-diphenyl-1-picryl-hydrazyl (DPPH) powder, Phosphate buffer (0.2M pH 6.6/ 0.2M pH 7.4), 1% Potassium ferricyanide [K3Fe (CN)6], 10% Trichloroacetic acid (TCA), Ferric chloride (FeCl3), 2mM Hydrogen peroxide (H2O2), Ascorbic acid, Distilled water, Triple distilled water
Equipment
The equipment were used: UV spectroscopy SP-UV 500DB(Faculty of Health Sciences, KIU), electronic weighing scale -DJ602A-MWP 600(Faculty of Health Sciences, KIU), refrigerator – SISIL refrigerator, water bath- ISO certified co(ASCO) (Faculty of Health Sciences, KIU), Incubator- Laboratory Instruments Inc. (Faculty of Health Sciences, KIU), vortex mixer(Faculty of Health Sciences, KIU), Thermometer B110`c/5c-GHZEAL-LTD-London-76mm/1mm(Faculty of Health Sciences, KIU), PH meter-SPER Scientific BENCHTOP METER- China(Faculty of Health Sciences, KIU), Micro pipette-JOAN LAB Model JN011793, Centrifuge 401208 Model l854/6- Remi electrotechnics Ltd- India, Fume hood.
Consumables and Glassware
The following consumables and glassware were used in the study. Glassware (stoppered flasks, measuring cylinders, volumetric flasks, cuvettes, funnels, test/khan tubes, beakers, micropipettes, watch glasses, borosilicate glass), PH papers and Filter papers (Whatman No. 1), Plain tubes, Eppendorf tubes, Centrifuge tubes, spatula, Aluminum Foil, Cotton, Pipette tips, gloves, tube holding racks, trays, centrifuge tubes, plastic pasture pipettes.
Methodology
In recent decades, there have been significant advancements in the techniques and tools utilized to assess the effectiveness of antioxidants. Initially, these methods focused on gauging antioxidant efficiency with the creation of specific oxidation products, primarily centered on lipid oxidation [6]. However, over time, diverse chemical assays, combined with highly sensitive automated detection technologies, have been employed to appraise antioxidant capabilities [7]. This encompasses specialized techniques for evaluating antioxidant performance, such as scavenging various types of free radicals or reactive oxygen species (ROS), assessing reducing power, and examining metal chelation, among others. Furthermore, the scope of oxidation substrates has broadened from merely food model systems to encompass chemical compounds, biological materials, cellular lines, and even living tissues [7].
Given the diverse array of methods available for assessing the antioxidant properties of plant extracts, this approach places particular emphasis on the DPPH, FRAP, and H2O2 assays [7]. These techniques are favored by a significant portion of the scientific community, making them widely accepted for measuring antioxidant activity. By incorporating these methods, we aim to offer the scientific community distinct advantages, especially in the realm of natural product research. The realm of herbal remedies encompasses a multitude of species, each possessing varying degrees of antioxidant potential. Consequently, it is imperative to conduct extensive studies and collect comprehensive data. To facilitate this, scientists must develop cost-effective and user-friendly in vitro methodologies to evaluate the effectiveness of natural antioxidant compounds. Within this framework, our methodology centers on in vitro antioxidant assessments, which are not only budget-friendly but also straightforward to implement, providing reliable results with minimal adjustments.
Preparation of Plant Extract
Several herbal plants were used in our earlier investigations to prepare the dilution series. Namely, Terminalia arjuna (Roxb. ex DC.) Wight & Arn., Hemidesmus indicus R. Br., and Evolvulus alsinoides (L.) L.
In our earlier research, the plant extract was prepared using the maceration procedure. For a very long time, handmade tonic formulations employed the maceration procedure. It gained acceptance as a cost-effective method of obtaining bioactive chemicals and essential oils. Maceration often involves multiple processes for small-scale extraction [8]. To ensure adequate mixing with the solvent, the plant materials—leaves, stem bark, or root bark—are first ground into tiny particles. Next, a closed tank containing the menstruum solvent is added. Here, water was utilized as the most polar solvent [9].
The liquid is then strained off, but many occluded solutions are recovered by pressing the march, which is the solid residue. Filtration is used to combine the acquired strained and press-out liquid to remove impurities. In maceration, shaking the sample sometimes increases the extraction yield by: (a) increasing diffusion; and (b) removing the concentrated solution from the sample surface to introduce fresh solvent into the menstruum [10].
To remove any obvious impurities, fresh plant components were collected and cleaned under running water. The cleaned sample was left to dry in a shed away from direct sunshine for one to two days. A mechanical blender was then used to grind the plant components. The powdered areal components were stored separately in an airtight container.
The powdered plant material was then mixed with distilled water in a 3 to 1 (volume to weight) ratio. After shaking, the container was placed in a lid-tight container for 48 hours. Filtering was then performed using three layers of muslin cloth. For 48 hours, samples were kept in a fume hood while the filter was split onto a tray and allowed to evaporate to remove any solvents. After the water had evaporated, the dried powder was scratched with a spatula. Finally, amber- colored vials were used to keep the aqueous plant powder dry until future use [11].
In 1 mL of distilled water, one gram of the powdered aqueous plant extract was dissolved. A two-fold dilution series was created using 1 mL of the initial concentration, which is an unadulterated extract that served as the highest concentration point in the dilution series. The dilution series was established using a two-fold dilution method, where each subsequent concentration was half of the previous concentration. This process was repeated for a total of 10 points, resulting in a range of different concentrations of the aqueous plant extract concentration ranging from 1g mL-1 to 2×10⁻³ g mL-1 concentration. Then, the prepared solution was taken into the respective test tubes and conducted the assay.
DPPH (2,2-Diphenyl-1-Picryl-Hydrazyl- Hydrate) Assay
A popular technique for evaluating the capacity of antioxidants to scavenge free radicals is the DPPH assay. In this test, a stable free radical (DPPH) is combined with the plant extract, and the amount of color change is measured. A greater amount of discoloration denotes greater antioxidant activity [12].
Principle: The extracts’ ability to scavenge free radicals was assessed using the DPPH radical scavenging assay, as described by Blois and Desmarchelier [13, 14]. The ability of plant extractives to donate hydrogen atoms was tested by decolorizing a methanol solution of 2,2-diphenyl-1- picrylhydrazyl (DPPH). In the presence of antioxidants, DPPH generates a violet/purple color in methanol solution and diminishes to shades of yellow [15].
Chemicals and reagents
- DPPH solution (2,2-diphenyl-1-picryl-hydrazyl-hydrate)
- Methanol
- Ascorbic acid
- Distilled water Method
- 6×10⁻⁵M of DPPH in methanol was prepared [7.89mg for 100ml, for 250ml= (7.89/100) ×250].
- 500µl of each sample solution was transferred into an Eppendorf tube.
- Each concentration was tested in triplicate.
- 500µl of DPPH solution was transferred and mixed with the sample solution.
- This was shaken and stood at room temperature for 30 minutes.
- Absorbance was measured at 520nm.
- Ascorbic acid was used as the positive control and distilled water was used as the negative control.
- Percentage inhibition compared to the standard was calculated using the bellow equation and IC50 values were calculated using GraphPad Prism 9 software [13, 16].
Analysis: For data analysis in a statistical way, you have to calculate the actual absorbance of the plant material. To find out the actual absorbance of the plant material you have to subtract blank plant absorbance (which means, after you prepared the dilution series, you have to read the plant material color intensity absorbance spectrophotometrically) from the assay absorbance of the plant. As an example, after you preparation of the plant dilution, it has a color and after measuring of color intensity using a spectrophotometer it reveals absorbance = A (Blank plant) when considering the assay, the DPPH assay absorbance showed =B, in that case, actual absorbance of the assay = B-A.
Actual absorbance= Assay absorbance – Blank absorbance After that, you have to calculate the % inhibition values. To do that you can use the bellow equation.
% Inhibition=
( ) Blank DPPH solution absorbance– Actual absorbance X 100% Blank DPPH solution absorbance To find out the Blank DPPH solution absorbance, after preparation of the DPPH solution, you can measure its absorbance spectrophotometrically.
By repeating this process for positive and negative controls, you have to plot a log-concentration time graph and the IC50 has to be detected using a nonlinear regression model using GraphPad Prism software. Then by comparing the assay results with controls, you can interpret the data findings.
FRAP (Ferric Reducing Antioxidant Power) Assay
Antioxidants’ capacity to convert ferric ions into ferrous ions is assessed using the FRAP assay. By measuring the reduction potential, this assay can estimate a sample’s antioxidant capacity. An increase in reduction potential corresponds to an increase in antioxidant activity [7].
Principle: The FRAP assay is based on the rapid reduction of ferric-tripyridyltriazine (Fe3-TPTZ) in samples by antioxidants, resulting in ferrous-tripyridyltriazine (Fe2- TPTZ), a blue-colored product [17]. By adding the FRAP reagent to a range of known concentrations of Fe2+ solutions, a standard curve was produced, allowing the Fe2+ concentration of the samples to be determined and thereby indicating “antioxidant capacity.” The FRAP approach was inspired by Benzie and Strain’s work [17].
The assay is used for the measurement of the antioxidant potential of various samples. FRAP assay does this, by reducing the ferric ions to ferrous ions through antioxidants present in the samples. Once the ferric iron is reduced, a blue color is developed which is read colorimetrically. Determination of the antioxidant potential of samples is done using a ferrous iron standard curve. Results are expressed as fe2 + equivalents which are in μm or FRAP value [18].
Chemicals and reagents
- 0.2 M, PH 6.6 phosphate buffer
- Potassium ferricyanide (K3Fe(CN)6)
- 10% Trichloroacetic acid
- Distilled water
- 0.1% Fecl3
- Ascorbic acid Method
- It’s recommended to use only fresh samples for the most accurate and reproducible assay. The extractions from plants can be done using various solvents like aqueous, methanol, ethanol, or acetone. The extraction method depends on the type of specific sample being extracted.
- The dilution series was made using plant materials.
- Phosphate buffer 2.5 ml (0.2 M, pH 6.6) was added to all the tubes.
- The contents in each tube were thoroughly mixed.
- Then, 2.5 ml of 1 % potassium ferricyanide K3F(CN)6 solution was added to all the samples.
- After this, each reaction mixture was vortexed well using a vortex shaker.
- The samples were incubated at 50°C for around 20 minutes.
- Once the incubation time was over, 2.5 ml of 10 % trichloroacetic acid (TCA) was added to each sample.
- The test tubes were centrifuged at 3,000 rpm for 10 minutes. From these centrifuged samples, 2.5 ml supernatant was collected in separate test tubes.
- After this, in the same new separate test tubes, 0.5 ml of ferric chloride (FeCl3) was added.
- This gave us a bluish color formation.
- And then the absorbance was measured at 700nm.
- A sample having more concentration was shown higher absorbance and the opposite is true.
- Ascorbic acid was used as the positive control and distilled water was used as the negative control. The assay was triplicated.
- Then, the normalized percentage of antioxidant activity and IC50 values were calculated using GraphPad Prism 9 software [17, 18].
Analysis: According to your assay absorbance, you have to calculate the normalized percentage of antioxidant activity for tests and controls. And you have to plot the log- concentration time graph and the IC50 has to be detected using a nonlinear regression model using GraphPad Prism software. Then by comparing the assay results with controls, you can interpret the data findings.
H2O2 (Hydrogen Peroxide) Free Radical Scavenging Activity Assay
The H2O2 assay evaluates the ability of the plant extract to scavenge hydrogen peroxide, which is a harmful reactive oxygen species. Hydrogen peroxide can cause oxidative damage to cells and tissues. The assay measures the reduction in hydrogen peroxide concentration after exposure to the plant extract, indicating its antioxidant potential [19].
Principle: The scavenging activity of natural antioxidants found in plant extracts against hydrogen peroxide (H2O2) has been widely tested by detecting the decrement of H2O2 in an incubation system containing H2O2 and the scavenger using the classical UV method at 230 nm [20].
Chemicals and reagents
- Phosphate buffer (0.2M, PH 7.4)
- Hydrogen peroxide (H2O2)
- Ascorbic acid
- Distilled water Method
- The dilution series was made using plant extract powder.
- Then, 600 μL of H2O2 was added to the tubes (Control, sample, standard).
- 100 μl of plant extract or standards (Ascorbic acid) was added into respective test tubes.
- After that, the volume was made up to 4 mL with phosphate buffer (pH 7.4) in all test tubes.
- The identical Ascorbic acid series without sample served as the standard (phosphate buffer, H2O2, and Ascorbic acid).
- All the test tubes were incubated for 10 min at room temperature.
- The absorbance of the H2O2 solution was measured at 300 nm against the blank.
- H2O2 scavenging activity percentage and IC50 were calculated compared to the standard by the bellow Formula, Scavenging activity %= ( ) Absorbance of Control - Absorbance of Sample X 100% Absorbance of Control Before applying the formula, the absorbance of H2O2 alone must be subtracted from the control, sample, and standard [21].
Analysis: For data analysis in a statistical way, you have to calculate the actual absorbance of the plant material. To find out the actual absorbance of the plant material you have to subtract blank plant absorbance (which means, after you prepared the dilution series, you have to read the plant material color intensity absorbance spectrophotometrically) from the assay absorbance of the plant. As an example, after you preparation of the plant dilution, it has a color and after measuring of color intensity using a spectrophotometer it reveals absorbance = A (Blank plant) when considering the assay, for the highest concentration of the plant series, the H2O2 assay absorbance showed =B, in that case, actual absorbance of the assay = B-A.
( ) Actual absorbance Absorbance of the sample =
Assay absorbance – Blank plant absorbance After that, you have to calculate the Scavenging activity % values. To do that you can use the bellow equation.
Scavenging activity %=
( ) Absorbance of Control - Absorbance of Sample X 100% Absorbance of Control By repeating this process for positive and negative controls, you have to plot a log-concentration time graph and the IC50 has to be detected using a nonlinear regression model using GraphPad Prism software. Then by comparing the assay results with controls, you can interpret the data findings.
Observations
The antioxidant activity of several plant extracts was previously investigated using the FRAP, H2O2, and DPPH assays, which were reported here with ascorbic acid serving as the positive control. Figure 1-3 depicted the activity of various aqueous plant extracts in comparison to the positive control ascorbic acid. plants “A”, “B”, and “C” were all included. We can get an idea of the anti-oxidant potential of aqueous plant extracts of plants A, B, and C by looking at the diagram below. This graph depicts data transfer in plants A, B, and C with the positive control of ascorbic acid. By comparing these data transformations, one can quickly get an understanding of anti-oxidant activity by comparing them to the standard.
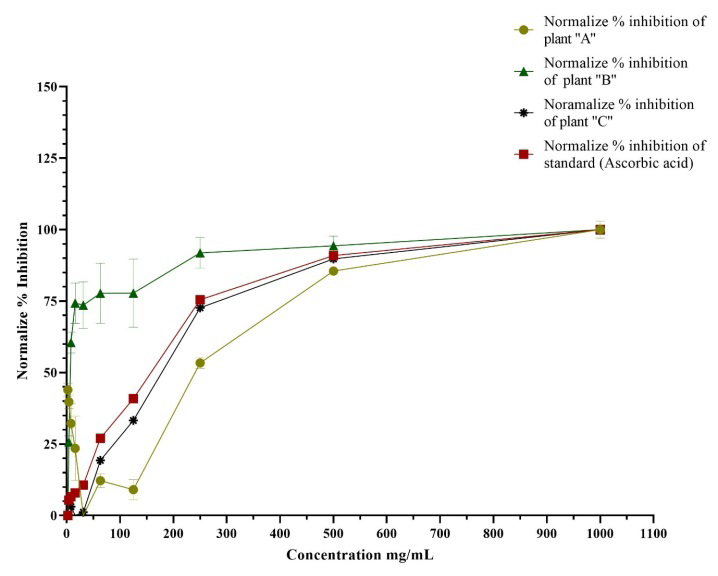
Figure 1: This graph presents the results of a DPPH antioxidant activity assay, depicting the performance of aqueous plant extracts from plants A, B, and C, in addition to the reference medication ascorbic acid. The graph displays the concentration (mg/mL) versus normalized percentage inhibition activities for each of the plants, providing a comprehensive view of the antioxidative potential of plant A, plant B, plant C, and ascorbic acid in the context of this assay. plant A= yellow color, plant B = green color, plant C = black color, standard/ascorbic acid = red color.
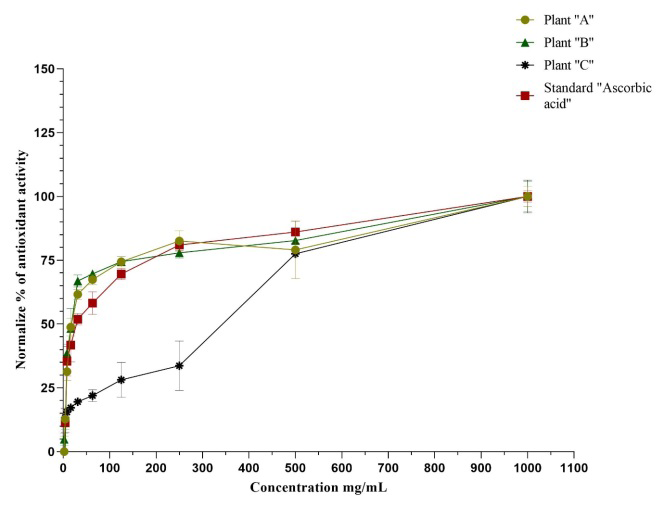
Figure 2: This graph presents the results of a FRAP antioxidant activity assay, depicting the performance of aqueous plant extracts from plants A, B, and C, in addition to the reference medication ascorbic acid. The graph displays the concentration (mg/mL) versus the normalized percentage of antioxidant activities for each of the plants, providing a comprehensive view of the antioxidative potential. In this graph, plant A is represented by the yellow color, plant B by the green color, and plant C by the black color. The standard reference medication, ascorbic acid, is indicated by the red color.
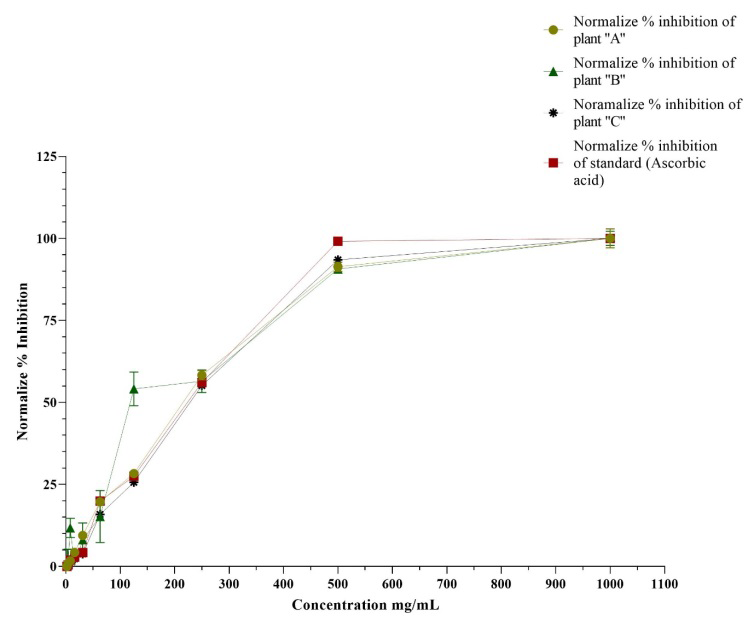
Figure 3: The graph illustrates the outcomes of an H2O2 antioxidant activity assay, showcasing the comparative efficacy of aqueous plant extracts from plants A, B, and C, along with the reference medication ascorbic acid. The graph maps the relationship between concentration (mg/mL) and normalized percentage inhibition for each plant, offering a holistic perspective on their antioxidative capabilities. plant A is denoted by the yellow color, plant B by the green color, and plant C by the black color. The standard reference medication, ascorbic acid, is represented in red.
Conclusion
Several diseases in humans are linked to the build- up of free radicals. Antioxidants can scavenge free radicals and reduce their impact. As a result, the research for naturally occurring antioxidants of plant origin is critical. Several harmful pathophysiological processes, including cancer, diabetes, and cardiovascular and neurological illnesses, are strongly linked to free radical development. Thus, investigating and examining natural plants can lead to the discovery of novel bioactive compounds that have the potential to have substantial anti-oxidant effects. The inspiration offered by natural flora has greatly aided the development of innovative medications. Therefore, to do more studies and gather more data, scientists must require straightforward, affordable in vitro methods to assess the effectiveness of natural antioxidant compounds. On such background, this methodology focuses on delivering the three basic antioxidant assays previously used by researchers to assess the antioxidant capacity of herbs, plants, and other natural products. By providing these straightforward methods, novice researchers and scientists can learn the fundamentals of antioxidant assays and subsequently apply them effectively. The DPPH (2,2-diphenyl-1-picryl-hydrazyl- hydrate) assay, the FRAP (Ferric reducing antioxidant power) assay, and the H2O2 (Hydrogen Peroxide free radsical scavenging activity assay) assay are the three major antioxidant assays covered here.
References
-
Lobo V, Patil A, Phatak A, Chandra N (2010) Free Radicals, Antioxidants and Functional Foods: Impact on Human Health. Pharmacognosy Reviews 4(8): 118-126.
-
Gilgun-Sherki Y, Rosenbaum Z, Melamed E, Offen D (2002) Antioxidant Therapy in Acute Central Nervous System Injury: Current State. Pharmacological Reviews 54(2): 271-284.
-
Islam S, Nasrin S, Khan MA, Hossain ASMS, Islam F, et al. (2013) Evaluation of antioxidant and anticancer properties of the seed extracts of Syzygium fruticosum Roxb. growing in Rajshahi, Bangladesh. BMC Complementary and Alternative Medicine 13: 1-10.
-
Hamid K, Urmi KF, Saha MR, Abu AH, Rahman MM (2011) Screening of different parts of the plant Pandanus odorus for its cytotoxic and antimicrobial activity Journal of Pharmaceutical Sciences and Research 3(1): 1025-1028.
-
Lourenço SC, Moldão-Martins M, Alves VD (2019) Antioxidants of natural plant origins: From sources to food industry applications. Molecules 24(22): 14-16.
-
Abeyrathne EDNS, Nam K, Ahn DU (2021) Analytical methods for lipid oxidation and antioxidant capacity in food systems. Antioxidants 10(10): 1587.
-
Munteanu IG, Apetrei C (2021) Analytical methods used in determining antioxidant activity: A review. International Journal of Molecular Sciences 22(7): 3380.
-
Abubakar AR, Haque M (2020) Preparation of medicinal plants: Basic extraction and fractionation procedures for experimental purposes. Journal of Pharmacy and Bioallied Sciences 12(1): 1-10.
-
Ingle KP, Deshmukh AG, Padole DA, Dudhare MS, Moharil MP, et al. (2017) Phytochemicals: Extraction methods, identification and detection of bioactive compounds from plant extracts. Journal of Pharmacognosy and Phytochemistry 6(1): 32-36.
-
Azmir J, Zaidul ISM, Rahman MM, Sharif KM, Mohamed A, et al. (2013) Techniques for extraction of bioactive compounds from plant materials: A review. Journal of Food Engineering 117(4): 426-436.
-
Pandey A, Tripathi S (2014) Concept of standardization, extraction and pre phytochemical screening strategies for herbal drug. Journal of Pharmacognosy and Phytochemistry 2(5): 115-119.
-
Baliyan S, Mukherjee R, Priyadarshini A, Vibhuti A, Gupta A, et al. (2022) Determination of Antioxidants by DPPH Radical Scavenging Activity and Quantitative Phytochemical Analysis of Ficus religiosa. Molecules 27(4): 1326.
-
Blois MS (1958) Antioxidant determinations by the use of a stable free radical. Nature 181(4617): 1199-1200.
-
Desmarchelier C, Bermudez MJN, Coussio J, Ciccia G, Boveris A (1997) Antioxidant and prooxidant activities in aqueous extracts of Argentine plants. International Journal of Pharmacognosy 35(2): 116-120.
-
Rahman MM, Islam MB, Biswas M, Alam AHMK (2015) In vitro antioxidant and free radical scavenging activity of different parts of Tabebuia pallida growing in Bangladesh. BMC Research Notes 8(1): 1-9.
-
Karan SK, Mishra SK, Pal D, Mondal A (2012) Isolation of β -sitosterol and evaluation of antidiabetic activity of Aristolochia indica in alloxan-induced diabetic mice with a reference to in-vitro antioxidant activity.
-
Benzie IFF, Strain JJ (1996) The Ferric Reducing Ability of Plasma (FRAP) as a measure of “Antioxidant Power”: The FRAP assay. Analytical Biochemistry 239(1): 70-76.
-
Kurniawati P, Maulida IR, Muhaimin (2017) The determination of antioxidant activity of Brazil-cherry (Eugenia uniflora L.) leaves extract using FRAP method. AIP Conference Proceedings 1911(1).
-
Mandal N, Mandal S, Hazra B, Sarkar R, Biswas S (2011) Assessment of the antioxidant and reactive oxygen species scavenging activity of methanolic extract of caesalpinia crista leaf. Evidence-Based Complementary and Alternative Medicine.
-
Fernando CD, Soysa P (2015) Optimized enzymatic colorimetric assay for determination of hydrogen peroxide (H2O2) scavenging activity of plant extracts. MethodsX 2: 283-291.
-
Ahmed F, Rahman MS (2016) Preliminary assessment of free radical scavenging, thrombolytic and membrane stabilizing capabilities of organic fractions of Callistemon citrinus (Curtis.) skeels leaves. BMC Complementary and Alternative Medicine 16(247).
- Management of Ear Keloid with Ksharsutra: A Case Study
- Yoga and Global Sustainability: A Holistic Path to One Earth, One Health
- Autoimmune Diseases in Ayurveda: A Narrative Review with Classical and Modern Perspectives
- Management of Cluster Headache Associated with Pituitary Apophysitis by CERT (Chakrasiddh Energy Release Technique): A Case Report on Energy Rebalancing
- Zygophyllum Geslini Coss : Biochemicals and Antioxidant Activity
- Observations of a Beginner Vaidya