Factors Affecting Mortality Risk of Patients Due to COVID-19 Outbreak: A Case Study
Human societies are dealing with infectious diseases for centuries. The consequences of this infectious disease outbreak are multifaceted. Apart from socio-economic disruption, the outbreak also causes thousands of humans’ lives. The recent COVID-19 is the deadliest of this century’s outbreak already causes hundreds of thousands of lives all over the world. Several studies have been conducted to identify the virus’s nature, its severity compared to other flu viruses and methods of spread. However, there has been no study that emphasizes the quantitative analysis of mortality risk of patients considering different clinical and social circumstances which are also known as factors. In this case study, real-life mortality data have been analyzed and the severity effect of different factors on mortality due to COVID-19 has been categorized. Considering all factors simultaneously, a method to estimate the mortality risk index of patients is also presented. The estimated mortality risk index results show how different combinations of factors have influenced the mortality chances of patients differently.
Introduction
In the last few decades, several infectious diseases threaten as a pandemic outbreak such as SARS-CoV (severe acute respiratory syndrome), MERS-CoV (Middle East respiratory syndrome), Ebola, Swine flu (H1N1), and recently SARS-CoV-2 or COVID-19 (also known as coronavirus). Thousands of people from different nations have lost their lives during the pandemic outbreak, especially with the contagious one. The coronavirus family which belongs to the contagious disease category was first determined that it infected the human body in 1965 named 229E [1]. The OC43, SARS-CoV, HCoV NL63, HKU1, MERS-CoV and SARS-CoV-2 or COVID-19 is among the coronaviruses that also infect the human body [2, 3]. The SARS-CoV is the first most famous coronavirus family that was found in 2003 which caused
774 deaths around the world [4]. In 2012, MERS-CoV as the second well-known coronaviruses family caused the death of 842 people [5].
By December 2019, in Wuhan, China, a new virus, like SARS-CoV was identified and quickly spread throughout the world [6, 7]. This new virus has been called SARA-CoV-2 or COVID-19. In terms of the magnitude of infected people with human mortality, the COVID-19 is surplus all its previous outbreak in this century. Both the number of infected people and countries are highly escalated in the COVID-19 outbreak. This increasing number of infected people could be explained due to the uprising of the international supply chain, increasing the number of international travels, mass urbanization, and the unjudicial use of natural resources [8]. To take control and prepare for the future and further outbreak, it is very important to understand the nature of the COVID-19 outbreak and different influential factors that affect the disease.
In any pandemic outbreak, there is a widespread consequence including the social, political, and economical disruption, and most of all, the losses of human lives [9]. However, the disease may infect people in terms of mortality differently; for example Gagnon, et al. [10] argued the high rate of young adult mortality rate during the 1918’s Spanish flu pandemic. Therefore, it requires a thorough analysis of different factors that affect the most during a pandemic towards human mortality [11]. These factors could be patient’s age, gender, blood types, white blood cell count, and other clinical parameters [12].
In this work, real-life data has been analyzed and investigated to identify the factors that are associated with human mortality due to COVID-19. A systematic statistical analysis shows which group of people is the most vulnerable during this pandemic outbreak based on different influential factors such as age group, gender, blood types, living condition, working area, and medical precondition. For this case study, 366 patients who died due to COVID-19 have been analyzed. Then, the relationships among these factors are considered altogether. After that, by given data and the obtained association between these factors, the most hazardous factors are identified and scored. By a novel formula, the mortality risk index of each group of people has been estimated.
It is believed that this case study result could significantly help the current body of knowledge to understand the most important factors that affect human mortality related to COVID-19 and help to reduce the mortality rate with proper precautions. The rest of the paper is organized as follows. Section 2 describes the motivation of this case study. In section 3, the statistical analysis of factors is presented in detail. Section 4 provides the estimation of mortality risk index considering all factors associated with the patient’s mortality. Finally, Section 5 concludes the work with future research direction.
Case Study
The COVID-19 outbreak data of Iran has been used in this research as a case study. Based on the World Health Organization (WHO), until the 25th of March, 2020, Iran is the sixth top country in terms of the number of people found COVID-19 positive with more than 27000 cases, and the fourth country in terms of the number of people died due to COVID-19 with more than 2000 people. The known death rate is 7.7% which is very high compared to other countries and regular flu death rates [13].
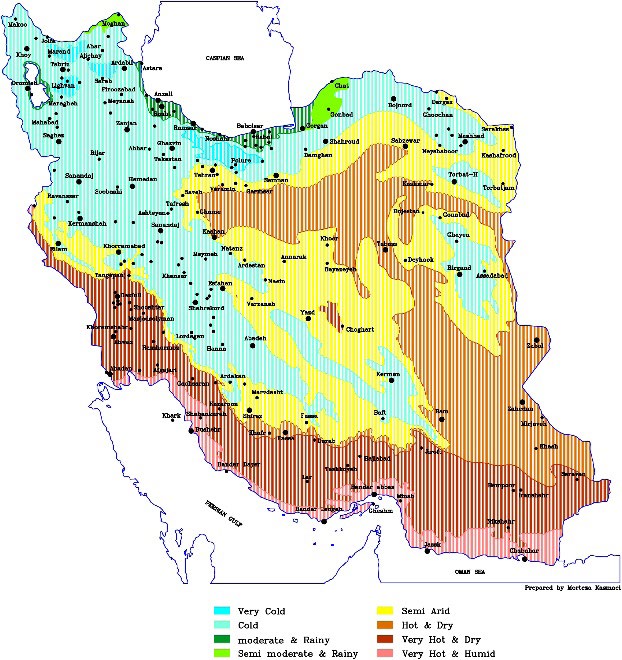
Based on Iran Statistics Center, Iran is a country of 1648195 km2 area with 31 main provinces having a total of 83 million populations. The climate of Iran varies based on the provincial area which can be divided into several climate zones [14]. Figure 1 shows the schematic diagram of Iran’s different climate zones.
The COVID-19 outbreak in Iran began in Qom province and widespread in other populated cities such as Tehran and Esfahan. The number of patients who were infected and died due to the COVID-19 has been collected from different provincial hospitals with the help of health care professionals. Besides the number of infection and died due to COVID-19, several other clinical information such as patient’s gender, occupation, blood type, previous illness/health condition are also gathered during the data collection. In this study, 400 patients who died due to COVID-19 have been considered and after a thorough screening, only 366 patients with full and correct information have been qualified as final datasets.
Quantitative Analysis of COVID-19 Mortality Data
The mortality data collected in the previous section has been analyzed to understand the factors affecting the increasing mortality rate due to COVID-19. There are a total of six factors considered in this analysis and these are the patient’s gender, age, climate zone they live, health pre- condition, occupations, and blood group types. The severity effect of these factors has been characterized by letters A to D. Severity character A indicates the most severe effect, character B indicates severe effect, character C indicates moderate effect, and character D indicates the least severe effect of the factors (Tables 1-10).
| Gender | Frequency (Number) | Percentage (%) | Severity Character |
|---|---|---|---|
| Male | 231 | 63.11 | A |
| Female | 135 | 36.89 | B |
Table 1: Total mortalities by the gender factor.
Table 1 lists the number of mortalities due to COVID-19 based on the gender factor for both in terms of total frequency and percentage. The results indicate the higher mortality rate of the male population. Therefore, the severity effect for male is higher and characterized by letter A.
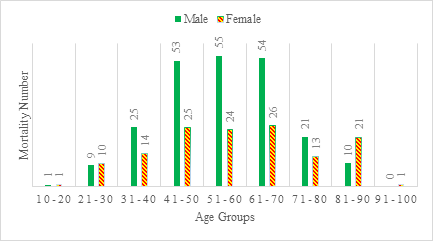
To understand the patient’s age factor effect on the mortality rate, the patient’s age has been divided into groups of a 10-year interval from 10 to 100 years. Table 1 lists the mortality frequency and percentage based on the different age groups of patients. Based on age groups, it is understood that people in the age range of 41-70 years are the most vulnerable in terms of mortality chances and they are labelled as severity character A. Figure 2 demonstrates the mortality number of males and females according to their age groups.
| Age (Years) | Frequency (Number) | Percentage (%) | Severity Character |
|---|---|---|---|
| 20-10 | 2 | 0.55 | D |
| 21-30 | 19 | 5.19 | C |
| 31-40 | 39 | 10.65 | B |
| 41-50 | 78 | 21.31 | A |
| 51-60 | 79 | 21.58 | A |
| 61-70 | 80 | 21.85 | A |
| 71-80 | 34 | 9.29 | B |
| 81-90 | 31 | 8.47 | B |
| 91-100 | 1 | 0.27 | D |
Table 2: Mortality based on age Groups.
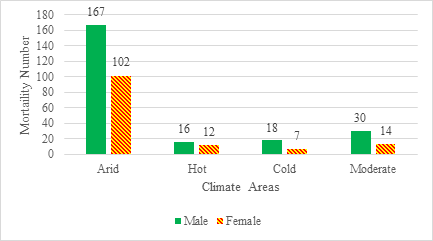
As illustrated in Figure 1, Iran has eight climate zones. The climate zones are very cold, cold, moderate and rainy, semi moderate and rainy, semi-arid, hot and dry, very hot and dry, and very hot and humid. To efficiently collect the data and to understand this study better, eight climate zones have been reconstructed into four climate areas: Arid, Hot, Cold, and Moderate climate areas. Table 3 shows the total number of mortalities in each climate area.
| Climate Area | Frequency (Number) | Percentage (%) | Severity Character |
|---|---|---|---|
| Arid | 269 | 73.49 | A |
| Hot | 28 | 7.65 | C |
| Cold | 25 | 6.83 | C |
| Moderate | 44 | 12.02 | B |
Table 3: Mortality based on different climate areas.
Table 3 demonstrates that by far the most deaths are in the arid climate area. One of the possible explanations could be the most populated cities are located in this climate area. Also, the first outbreak of COVID-19 was initiated from the arid climate area. As a result, severity character A has been given to the arid climate area and severity character B is given to the moderate area. A few numbers of deaths were reported in hot and cold areas; so, severity character C would be used for these groups. In Fig. 3, the number of deaths in each climate area based on gender is shown.
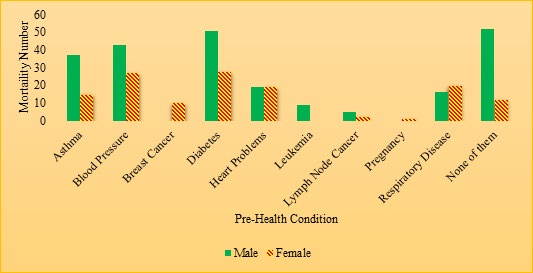
The patient’s previous illness or pre-health condition is one of the most important factors that can also influence the mortality chances due to this contagious disease. By collecting the information from these 366 patients, nine pre- health conditions were reported in this study. Table 4 shows the mortality based on pre-health conditions.
| Pre-Health Condition | Frequency (Number) | Percentage (%) | Severity Character |
|---|---|---|---|
| Asthma | 52 | 14.2 | B |
| Blood Pressure | 70 | 19.13 | A |
| Breast Cancer | 10 | 2.73 | D |
| Diabetes | 79 | 21.56 | A |
| Heart Problems | 38 | 10.38 | B |
| Leukemia | 9 | 2.46 | D |
| Lymph Node Cancer | 7 | 1.91 | D |
| Pregnancy | 1 | 0.27 | D |
| Respiratory Disease | 36 | 9.83 | C |
| None of them | 64 | 17.49 | B |
Table 4: Mortality based on pre-health conditions.
From Table 4, it is clearly understood that COVID-19 patients having diabetes or blood pressure related pre- health conditions could accelerate the mortality rate and for these two-pre-health conditions, severity is given by letter A. Then, asthma, heart problems, and no pre-health condition are leveled by severity character B. Respiratory-related pre- health condition is demonstrated by character C. Finally, a few patients in this research had breast cancer, leukemia, lymph node cancer, and pregnancy; so, character D is given to them. Figure 4 also shows the mortality of patients having the pre-health condition based on gender.
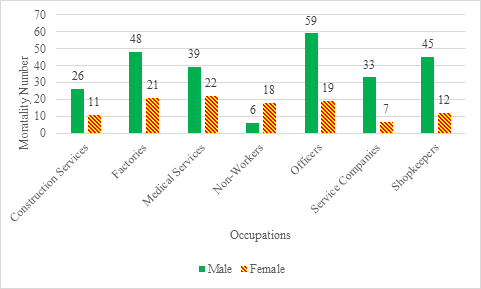
The patient’s occupation is another important factor that could influence the mortality rate due to this COVID-19. As a contagious viral disease, the spread of this disease is directly related to the patient’s occupation and work-related hygiene. In this study, occupations have been divided into seven categories.
Table 5 shows the number of fatalities based on the patient’s occupation.
| Occupation | Frequency (Number) | Percentage (%) | Severity Character |
|---|---|---|---|
| Construction Services | 37 | 10.11 | C |
| Factories | 69 | 18.85 | B |
| Medical Services | 61 | 16.67 | B |
| Non-Workers | 24 | 6.56 | D |
| Office Workers | 78 | 21.31 | A |
| Service Companies | 40 | 10.93 | C |
| Shopkeepers | 57 | 15.57 | B |
Table 5: Mortalities by occupation types.
Offices are the most infected places in this study that alone causes around 21% of total death. The severity character A is used to describe this occupation’s severity. Factories, medical services, and shopkeepers are given the severity character B.
Based on Figure 5, it is understood that for all occupations, female has less mortality rate. One of the possible reasons could be that the female working number is less than the male population. This indicates that less interaction with other people that is social distancing could reduce both the infection and mortality rate of patients. Men who work in offices, factories, and shops have influenced more than other occupations. Also, offices, medical services, and factories are the most dangerous areas for female employees.
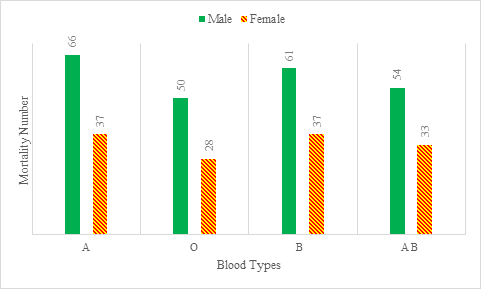
In this case study, the type of patient’s blood is also studied to find the association with the mortalities due to COVID-19. Table 6 lists the number of patient’s blood types who lost their lives due to COVID-19.
| Blood Type | Frequency (Number) | Percentage (%) | Severity Character |
|---|---|---|---|
| A | 103 | 28.14 | A |
| O | 78 | 21.31 | C |
| B | 98 | 26.78 | A |
| AB | 87 | 23.77 | B |
Table 6: Mortalities based on blood types.
Figure 6 shows the mortalities for each blood type and gender. It is found that patients with blood type A have the highest risk for both males and females, while, blood type O has the lowest one among others in this study.
Risk Mortality Estimation
In this section, it is demonstrated that the estimation of patient’s mortality risk index utilizes the factors analyzed from the previous section. To formulate the estimation equation, all factors are included, and the range of each factor should be determined. Equation (1) provides the goal function of the estimation and Equations (2-4) are the constraints [15, 16].
( ) 1 n S K U X E i i i = ∑= (1)
0 1 i K < < (2)
1 n ≥ (3) i i K = ∑ (4)
1 n Where S represents the mortality risk index, K is the weightage percentage of the factor, U represents the score of factor severity level, E is a condition variable that reflects the connection of patients with other people, and i represent the number of factors.
In the previous section, factor severity level is characterized by letter A to D where A indicates the most severe and D indicates the least severe effect of factors. Table 7 shows the quantitative score of each severity character. These scores of severity character are based on expert opinions.
| Character | Score (U) |
|---|---|
| A | 4 |
| B | 3 |
| C | 2 |
| D | 1 |
Table 8: Factor severity character scores.
| Factors | Weightage Probability (K) |
|---|---|
| Blood Type | 10% |
| Gender | 5% |
| Age | 25% |
| Climate Area | 10% |
| Pre-health Condition | 30% |
| Occupation | 20% |
Table 7: Factor weightage probability.
Then, a weightage percentage is assigned to each factor. This weightage percentage is based on the factors’ influence on the severity of the mortality of patient. Based on the experience, the expert decision-makers evaluate the factor severity level and allocate the weightage percentage. Table 8 tabulates the weightage percentage of each factor for this case study.
Equation (1) can be extended for this case study using six factors and can be rewritten in Equation (5) as follows ( ) ( ) ( ) ( ) ( ) ( ) * * * * * * * S K U K U K U K U K U K U E oc oc BL BL DI DI GE GE AG AG AR AR = + + + + + (5) where suffix BL represents blood type, GE represents gender, AG represents age, AR represents climate area, DI represents pre-health conditions, and OC represents occupation.
Now it is considered that if a person has no job, then the person could have a chance to control the socialization with other people. In this situation, the following cases are considered: If , U D oc = and If connect with a few people then E=1, If , U D oc = and If connect with moderate number of people then E=1.5, If , U D oc = and If connect with high number of people then E=2, If , U D oc = then E=1.
| Age | Gender | Blood | Pre-Health Condition | Occupation | Climate Area | Number Of Deaths | Mortality Risk Index (S) |
|---|---|---|---|---|---|---|---|
| A | A | A | A | A | A | 9 | 4 |
| D | A | B | D | C | B | 1 | 1.75 |
Table 9: Mortality estimation based on scenarios.
However, in this case study, all the patients have died and as their rates of relationships or connections are unknown, E = 1 is assumed for them. Table 9 demonstrates the highest and lowest risk of patient’s mortality for this case study.
The higher number of mortality risk index (S) indicates the higher chances of mortality. It is clear that a man in his 41st to 70th year of age with blood type of A or B, and with blood pressure or diabetes disease, who is working in an office in an arid climate zone, has more probability of death with COVID-19 based on this research. This study could have enumerated 1152 different scenarios of mortality risk index considering different factor combinations of each patient.
If track and trace is possible, the rates of relationships or connections are known. For instance, if a person who has no job with different types of connections, by considering the same scenario, the estimated mortality risk index is listed in Table 10. It clearly shows the importance of social distancing with the amount of influence on the number of mortalities by considering the same factors.
| Age | Gender | Blood | Pre-Health Condition | Occupation | Area | Connection Rate (E) | Mortality Risk Index (S) |
|---|---|---|---|---|---|---|---|
| A | A | A | A | D | A | 1 | 3.4 |
| A | A | A | A | D | A | 1.5 | 5.1 |
| A | A | A | A | D | A | 2 | 6.8 |
Table 10: It clearly shows the importance of social distancing with the amount of influence on the number of mortalities by consid
Conclusion
The coronavirus has so far killed almost a million of people around the world. Extensive studies have been done on the causes of these diseases and new strategies are being given every day to prevent the spread of the disease. However, there have been no studies on the risk mortalities of patients considering different clinical and social factors. This study investigates the most important factors that have influenced the death of COVID-19 patients. Also, it analyzes the effect of each factor and ultimately assesses the mortality risk index according to different possible scenarios. Other studies have identified the issue of social distancing as an effective way to deal with the disease. The findings of this study also echoing the importance of social distancing.
This study can be used to estimate the patient’s risk assessment for allocating medical resources. The model and results of the study can easily be applied in other countries and regions. In future research, more complex information can be extracted by increasing the number of influencing factors as well as collecting more samples and mortality data. Multiple countries’ mortality data analysis could provide more insight into the severity of the disease under different socio-economic conditions.
References
-
Kahn JS, McIntosh K (2005) History and recent advances in coronavirus discovery. The Pediatric infectious disease journal 24(11): S223-S227.
-
Geller C, Varbanov M, Duval RE (2012) Human coronaviruses: insights into environmental resistance and its influence on the development of new antiseptic strategies. Viruses 4(11): 3044-3068.
-
Velavan TP, Meyer CG (2020) The COVID‐19 epidemic. Tropical medicine & international health 25(3): 278-
-
Wong G, Liu W, Liu Y, Zhou B, Bi Y, et al. (2015) MERS, SARS, and Ebola: the role of super-spreaders in infectious disease. Cell host & microbe 18(4): 398-401.
-
Donnelly CA, Malik MR, Elkholy A, Cauchemez S, Van Kerkhove (2019) Worldwide reduction in MERS cases and deaths since 2016. Emerging infectious diseases 25(9): 1758.
-
Boldog P, Tekeli T, Vizi Z, Dénes A, Bartha FA, et al. (2020) Risk assessment of novel coronavirus COVID-19 outbreaks outside China. Journal of clinical medicine 9(2): 571.
-
Lu R, Zhao X, Li J, Niu P, Yang B, et al. (2020) Genomic characterisation and epidemiology of 2019 novel coronavirus: implications for virus origins and receptor binding. The Lancet 395(10224): 565-574.
-
Jones KE, Patel NG, Levy MA, Storeygard A, Balk D, et al. (2008) Global Trends in Emerging Infectious Diseases. Nature 451(7181): 990-993.
-
Jamison DT, Gelband H, Horton S, Jha P, Laxminarayan R, et al. (2017) Disease Control Priorities. In: 3rd (Edn.), Improving Health and Reducing Poverty: The World Bank 9.
-
Gagnon A, Miller MS, Hallman SA, Bourbeau R, Herring DA, et al. (2013) Age-specific mortality during the 1918 influenza pandemic: unravelling the mystery of high young adult mortality. PLoS One 8(8): e69586.
-
Summers JA, Wilson N, Baker MG, Shanks GD (2010) Mortality risk factors for pandemic influenza on New Zealand troop ship, 1918. Emerging infectious diseases 16(12): 1931-1937.
-
Chan JFW, Yuan S, Kok KH, To KK, Chu H, et al. (2020) A familial cluster of pneumonia associated with the 2019 novel coronavirus indicating person-to-person transmission: a study of a family cluster. The Lancet 395(10223): 514-523.
-
Jouzdani J (2020) Fight against COVID-19: A global outbreak response management performance view. Journal of project management 5(3): 1-15.
-
Sharifi E, Steinacker R, Saghafian B (2016) Assessment of GPM-IMERG and other precipitation products against gauge data under different topographic and climatic conditions in Iran: Preliminary results. Remote Sensing 8(2): 135.
-
Karevan A, Vasili M (2018) Sustainable reliability centered maintenance optimization considering risk attitude. Journal of Applied Research on Industrial Engineering 5(3): 205-222.
-
Karevan A, Tee KF, Vasili M (2020) A reliability-based and sustainability-informed maintenance optimization considering risk attitude for telecommunications equipment. International Journal of Quality and Reliability Management, in press.
- Capacity Constraints in Pediatric Inpatient Psychiatric Care: A Cross-Sectional Analysis of Bed Availability and Geographic Access in North Carolina
- Why Healthcare Analytics Still Optimizes the Wrong Things
- Coding, Coverage, and Care: The Infrastructure of Transgender Health Inequities
- The Effect of Classroom Attendance on Academic Achievement of Management and Leadership Discipline of Nursing Students at Instituto Superior Cristal and Universidade de Dili, Timor-Leste, 2024: A Case Study
- The Role of Social Bonds in Facilitating Shared Investments and Resource Allocation: Addressing the “Wrong Pocket Problem” in Public Health and Healthcare
- Social-Cultural Factors Contributing to Antimicrobial Resistance in Livestock Farmers and Community Households in Kayonza District, Rwanda