Brain Tumour Texture Analysis-A Method
Computer aided technology is used in biomedical image processing. In biomedical analysis features are extracted and then the proposed method will detect any abnormalities present or not in the system to be considered. In recent days the detection of brain tumour through image processing is made in medical diagnosis. The separation of tumor is made by the process of segmentation. Brain in human is the most complicated and delicate anatomical structure. There are various brain ailments in human but the indication of cancer in brain tumour may be fatal for the human. Brain tumor can be malignant or benign. The neurologist or neurosurgeon wants to know the exact location, size, shape and texture of tumor from Magnetic Resonance Imaging (MRI) of brain before going to the operation of the brain tumour or decided whether operation of removing brain tumour is at all necessary or not. The disease is analyzed since operation may cause death to the patient. Initially they took a chance by prescribing medicines to see whether there is any improvement of the condition of the patient. If the result is not satisfactory then there is no option other than operation of the tumor. Doctors also take an attempt to find the texture of the tumor since it may help them to know the progress of the tumour. In addition to Brain tumor segmentation, the detection of surface of the texture of brain tumor is required for proper treatment. The chapter proposed methods for detection of the progressive nature of the texture in the tumor presence in brain. For this process segmentation of tumor from other parts of brain is essential. In the chapter segmentation techniques are presented before the texture analysis process is given. Finally, comparisons of the proposed method with other methods are analyzed.
Introduction
Based on the report of the National Cancer Institute statistics (NCIS) the overall cases of carcinogen including brain cancer has increased more than 10%. There are nearly 200 other categories of tumours are also detected in the globe in every year. It is true that the disease like tumour in brain is not very common. Still there is necessary for detection of the brain tumour through computerized image processing from the MRI of brain [1]. Brain tumor is caused due to the growth of tissues in brain and it is uncontrolled from outside. The various modalities of bio-medical imaging allow the doctor and researchers to analyze the brain anatomy by studying the Policy Article brain image through computer processing [2]. MRI is a bio- medical imaging technique used by radiologist for viewing the anatomical structures. It describes soft tissue structural anatomy of human [3].
The study of the human anatomy through MRI can be made without invasive surgery [1]. Brain image segmentation defines the process of creating partition and analyzing the image into visibly and anatomically different regions. It is amongst the most vital and critical aspect of computer aided clinical diagnostic of tumor or other anatomical abnormalities. Presence of noises in MRI is multiplicative in nature [4]. These are to be removed during pre-processing.
From the clinical aspect, it is very essential to ensure that the sensitive anatomical details are not removed by the noise reduction algorithms. So proper isolation of the tumor i.e. segmentation of tumor is a challenging task for researchers. It is very critical for proper diagnosis by computer aided clinical tools. A number of procedures for segmentation of MRI had been proposed till date [5]. Texture analysis was widely in areas like remote sensing, object recognition, mobile robot navigation, estimation of 3D surface area from 2D images and many more. For texture analysis multiple algorithms or mathematical modeling can be classified into number methods. These have advantages and disadvantages [6].
The chapter is focused on MRI segmentation, tumor detection and texture analysis of tumor. For segmentation of the tumour spatial domain analysis and frequency domain analysis are proposed. The proposed algorithms are compared with various other algorithms over different performance metrics. Moreover, an algorithm for texture analysis is also proposed for finding an idea of the surface using wavelet and fractal geometry.
Various Scanning Mechanisms
Medical imaging relates to Radiology as “clinical imaging”. It is true that medical practitioner or radiologist can understand the images for initial screening. The radiologist is responsible for capturing medical images of clinical quality for diagnosing by the computerized method. Bio-medical imaging is the domain of pathological investigation which combines different inter-disciplinary areas of technology like bio-medical engineering, physics and medicine [7, 8, 9, 10].
Ultrasound (USG)
It produces 2D image for analysis of heart disease, liver disease, etc. It provides much little anatomical detailing than other imaging techniques. However, it has some advantages so it can be used as a first line investigation in several situations where it studies the regularity of the functional parts and relocation or enhancement of internal structures in human body inside or outside. Since the patient is not exposed to radiation, it is also very safe to use. Ultrasound scanners are easily portable and so it possible to move in an intensive care unit instead of avoiding the risk of transferring the patient to the radiology department for testing some important features related to medical diagnosis of the patient. It is possible also to observe instantaneous movement of fluid and body organs can be captured as images and is essential for performing drainage of fluids or biopsy. Ultrasound scanners with color Doppler allow the flow of blood in body and can be analyzed for better treatment facility.
Projection Radiography (X- Rays)
Radiographs, generally termed as x-rays, are mostly used to diagnose the type, position and extent of bone fracture and for diagnosing pathological changes in lungs. It also used for stomach and intestines which helps to diagnose ulcers and different varieties of colon cancer.
Computed Tomography (CT)
A Computed Tomography is helical in structure and conventionally generated human anatomy in 2D. Repeated scans are limited due to ionization. X-rays is obstructed by any type of high density tissue to generate an image. This is not true for CT.
MRI
It is advanced imaging technology. It can scan of the related parts of the body. MRI uses three types of electromagnetic field: the strong static field of the order teslas, for polarization in between low to high and the gradient field that uses a relatively weak time-varying signal of approximately 1 kHz for encoding in spatial domain. A weaker radio-frequency (RF) field is used to manipulate hydrogen nuclei for generating signals of good strength that are intercepted through a Radio Frequency antenna. It also generates 2D image of thin slice of the anatomical structure and is hence considered being one of the best and affordable imaging technology. Latest MRI machines are also eligible to generate images as 3D blocks. It is less hazardous than CT since there is no radiation. Patient can be scanned as many times as necessary. However, there is some health related risk related with tissues getting heated. In Computer Tomography, X-rays should be obstructed by any type of high density tissue to generate an image, hence the quality of images while examining of soft tissues might be not of good quality. MRI will visualize hydrogen based objects, like bones. Since it contains calcium, so it will not be visible within the image. It will not obstruct the soft tissue. Thus it is suitable for investigating joints of bones and also for brain disease.
Positron Emission Tomography (PET)
For diagnose of various cerebral anomalies PET is used. Using nuclear medicine, a short-lived isotope, such as 18F, is transfused into the body through glucose that gets assimilated through blood into the tumor which is to be investigated. PET scans are mostly done in addition to CT scans using the same machine and hence does not require movement of patient. Hence, tumors found by the PET scan can be analyzed parallel with the images obtained using CT scan. PET used nuclear medicine that might have adverse effect on body issues in long run.
Dataset Used
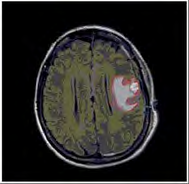
Four open access data set of ‘The Whole Brain Atlas’ are considered [32]. The first data set has 40 brain slices, the second data set has 100 slices, the third data set has 150 slices and the last set has 200 slides. The brain images from the four data sets are all T2-weighted and have a size of 256 X 256. Each of those axial slices was verified and the outputs are confirmed by doctors. As the brain images are taken from open access database, so “No ethical approval is required”. Moreover, image data was taken from various government and private hospitals in West Bengal. The images were analyzed by registered medical practitioners and radiologists and ground truth was registered. The output was compared with this ground truth.
Proposed Methods of Segmentation
Spatial Domain Segmentation
Segmentation is a critical task in determining the tumour in the brain. It actually separates the tumour efficiently by segmentation method. MRI is an imaging technology that detailed out internal anatomical structures in different body parts. It is used to differentiate between pathologic tissue like brain tumor from other tissue like white matter and greyx matter of brain [30]. It applies powerful fields of magnet and non-ionizing emission in the RF range. Computerized Tomography and X-rays used different radiation for ionizing in general. It generates a high contrast image showing regular and abnormal tissues that is used to differentiate between overlapping segments. Segmentation of image is required to identify objects and their borders [31]. It divided an image into a, sets of pixels, commonly known as super pixels. The pixels having same label share same visual characteristics. Pixels in a segment have common features like color, intensity, or texture. Adjoining regions are considerably dissimilar in comparison to the similar visual characteristics. The output of segmentation is the set of discrete sections that communally wrap the whole image, or a particular set of contours removed from the image. It is important in biomedical images where diagnosis before and after surgery is essential for the patient to see the improvement. It also views the position of unwanted tissues. Computer assisted identification of unwanted growth of tissues is greatly defined by the necessity of obtaining correct observations. The accuracy, simplicity, easy to use and reliability are the main points of computer aided diagnosis. A biomedical image is first digitized and moving further for segmenting the images to get necessary information. So it is required to develop algorithms to classify the border of brain tissues and also minimizes the end-user interaction with the system thereby reducing human error [32]. The steps in the proposed algorithm in spatial domain are as follows: a. Enhancement of Input Image b. Images Registration c. Image Fusion d. Stripping of Skull e. Segmentation f. Extracting WM, GM and Tumor g. Analysis of Tumour Dimension It is defined by calculating the negative of laplacian filter having parameter x, where the x determines the curve of the Laplacian. The x will have value in between 0.0 to 1.0. The default value of is 0.2. In this filtering technique, blur copy of the image is subtracted from the original image. Double precision floating point is used for computing every element in the output image. The value x is used as threshold value.
All images are registered corresponding to base image. Hence Multiple Image registration is necessary to implement and then those registered image had to be fused. The algorithm must take into consideration not only the type of geometric deformations among the image but also various other effects that required precision of registration process and data characteristics which are dependent on applications. Most registration algorithms consist of the steps described in the next paragraph.
In feature detection distinct and salient objects such as contours, boundary regions, line intersections, edge, corner, etc. are to be detected. It is made by analysis of histogram of the image. In feature matching correlation between features found in sensed image and the feature observed in referenced image are established. In transform model estimation rigid geometric transformation is implemented. Rotation and translation of the image is performed for aligning with base image. Next transformation is done using nearest neighbour interpolation. By taking the average of pixel gray level values of source image the image fusion is used. Here two or more pre-registered images are also fused for getting high quality image. The scull bone is removed by generating skull-mask from the MRI. Based on the thresholding value foreground and background of image are separated using histogram based method [31, 32].
The steps for segmentation of different parts of brain are as follows:
- Initial segmentation is by k-means algorithm.
- Local standard deviation is used in Grid based coarse grain localization.
- Fine grain localization grid based used local standard deviation.
The segment of parts of brain is finding based on the clustering method. The mostly used unsupervised learning methodology for clustering is the K-means [32]. The algorithm uses simple and efficient method for forming a finite number of clusters from the set of data. In the proposed method the value of k is selected as 3.Then the method calculates centroid of each cluster. Next for each point the location is calculated for a given dataset and correlated with adjacent centroid. After this step k new centroids are recalculated for those clusters resulting from previously. The algorithm executes through the following steps:
- Place K distinct points in original image which are characterized by objects. These are clustered. Initial group centroids are signified by these points.
- Every object is assigned to a group by the closest centroid.
- The recalculation of position of K centroids is executed.
- Repeat Steps 2 and 3 until the recalculation of centroids is stopped.
The technique depends on the primary detection of centroids correctly. It is difficult to predict the correct value though a single method. Two other approaches are applied for better segmentation.
The second approach using local standard deviation will be executed after having done segmentation using K - means. The local standard deviation of output of the k - means segmented image is calculated. This image is projected onto big grid i.e. 8 by 8 pixels. Local standard deviation of every pixel is generated depending on the pixel values of these 64 pixels of the grid. Each grid is generated and calculated local standard deviation and histogram in every grid. The boundary of segmentation in grids is re-calculated to get better result. A larger grid dimension helps to reduce noise in segmentation. It also removes sharp curves in boundary region of tumour or overlapping area of gray and white matters of the brain. By taking less grid size of 3 by 3 pixels in the third approach is chosen for this purpose. Smaller grid size helps to focus on fine anatomical variations of MRI. It restores the details of the tumor border and proper analysis of the overlapping region of gray and white matter. After image segmentation, outputs are generated of the segmented image.
Line scan algorithm is used next to the derived output of the detected tumor after the image segmentation. The maximum length and width of the tumor along the two axes, i.e. the x axis and y axis is calculated. The results obtained after processing of the above steps are shown in Figure 1.1 to Figure 1.6.
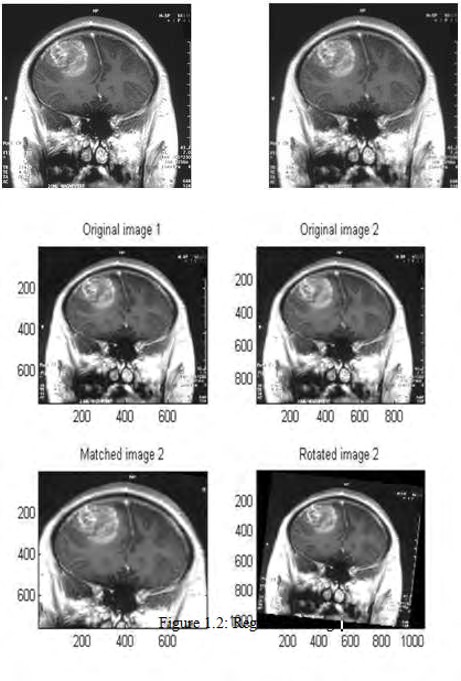
(a) (b) Figure 1.1: (a) Input Image (b) Enchanced Image.
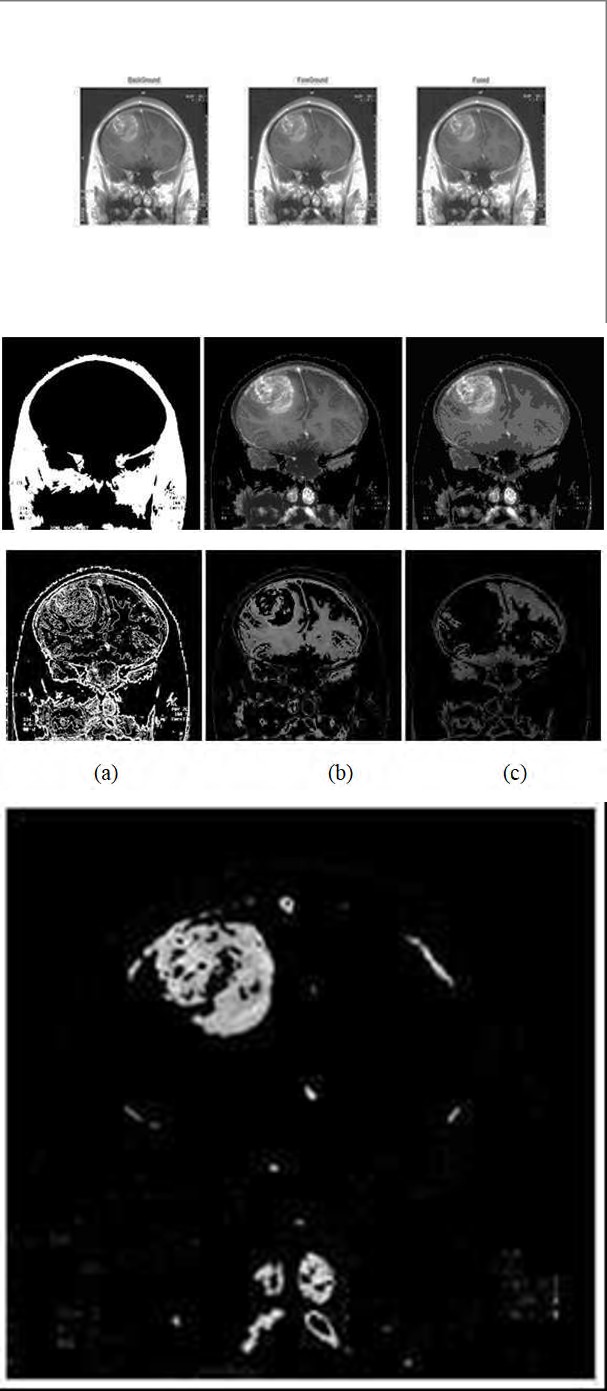
(a) (b) (c) Figure 1.4: (a) Skull Mask (b) Skull Removed and (c) K -Means Segmented Image
The segmentation of Brain MRI enhanced the accuracy of the method for detection of tumour. The outcomes of brain segmentation as shown above are in accordance with the latest medical standard. Moreover, the segmentation in brain MRI is taken from all the three angles of imaging. It is quite satisfactory algorithm in the family of unsupervised clustering.
Frame Theory
Fourier transform solely provides frequency information. It does not help to find out duration of the signal and moment of emission. D. Gabor solved this problem in 1946 [33] using a new approach to signal decomposition. Important signal characteristics are not changed during the transformation. In 1952, Duffin and Schaeffer studied problems in non-harmonic Fourier series. Hilbert space frame was introduced. So time-frequency analysis is now Gabor’s approach. In 1980’s Daubechies, Grossman and Mayer studied the fundamental concept of frames [34, 35, 36]. A frame contains more frame vectors. Each vector in the space has infinitely many representations corresponding to the frame. There may be redundancy of frames. It is the key to their significance for applications. The redundancy makes system robust. Hilbert space frame is to weaken Parseval’s identity and yet still retain norm equivalence between a signal and its frame coefficients. The frame operator is considered the most important operator associated with a frame. It is the concatenation of two operators- analysis and synthesis. It encodes crucial properties of the frame and the reconstruction of signals from frame coefficients can be possible. The Frame operator is invertible. The Inverse of the Frame operator itself forms a frame called the dual frame. In Parseval Frames both frames are same. Ingrid Daubechies proved that Wavelet frames are Parseval frames. DWT used here is based on this property [34]. In theory Hilbert space has infinite dimension. The extension of finite frames and infinite dimensional frames expressed using transfinite theorems such as Zorn’s lemma. Linear transform maps from time to the frequency domain. The space of the Cartesian product of the time variable corresponding to the frequency variable is called time-frequency space. Any subset or waveform on this space is denoted as time-frequency atoms. According to the property of Parseval frames it is observed that synthesis operator of dual frame is similar to analysis operator due to the isometric property of analysis operator. Hence, it is observed that original frame and canonical dual frame [37] are similar for Parseval Frames [38]. Wavelet frames are Parseval frames was proved by Ingrid Daubechies [38]. The proposed method uses this in Discrete Wavelet Transformation. Analysis of the frame theory works completely with finite dimensional Hilbert space. The subset of general infinite dimensional Hilbert spaces is used in the proposed method. It can also be shown that wavelet bases are Riesz bases [39]. The domain could be divided into infinite number of Heisenberg Boxes and union of it generates an entire domain. It recreates the space by the use of Heisenberg’s boxes having constant area but varying widths and lengths. As per uncertainty principle, greater localization in time results smaller localization in frequency domain. The method uses this principle by the use of a new transformation having compact support kernel. Based on dilatation parameter, the support of it could be dilated, such that it might vary localization in time of window transformation as per requirement [40]. The signals are decomposed by Wavelet transformation over translated and dilated wavelets. A group of time frequency atoms is normalized. It is called Scaling Functions and these are shifted at non overlapping intervals. Since images are 2D data and it is required to transform the image using 2D wavelet or use the 1D transformation to columns and rows of image data one after another as separable 2D transformation technique. In different applications wavelet is being used for processing of image and compression due to low computational complexity. Here separable transforms wavelets are chosen. An N x N image is considered as 2D array of pixel I having N columns and N rows. In the proposed method every color component of color images is separated as gray scale images.
In bio-medical image procession, the accuracy is of highest importance. So an accurate segmentation method is required for Discrete Wavelet Transformation based on frame theoretic concept and the state-of-the-art k-means clustering [41] algorithm to get high precision and minimal quality loss. Multi resolution analysis divided the image into k clusters which will denote the white matter, gray matter, Cerebrospinal fluid (CSF) and tumor, if present.
Firstly, Sub blocks contains input image. The Daubechies family of basis function is considered for wavelet decomposition of sub block by frame theory concept. This wavelet transform is simple to implement and provide better result.
For every sub-block of the image, every sub-band coefficient is arranged into vectors. On successful collection of coefficients of every sub-block, K-means clustering is executed for each individual sub-band wavelet coefficients for a specific value of cluster of size K. The process is now presented in the form of algorithm.
The tumour boundaries are found out. It had been correlated by radiologist with the ground truth and the results are found to be satisfactory.
Algorithm
Input: The input MR image. Output: Classes of each object i.e. Gray mater, white matter, CSF and tumor, if present, and the corresponding cluster centers.
- Initially, the given image is preprocessed for reducing unwanted information.
- It is now subdivided into sub-matrices.
- 2. Then each sub-matrix is transformed by wavelet transformed using the concept of frame theory.
- It is rearranged to matrix.
- Every sub-band matrix of a given sub-matrix is reshaped into a vector.
- For clustering, k objects are selected at random to form initial clusters.
- 6. Put objects into the corresponding clusters based on the distance calculated between objects and each cluster.
- 7. Calculate of new cluster center since new orientation
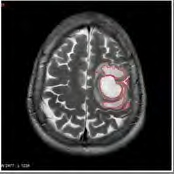
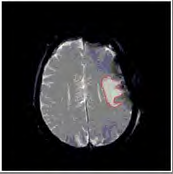
of cluster. • 8. On successful clustering, transform the frequency to image by inverse wavelet transform and outline the tumor cluster, if present, is highlighted in red color. Test cases were taken from the data set having 200 images. The simulation was done on 200 image data set using MATLAB and time taken was also calculated by MATLAB. The images were T2 weighted. Some of the segmented images, which are the outputs of our algorithm, have been shown below in Figure 7 to Figure 10. The segmented part is bounded by the red border by the algorithm automatically. The outputs were verified with ground truth by professional radiologists and medical practitioner. The tumour boundaries are found out. It had been correlated by radiologist with the ground truth and the results are found to be satisfactory.
Texture Analysis of Tumour in Brain
An image texture is defined by pixel intensities, their distribution, and their interrelationships. Tumour heterogeneity (through parameters like kurtosis, entropy, and pixel distribution that potentially correlate with cellular density, angiogenesis, and necrosis) measures Texture Analysis (TA) and may better predict tumour biology. Brain tumor segmentation is quite popular area of research but detection of its surface texture is challenging for researchers. For proper diagnosis of brain tumor it is used to scale the low resolution image to a suitable resolution without loss since MRI has low resolution. Fractal dimension, fractal area, and wavelet average are used to classify type of texture present in brain tumor [42].
Texture analysis or recognition has been an active research topic since almost three decades. Texture analysis was widely used in remote sensing, object recognition, mobile robot navigation, estimation of 3D surface area from 2D images and many more. Multiple algorithms or mathematical modeling methods classified into three major categories: model based methods, statistical methods and structural methods. Texture analysis has a wide spread scope. Texture analysis is used in a variety of applications including medical image processing. Texture analysis has a distinct application in applied crystallography where the crystal structure, stress, strain and crystal size determination is done.
The classification of the object pattern becomes easy if we can identify the texture. The attributes of the texture is defined as coarseness homogeneity, orientation and the spatial relationship between image intensities or tones is determined. Based on the attributes, texture is broadly classified as micro-texture and macro-texture. They are composed of shapes, sizes and placements.
Based on feature selection, texture understanding method is classified as spatial methods, structural methods and statistical method. In spatial methods, a texture is a segmented region from which lines, edges, orientation, etc., are extracted from the larger area of tumor area.
The method looks for such repetitive perceptual features, and creates a vector of these perceptual features in the texture. In structural characterization, a texture is viewed as made up of many primitive textural elements, called ‘texel’, arranged according to some of the specific placement rules. In statistical methods a texture is defined as a random field and a statistical probability density function model is fitted to the spatial distribution of intensities in the texture. This method measures the interactions of small number of pixels. To understand the statistical correlation of different textures, the knowledge of texture spectrum is necessary.
Texture Spectrum is a statistical way of describing the different texture features which are present in an image. A texture image is represented by small units called as texture unit. It represents local texture information for a good pixel and neighborhood of that pixel [12].
Eight neighborhood pixels form a smallest unit. Therefore, texture spectrum is defined as the frequency distribution of the entire texture unit (numbers) with the abscissa that represent the NTU and the coordinate frequency of its occurrence [17].
The fractal properties of an image are based on and calculate from the rate of the decrease of areas where an image is captured at a course of resolution as the finer details present inside the area. Fractal properties depend on amongst various images and texture components. In case of the straight line the actual distance is exactly equal to the estimated distance. This fractal dimension is calculated from the slope of the line present in the textured image.
Each pixel in a textured image is considered as cuboids with its length and width equal to the pixel dimension and height equal to the pixel intensity. The total exposed surface indicated the texture. The area is calculated at different integer ruler sizes L which is obtained by calculating different integer ruler sizes L for generating a new image with pixel size L. This is done by averaging adjacent pixels.
Automatic image analysis has a lot of scope for implementation, from image classification to image retrieval. Semantic gap problem corresponds to the alteration between the user image perception and automatic extracted features. Texture features are used for maintaining orthogonal nature among different classes. On the other hand, it can be effectively implemented for solving the semantic gap problem. As a result, research on texture classification is focused on improving the distinguish-ability of the algorithm.
The problem of identifying the type of texture in tumor of brain from MRI is addressed in the chapter. Segmentation technique is utilized to visually extract the tumour position. Wavelet transform is established as a very efficient tool for analyzing an image’s frequency components in a localized manner.
Initial Image is first subdivided in small blocks of pixel. For identification of the texture of the tumor texture of each sub block is obtained. To get the details of input image including energy and frequency details multi resolution wavelet transform is implemented. Wavelet Decomposition technique applied for obtaining the feature based on the decomposition. Next finding threshold of the input image for implementing box counting algorithm to obtain the features from it. The features will now serve as the feature set for the classifier. To predict texture of the new image the trained classifier will utilize it . It proves to be a very suitable and efficient method to obtain the localized frequency information of any signal. Previously frequency details were retrieved using Fast Fourier Transform. Wavelet based transform gives the localized information about the frequency content as feature. Frequency domain values are used as a set for classifying texture. Detail values are calculated using different types of wavelet packets. The Wavelet families (i) Haar (ii) Daubechious (iii) Bior (iv) Coiflet are used for feature extraction. The binary image is divided into small grid and for each sub grid part the fractal dimension is stored. Mean and Area of the fractals are calculated.
The algorithm is decomposed in two stages:
- A classifier is trained using some known datasets whose texture is known by the user.
- Next texture type is found based on segmentation of the tumour. Tumour may be benign or cancerous. After locating the tumour the type of texture of the tumour can be determined. Depending on the nature tumour it can be smooth, rough, etc. The radiologist can decide the type diagnosis is needed for patient. TA is a non-invasive method to quantify macroscopic tissue heterogeneity indirectly linked to microscopic tissue heterogeneity. MR imaging texture analysis (MRTA)-based studies have shown promise in predicting glioma grade, survival, molecular status, and response assessment.
The fractal analysis provides information about the self-symmetry of the objects. The method is called spectral method. It includes wavelet, Gabor, and Fourier transforms and is based on transforming the spatial information of the image into spatial frequencies.
The first- and second-order spectral methods are used most commonly. First-order provides global information and second-order indicates additional information regarding the transition among pixel values. Two different tumors may have similar distribution of intensities but may differ in their spatial interrelationship. Second-order spectral method may be preferable, especially for markedly heterogeneous tumors.
In this chapter the problem of identifying the type tumor texure of brain from MRI is addressed. Segmentation technique is utilized to visually extract the position and size of the tumor. Wavelet transform is established as a very efficient tool for analyzing an image’s frequency components in a localized manner. The basic steps are discussed below:
- The input Image is first divided in small blocks of pixel.
- Texture of each sub block is obtained in order to identify the texture of the tumor.
- Multi resolution wavelet transform is implemented to get the details of input image including energy and frequency details.
- The feature vector thus obtained is easily achievable in terms of complexity.
- Previously frequency details were retrieved using Fast Fourier Transform.
On the other hand, Wavelet based transform gives the localized information about the frequency content as feature.
Algorithm
1. Input MR Image. 2. Histogram equalization of the Image is made.
3. Skull is separated by Segmenting the Tumor from the brain. 4. Finding the texture information for the blocks which have a part of the tumour. 5. Since blocks are too small to find textures features so Wavelet based resolution enhancement is implemented. 6. Fractal Dimensions are calculated using hausdorff method. 7. Detail of the wavelets as features are used to identify the texture detail. 8. Features fed to classifier and the output class for each block is used to find out the tumor part. 9. A grayscale image is generated showing the texture details with the different grayscale levels.
$$ G r a y \quad S c a l e \quad V a l u e s \quad (B l a c k = 0 \quad a n d \quad w h i t e - 2 5 5) $$
corresponding to different classes are shown in Table 1.1.
| Type of Class | Gray Scale value |
|---|---|
| Smooth | 42.5 |
| Moderately Smooth | 85 |
| Slight Smooth | 127.5 |
| Slightly Smooth | 170 |
| Moderately Rough | 212.5 |
| Rough | 255 |
Table 1: 1.
From the results as shown above it is observed that the value of gray level of texture indicates the stages of tumour. More gray value the stage of tumour is more. This would help doctors to have a perception of the texture the tumor. It will help in diagnosis the type and state of the tumor by correlating to other clinical and pathological tests.
Results
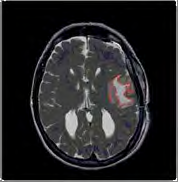
Machine learning algorithms can eventually transform the healthcare industry by improving diagnosis, prediction. Intelligent automation systems can be developed by the machine learning algorithms. There are many existing machine learning techniques based on several logical entities for constucting the intelligent predictive systems. We had compared our proposed wavelet based texture analysis classifier algorithm with four other algorithms that includes, Naive bayes classifier [42], MLP [43], KNN [44] and decision tree based classifier algorithm. The performance analysis is done based on percentage made by these algorithms. The percentage of correctly classified image by five texture algorithm is shown in Table 1.2.
| No. of features used | Naïve Bayes | MLP | K-NN | Decision Tree | Proposed Wavelet based Algorithm |
|---|---|---|---|---|---|
| 111 | 66 | 71 | 68 | 62 | 79 |
| 99 | 66 | 73 | 69 | 63 | 80 |
| 71 | 68 | 74 | 71 | 64 | 83 |
| 42 | 69 | 74 | 70 | 66 | 81 |
| 22 | 72 | 73 | 68 | 67 | 80 |
| 8 | 71 | 69 | 74 | 72 | 81 |
| 4 | 71 | 75 | 74 | 70 | 82 |
| 3 | 72 | 73 | 70 | 71 | 81 |
| 2 | 73 | 72 | 71 | 72 | 81 |
The percentage of correctly classified image based on texture by five texture analysis algorithm is shown in column and line graph in Figure 1.11 and Figure 1.12.
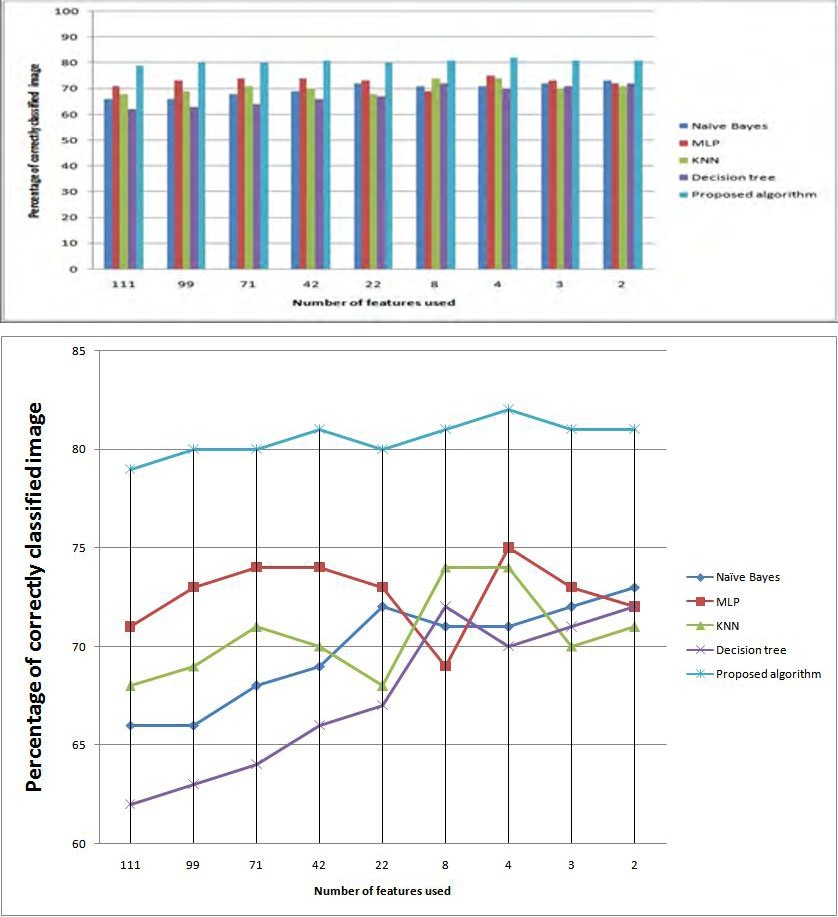
From the above comparative study and performance analysis, it is seen that the percentage of correctly classified image based on texture in our proposed algorithm is much higher than the other four algorithms. So, it can be said that our proposed algorithm performs better than other state- of-the-art algorithms which had been compared with the proposed algorithm.
Conclusion
Many different methods of segmentation were proposed in recent years. The challenge still remains in increasing the efficiency and precision of segmentation. Since, brain is sensitive organ of human body, so it requires extremely high precision in segmentation.
The detection of brain tumour is crucial since it needs open the skull of brain. During opening it it necessary to be cautious since any mistakes can create major problems. After opening the skull the arterially heart are to be function till the completion the process of removal of tumour from brain, if possible. The time for consideration of making sense less to the patient is also important. Sometimes there are certain complications during the operation an efficient surgeion can previously know all these complications. They actually prepared for this. The constant monitoring of patient is also needed and immediate actions to be taken as soon as it is detected. It is difficult to predict all the situations but a group of surgeons are present during operation. After the operation it is needed to join the skull without any small gap. If there is any gap then it has to be opened again and serious problem may arise.
Two different approaches are discussed here. First one is in spatial domain and the second one in frequency domain. The proposed method for spatial level segmentation using multiple images of Brain MR overcomes the drawbacks of the conventional K – means algorithm and gives very satisfactory result both from qualitative and quantitative perspective. The proposed algorithms also consider texture of the tumour in brain for accurately analysis by doctors.
All our proposed algorithms were tested on open source dataset from whole brain atlas and also real dataset from various hospitals in West Bengal. Our generated outputs were tested by medical practitioners and radiologists. The outputs provide highly satisfactory and better in terms of accuracy, precision and qualitative nature in comparison to other existing methods.
References
-
Kapoor L, Thakur S (2017) A survey on brain tumor detection using image processing techniques. In 2017 7th International Conference on Cloud Computing, Data Science & Engineering-Confluence. pp: 582-585.
-
Azhari EE, Hatta MM, Htike ZZ, Win SL (2014) Tumor detection in medical imaging: a survey. International Journal of Advanced Information Technology 4(1): 21.
-
Liu J, Li M, Wang J, Wu F, Liu T, et al. (2014) A survey of MRI-based brain tumor segmentation methods. Tsinghua science and technology 19(6): 578-595.
-
Pham DL, Xu C, Prince JL (2000) Current methods in medical image segmentation. Annual review of biomedical engineering 2(1): 315-337.
-
Karkanis SA, Iakovidis DK, Maroulis DE, Karras DA, Tzivras M (2003) Computer-aided tumor detection in endoscopic video using color wavelet features. IEEE transactions on information technology in biomedicine 7(3): 141-152.
-
Gujar A, Meshram CM (2018) Brain tumor extraction using genetic algorithm. International Journal on Future Revolution in Computer Science & Communication Engineering (6): 33-39.
-
Pereira S, Pinto A, Alves V, Silva CA (2016) Brain tumor segmentation using convolutional neural networks in MRI images. IEEE transactions on medical imaging 35(5): 1240-1251.
-
Kullayamma I, Kumar AP (2018) Brain tumor segmentation by using ant colony optimization. International Journal of Scientific Research in Science and Technology 4(8): 62-69.
-
Bousselham A, Bouattane O, Youssfi M, Raihani A (2019) Towards reinforced brain tumor segmentation on MRI images based on temperature changes on pathologic area. International journal of biomedical imaging 2019: 1758948.
-
Kharrat A, Benamrane N, Messaoud MB, Abid M (2009) Detection of brain tumor in medical images. In 2009 3rd International conference on signals, circuits and systems (SCS) IEEE pp: 1-6.
-
Hazra A, Dey A, Gupta SK, Ansari MA (2017) Brain tumor detection based on segmentation using MATLAB. In2017 International Conference on Energy, Communication, Data Analytics and Soft Computing (ICECDS) pp: 425- 430.
-
Zhang C, Shen X, Cheng H, Qian Q (2019) Brain tumor segmentation based on hybrid clustering and morphological operations. International journal of biomedical imaging 2019: 7305832.
-
Daubechies I (2006) The wavelet transform, time- frequency localization and signal analysis. Princeton University Press.
-
Daubechies I (1992) Ten lectures on wavelets. Society for industrial and applied mathematics.
-
He DC, Wang L (1990) Texture unit, texture spectrum, and texture analysis. IEEE transactions on Geoscience and Remote Sensing 28(4): 509-512.
-
El Dahshan ES, Hosny T, Salem AB (2010) Hybrid intelligent techniques for MRI brain images classification. Digital signal processing 20(2): 433-441.
-
Ahmed MN, Yamany SM, Mohamed N, Farag AA, Moriarty T (2002) A modified fuzzy c-means algorithm for bias field estimation and segmentation of MRI data. IEEE transactions on medical imaging 21(3): 193-199.
-
Balafar MA, Ramli AR, Saripan MI, Mahmud R, Mashohor S, et al. (2008) New multi-scale medical image segmentation based on fuzzy c-mean (FCM). In 2008 IEEE Conference on Innovative Technologies in Intelligent Systems and Industrial Applications IEEE pp: 66-70.
-
Clark MC, Hall LO, Goldgof DB, Velthuizen R, Murtagh FR, et al. (1998) Automatic tumor segmentation using knowledge-based techniques. IEEE transactions on medical imaging 17(2): 187-201.
-
Sijbers J, den Dekker AJ, Van Audekerke J, Verhoye M, Van Dyck D (1998) Estimation of the noise in magnitude MR images. Magnetic resonance imaging 16(1): 87-90.
-
Shasidhar M, Raja VS, Kumar BV (2011) MRI brain image segmentation using modified fuzzy c-means clustering algorithm. In2011 International Conference on Communication Systems and Network Technologies. IEEE pp: 473-478.
-
Warfield S, Dengler J, Zaers J, Guttmann CR, Wells WM, et al. (1995) Automatic identification of gray matter structures from MRI to improve the segmentation of white matter lesions. Journal of Image Guided Surgery 1(6): 326-338.
-
Yoon SW, Lee HK, Kim JH, Lee MH (2004) Medical endoscopic image segmentation using snakes. IEICE TRANSACTIONS on Information and Systems 87(3): 785-789.
-
Garnett L (1998) A computer algorithm for determining the Hausdorff dimension of certain fractals. Mathematics of computation 51(183): 291-300.
-
Pitas I (2000) Digital image processing algorithms and applications. John Wiley & Sons pp: 432.
-
Haidekker MA (2013) Medical Imaging Technology. Springer Briefs in Physics.
-
Hamilton JD (1994) Time series analysis. Princeton university press pp: 1-407.
-
Christensen O (2014) A short introduction to frames, Gabor systems, and wavelet systems. Azerbaijan Journal of Mathematics 4(1): 25-39.
-
Julesz B (1975) Experiments in the visual perception of texture. Scientific American 232(4): 34-43.
-
Morlet J, Arens G, Fourgeau E, Glard D (1982) Wave propagation and sampling theory—Part I: Complex signal and scattering in multilayered media. Geophysics 47(2): 203-221.
-
Sadigova SR, Ismailov AI (2014) On Frames of Double and Unary Systems in Lebesgue Spaces. Pensee Journal 76(4).
-
Kobayashi M (1998) Wavelets and their applications: case studies. Society for Industrial and Applied Mathematics.
-
Mallat S (1999) A wavelet tour of signal processing. Elsevier pp: 832.
-
Morlet J, Arens G, Fourgeau E, Giard D (1982) Wave propagation and sampling theory—Part II: Sampling theory and complex waves. Geophysics 47(2): 222-236.
-
Soman KP (2010) Insight into wavelets: from theory to practice. PHI Learning Pvt. Ltd.
-
Percival DB, Sardy S, Davison AC (2000) Wavestrapping time series: Adaptive wavelet-based bootstrapping. Nonlinear and nonstationary signal processing pp: 442- 471.
-
Qurat-Ul-Ain GL, Kazmi SB, Jaffar MA, Mirza AM (2010) Classification and segmentation of brain tumor using texture analysis. Recent advances in artificial intelligence, knowledge engineering and data bases pp: 147-155.
-
Donoho DL, Johnstone JM (1994) Ideal spatial adaptation by wavelet shrinkage. Biometrika 81(3): 425-455.
-
Burkardt J (2009) K-means clustering. Virginia Tech, Advanced Research Computing, Interdisciplinary Center for Applied Mathematics.
-
Soille P (2013) Morphological image analysis: principles and applications. Springer Science & Business Media.
-
Islam MJ, Wu QJ, Ahmadi M, Sid-Ahmed MA (2007) Investigating the performance of naive-bayes classifiers and k-nearest neighbor classifiers. In2007 International Conference on Convergence Information.
-
Windeatt T (2006) Accuracy/diversity and ensemble MLP classifier design. IEEE Transactions on Neural Networks 17(5): 1194-211.
-
Ramteke RJ, Monali KY (2012) Automatic medical image classification and abnormality detection using k-nearest neighbour. International Journal of Advanced Computer Research 2(4): 190.
-
Rajendran P, Madheswaran M (2010) Hybrid medical image classification using association rule mining with decision tree algorithm. arXiv preprint arXiv: 1001.3503.
- Capacity Constraints in Pediatric Inpatient Psychiatric Care: A Cross-Sectional Analysis of Bed Availability and Geographic Access in North Carolina
- Why Healthcare Analytics Still Optimizes the Wrong Things
- Coding, Coverage, and Care: The Infrastructure of Transgender Health Inequities
- The Effect of Classroom Attendance on Academic Achievement of Management and Leadership Discipline of Nursing Students at Instituto Superior Cristal and Universidade de Dili, Timor-Leste, 2024: A Case Study
- The Role of Social Bonds in Facilitating Shared Investments and Resource Allocation: Addressing the “Wrong Pocket Problem” in Public Health and Healthcare
- Social-Cultural Factors Contributing to Antimicrobial Resistance in Livestock Farmers and Community Households in Kayonza District, Rwanda