The Italian Patients’ Mobility as Hospital Policies Assessment
Background: The analysis of mobility flows (movement of patients to hospital away from the place of residence) involves aspects of services quality (real/perceived), equity of access to healthcare and considerable financial flows. This work has a methodological meaning and summarizes the author’s experience over the years in order to demonstrate the usefulness of Gandy’s Nomogram (Cartesian graphic tool) to evaluate hospital patients’ mobility at MACRO, MESO and MICRO level. Materials and Methods: We analysed data of Hospital Discharge Cards (HDCs) produced by Italian hospital and provided by the HDCs Database of General Directorate for Health Planning of Ministry of Health from 1998 to 2019. We used also data produced by Management Control of Polyclinic of Siena from 1988 to 2007. The subjects of the analysis (catchment areas) were hospital networks of single Italian regions and in particular the Province of Siena. The study of flows was developed through Gandy’s Nomogram. The trend analysis was carried out through STATA 14. Results: Gandy’s Nomogram of inter-regional mobility showed that there was a concentration of critical situations, especially in southern Italy, where only Basilicata seemed to have embarked on a clear path for enhancing hospital supply during the studied period. The regions of Centre-North, in particular Lombardy, Emilia Romagna and Friuli-Venezia Giulia appeared to be in virtuous conditions. Conclusion: Gandy’s Nomogram, used to represent health mobility flows, has proven to be a practical graphical tool that can provide a geographical interpretation of access to health services and it is useful for health policy evaluation and planning.
Introduction
In the last decades, the increase in low-cost treatments, affordable flights and increasingly common forms of web- based information developed the phenomenon of travelling for healthcare, which increasing attention in academic and popular media [1, 2].
Medical treatments offered to patients willing to travel to other countries for care encompass a wide variety of services including bio-ethical treatments (fertility, transplantation and stem cell therapies), diagnostic tests, dental care and for surgery (cosmetic, orthopaedic, bariatric, eye and heart) [3, 4].
In Europe, a relatively large number of people are already receiving cross-border healthcare for elective or acute treatment [5], so patients’ mobility is becoming increasingly important key issue for health policy. A key reform was the directive adopted by European Parliament in 2011, which gives citizens the right to choose health care providers across all EU member state [6]. This phenomenon is also an important issue for countries with a regional health-care system [7].
In Italy the National Health System (NHS) is organized on three level of government, central, regional and local, with a strong tendency at the regional’s decentralization [8].This organisational model is the result of Laws enacted in the last decade of the 20th century, which gave to the Regions an administrative, financial and managerial independence. They are in reciprocal competition according to the “quasi- market” model [9, 10]. So, the state monopoly without any competition was replaced by a network of competitive independent providers, with the aim of encouraging competition between hospitals. NHS based on Beveridge model, in which citizens are free to choose their place of treatment, was consolidated [11].
Patients’ migrations have a considerable financial impact on regional budgets, in fact regions have to pay for the health treatments of their residents provided in others regions and, they receive payments for health care provided to patients coming from other regions [12, 13, 14].
As early as 1956 the economist Charles Mills Tiebout argued that “patients vote with their feet” [15]: they go to the health facilities that consider most suitable for the management of their pathology regardless of territorial boundaries and their choices reflect the perception of the quality of the health service [16, 17].
Patients’ choice are influenced by accessibility, waiting lists, size and organization, the level of perceived experience, specialisation and availability of nurses and doctors per patient [18, 19, 20, 21]. Choice patterns are also influenced by social, demographic, and economic factors such as individual income, ability to travel, level of education, and patient’s age [22, 23]. The phenomenon of health mobility acquires an important relevance from an economic and social point of view [24].
Therefore, the analysis of healthcare mobility (in particular hospital) is a fundamental tool for policy planning, to monitor the activities carried out by different healthcare providers. This phenomenon is linked to aspects such as equity, trust in patients, and the reputation of the structures. It synthesizes psychometric and econometric data, which can be divided into information from the MACRO level (state or regional health policy), MESO level (management of companies/hospital facilities), and MICRO level (management of wards/management control) [25, 26, 27].
The aim of our research is to demonstrate the usefulness of Gandy’s Nomogram (Cartesian graphic tool) to evaluate hospital patients’ mobility at MACRO, MESO and MICRO level, highlighting the providers’ attitude to meet the health demand of their area and from other areas.
Materials and Methods
For “MICRO level” and “MESO level”, the catchment area was the Province of Siena. We collected data from Management Control of Polyclinic of Siena from 1988 to 2007. Some data from 1988 to 1996 were collected through the medical directions of other hospitals, which the residents in Siena were admitted.
For “MICRO level”, we considered Hospital Discharge Cards (HDCs) of oncological admissions in Polyclinic of Siena and its catchment area, in 1997: for melanoma (ICD IX 172.0- 172.9), stomach cancer (ICD IX 151.0-151.9), colorectal cancer (ICD IX 153.0-154.9+159.0), bronchi and lung (ICD IX 162.0-162.9), lympho-haematopoietic cancer (ICD IX 200.0- 208.9), radiotherapy (ICD IX V580) and chemotherapy (ICD IX V581). The codes refer to the International Classification of Diseases – ICD 9° revision.
For “MACRO level”, the catchment areas were all Italian regions. We collected data from 1998 to 2019 from HDCs Database of General Directorate for Health Planning of Ministry of Health. We included only hospitalizations of Italians patients and we excluded discharges of foreign patients in Italian hospitals. We also excluded the hospitalization of Italian citizens in other states.
The study of mobility flows was carried out from data relative to the hospitalization of R = Residents, A = Attractions, and E = Escapes, which were processed, at MACRO, MESO and MICRO level, through Gandy’s Nomogram. It represents, briefly and graphically, the access to hospitals by residents and non-residents [28, 29, 30, 31].
Gandy’s Nomogram is a squared area with the side of 100 placed in a Cartesian plan: • The X value indicates Residents (R) out of Residents (R) plus the Attractions (A): X = R/(R + A) × 100.
• The Y value indicates Residents (R) out of Residents (R) plus the Escapes (E): Y = R/(R + E) × 100.
From 100 to 0, along the X-axis, the power of Attraction increases, while along the Y-axis, Escapes to other regions increase. The Cartesian plan may be further divided into four squares by two lines, parallel to the axis, which takes the origin at X = 0; Y = 50 and X = 50; Y = 0.
The diagonal that originates from the O point (X = 0; Y = 0) and ends at the W point (X = 100; Y = 100) splits the plan in an upper part where the Y value is larger than the X one, in which there are more Attractions (A) than Escapes
(E), and a lower one with an opposite situation. The points on the diagonal have the same value either for Escapes or for Attractions, which are null in the W point and maximum in the O point.
The four above-mentioned quadrants show a different balance between Escapes and Attractions:
- Regions placed in the upper left quadrant have a number of residents’ admissions higher than Escapes and, at the same time, lower than Attractions. This condition characterizes regions as “market oriented” (E < R < A), which are able to get more funds because their hospitals admit more patients from other regions than patients from their own. The point (X = 0, Y = 100) identifies the paradoxical condition in which hospitals of a region admit only patients from other regions and there are no Escapes.
- The upper right quadrant is parted in two areas: a and b. In the first one, the residents’ admissions are higher than Attractions and the latter are higher than Escapes (E < A < R). In the second area, residents’ admissions are higher than Escapes, but the latter are higher than attracted (A < E < R).
In these two areas, there are hospitals that satisfy (in a more or less appropriate way depending on their position) the healthcare needs in their region.
- In the lower left quadrant, a diagonal divided it in two areas. Both of them have a lower number of residents’ admissions, exceeded by Escapes and Attractions: in the upper area, Escapes are lower than Attractions (R < E < A) and in the lower, we have an opposite situation (R < A < E).
- The lower right quadrant shows regions where residents’ admissions are lower than Escapes and higher than Attractions (A < R < E).
Cuzick’s test was used to assess trends over time of X and Y values of Gandy’s Nomogram. Statistical analyses were carried out with STATA software SE/14.0 (StataCorp LLC, Texas USA). Differences were considered at a statistically significant level of 95% (p < 0.05).
Results
Figure 1 shows NdG of Polyclinic of Siena for cancer cases, 1997. From the analysis of data relating to the Polyclinic of Siena departments treating oncological cases (MICRO level), relative to the year 1997, could be observed a different ability to respond to the demand for admission. According to the principal diagnosis of discharge for malignant tumour of the stomach, you could observed that these were positioned in the lower right quadrant of the NdG: the escapes were greater than the admissions of residents. A situation certainly to improve, were for chemotherapy and colon-rectum cancer (part below diagonal of the upper right quadrant). According to radiotherapy treatment the Polyclinic of Siena, already in 1997, expressed an important request for hospitalization by extra-zonal patients (the number of attracts were higher than that of Residents - upper left quadrant). The other cancer cases, in the study, were in the upper right quadrant of the NdG, above the diagonal, meaning that the Polyclinic was able to satisfy the request for assistance of their catchment area.
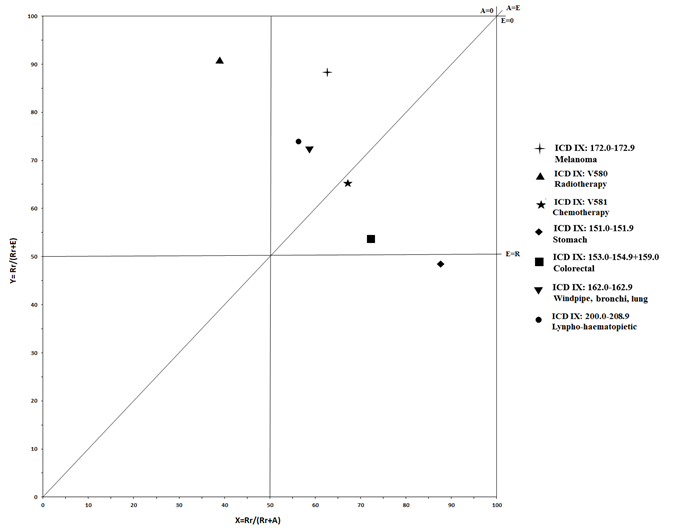
Figure 2 (MESO level) shows NdG regarding Polyclinic of Siena between 1988 and 2007 (all cases). Before the corporatisation of Polyclinic (1988-1992) and past it to 2007, the NdG shows different strategies adopted by successive general manager. The figure shows the effect of Italian Law N° 833/78 with decreed no financial compensation for healthcare mobility (it was therefore not convenient for a hospital to attract patients). After the Decree Law N° 502/92, which instituted financial compensations between Local Healthcare Authorities, the Polyclinics of Siena reacquired the role of multi-zonal hospital: they increased the attractions by good marketing activity. However the phenomenon of patients’ escapes from the Province of Siena continued for some years, once triggered such process is more difficult to reduce it because it is necessary regain the trust of the citizens. From 1998 to 2002 decreased the trend of escapes. Later, we could see a drastic worsening again.
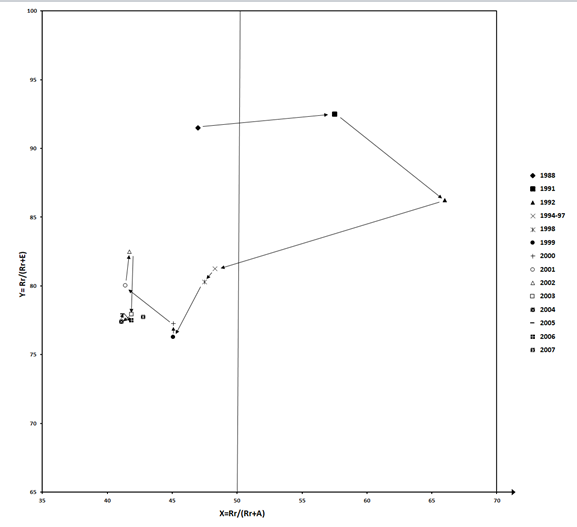
Figure 3 (MACRO LEVEL) show the trends of Italian inter-regional hospital mobility (MACRO level), represented through NdG, from 1998 to 2019. In the studied period, all regions were located in the upper right quadrant of NdG, which can be divided in two hemi-quadrants, the upper one represents the optimal planning of public hospital networks: satisfaction of the needs of residents, with a balance sheet (Attractions minus Escapes) in surplus. Only nine regions were located in this hemi-quadrant for all years considered: Lombardy; Autonomous Province (A.P.) of Bolzano, Veneto, Friuli-Venezia (F.V.) Giulia, Emilia-Romagna, Tuscany, Umbria and Molise. Liguria lost their optimal position in the last years. Abruzzo, in the first half of the studied period, had managed to cross the bisector, but few years later, it returned to the lower hemi-quadrant.
The regions with the vector directed to the left (increasing attractiveness) were Lombardy e Latium, while A.P. of Bolzano and Liguria had a vector directed to the right (decreasing attractiveness). The regions with a downward vector (increasing escapes) were Liguria, Marche, Campania and Apulia, only Piedmont had an upward vector (decreasing escapes). As we can see, the other regions (Aosta Valley, A.P. of Bolzano, F.V. Giulia, E. Romagna, Tuscany, Umbria, Abruzzo, Molise, Basilicata, Calabria and Sicily) had a biphasic trends. For all regions, the change of direction occurred around the middle of the studied period with the exception of A.P. of Trento, F.V. Giulia, Umbria and Calabria, for which it occurred in the last years.
It can be assumed that this reversal is due to the adoption, in 2006, of the “Return Plans”, imposed by the Ministry of Economy to the Regions that has finally led the system to realize the need for planning.
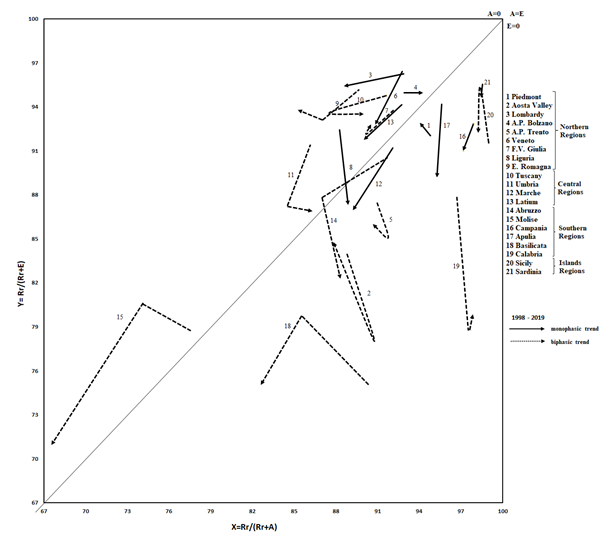
Table 1 show significant changes of X (attraction) and Y (escapes) expressed graphically in increase (↑), and decrease (↓). It also shows the point of start (1998) and arrival (2019) as positive (+) if they were in upper hemi-quadrant of NdG and negative (-) if they were in lower one. This table gives us summary description of the evolutions observed for each region. This table shows a synthetic description of evolution for regions. Liguria, Marche, Latium, Abruzzo, Campania, Apulia, Calabria and Sardinia were in a critical situation in worsening. Piedmont, Aosta Valley, Basilicata and Sicily were in a critical situation in improving. A.P. of Trento was in a balanced critical situation. A.P. of Bolzano, Veneto, Tuscany, Umbria and Molise were in optimal situation in worsening. Only Lombardy, E. Romagna and F.V. Giulia were in optimal situation in improving.
| Region | X (Attraction) | Y (Escapes) | Trend | Position | Situation | Changes | |
|---|---|---|---|---|---|---|---|
| 1998 | 2019 | ||||||
| Piedmont | ↓ | Monophasic | - | - | Critical | Improving in Y | |
| Aosta Valley | ↑ | ↓ | Biphasic | - | - | Critical | Improving |
| Lombardy | ↑ ↑ | ↑ | Monophasic | + | + | Optimal | Improving in X |
| A.P. of Bolzano | ↓ | Monophasic | + | + | Optimal | Worsening in X | |
| A.P. of Trento | Biphasic | - | - | Critical | Balanced | ||
| Veneto | ↑ | ↑ ↑ ↑ | Monophasic | - | - | Optimal | Worsening in Y |
| F.V. Giulia | ↑ | Biphasic | - | - | Optimal | Improving in X | |
| Liguria | ↓ | ↑ ↑ ↑ | Monophasic | + | - | Critical | Worsening |
| E.Romagna | ↑ ↑ | ↑ | Biphasic | + | + | Optimal | Improving in X |
| Tuscany | ↑ | ↑ | Biphasic | + | + | Optimal | Worsening |
| Umbria | ↑ ↑ ↑ | Biphasic | + | + | Optimal | Worsening | |
| Marche | ↑ | ↑ ↑ ↑ | Monophasic | - | - | Critical | Worsening in Y |
| Latium | ↑ | ↑ | Monophasic | + | + | Critical | Worsening in Y |
| Abruzzo | ↑ ↑ ↑ | Biphasic | - | - | Critical | Worsening in Y | |
| Molise | ↑ ↑ ↑ | ↑ ↑ ↑ | Biphasic | + | + | Optimal | Worsening in Y |
| Campania | ↑ | ↑ | Monophasic | - | - | Critical | Worsening in Y |
| Apulia | ↑ ↑ | Monophasic | - | - | Critical | Worsening in Y | |
| Basilicata | ↑ ↑ ↑ | Biphasic | - | - | Critical | Improving in X | |
| Calabria | ↓ | ↑ ↑ ↑ | Biphasic | - | - | Critical | Worsening in Y |
| Sicily | ↑ | Biphasic | - | - | Critical | Improving in X | |
| Sardinia | ↑ | ↑ | Monophasic | - | - | Critical | Worsening in Y |
Table 1: ** Summary table of Italian inter-regional hospital Patients’ mobility.
Significant changes in X and Y (p<0,05) ↑↓ = 0,01% - 3,2% ↑ ↑↓ ↓ = 3,3% - 6,5% ↑ ↑ ↑↓ ↓ ↓ 6,6% - 9,8% Table 1: Summary table of Italian inter-regional hospital Patients’ mobility.
Discussion
The equitable distribution of the care services is primary objective Italian NHS. The Equity is the most difficult feature to pursue among the “3 E” (the other are Effectiveness and Efficiency) which, together, qualify a civil and modern health system.
For Local Healthcare Authorities, territorial basis of the universalistic health model, and for the region, the political mind of health planning, a patient’s “elective” escape represents a marker of failure of above objective.
Using graphic representation as NdG we have made it easy to see whether or not such quality objectives have been achieved by several wards (MICRO level). In the hospital (Polyclinic of Siena) the ability to meet the demand of its residents and that of extra-patient for different type of pathology (in our study oncological cases) can vary greatly, reflecting the planning capacity of the different wards.
The analysis of healthcare mobility of Polyclinic of Siena for all cases (MESO level) found that, during the 1980s, the system of hospital financing based on historical expenditure, not adjusted according to mobility “active”, decreased the interest in attracting patients and that discourage the power of attraction can lead to the loss of quality of the company product. Once started, it is not easy to stop or reverse a negative trend. The different administrations have not all achieved the same results in recovering this quality.
With the same technique, applied to regional hospital networks [26] it is also possible to allocate regions which have an health planning to those which do not have it (MACRO level). According to inter-regional mobility, the regions that attract the most patients have been able to guide virtuously the hospital planning towards the improvement of the qualitative-quantitative offer.
There is a concentration of critical situations in the regions of southern Italy, where only Basilicata seem to have undertaken an improvement of their hospital offer. The insular nature (Sicily and Sardinia) seems to be a negative factor, even if the Sicilian health planning have had some effectiveness in improving attraction and, at the beginning of our studied period, in the reduction of escapes.
In better conditions, appear different regions of the Centre-Northern, in particular Lombardy, Emilia-Romagna and F.V. Giulia. In the North, however, the critical situation of Aosta Valley (which is also improving) can be attributed to the small area, population and population density, Attention should be paid to the poor performances of the Autonomous Province of Trento and Piedmont (which is also improving).
Moreover, Veneto and Liguria, historically with excellent healthcare services, manifested a trend in worsening. Many regions have shown two-phase trends, in particular for the containment of escapes. The year of inversion, for the most regions; was 2006. It can be assumed that this reversal is due to the adoption, in 2006, of the ”Return Plans”, imposed by the Ministry of Economy to the Regions that has finally led the system to realize the need for planning.
It is known that in Italy there are regions that respond promptly to the central government directives, while others are “late responders” [27].
Twenty and more years of decentralization have shown that not even the regions are able to manage the hospital planning. Unevenness, for example in terms of access fairness and quality of care, could well increase [24]. Regions unable to provide services the provision of health care.
Regions that are unable to provide appropriate services cannot find, through patients’ mobility a way of prolonging inefficiency. The solution could be found in the implementation of sanctioning systems for institution that, through its inefficiency increase patients’ mobility, and to reward those who demonstrate their ability to organise a service that meets international standards.
However, the balance negative of mobility takes on the meaning of an unfavourable indicator, but a share of mobility may be useful: for example, focusing patients in high- performance hospitals only for pathologies requiring high speciality [14, 15, 16, 17, 18, 19, 20, 21, 22, 23, 24, 25, 26]. It is a phenomenon which, if planned and compensated, could be virtuous, based on effectiveness and economy of scale. Hospital planning should assess what is the most efficient solution between a “centralising” agreement for services and “covering/correcting” the lack of “network “.
Health mobility as described above is one of the traceable outcomes on the path of this empowerment.
A limitation of our study is that the NdG is based on percentages, which mask the amount numerical data. It also have not been “weighed” for DRG. Regional planning could, for example, engage in pathologies more significant, from the point of view of severity or economic impact, overlooking the other, less relevant.
Conclusion
The tool examines how many people cross the administrative borders to receive hospital care. We assume that greater is the percentage of people receiving care in their area, greater is the equity of patients’ access to health services. Less is local access, higher is proportion of patients who have to travel for care. Gandy’s Nomogram, used to represent healthcare mobility flows, has proved to be a practical graphical tool, applicable at different levels (Ward, Hospital, Local Healthcare Authorities, Region and Whole Country). It is capable to give us a geographical interpretation of access to health services, which is topic of great importance for decision-makers (managers and politicians) but also for analysts of heath policy.
References
-
Ricci A, Barzan E, Longo F (2020) How to identify the drivers of patient inter-regional mobility in beveridgean systems? Critical review and assessment matrix for policy design & managerial interventions. Health Serv Manage Res 4(4): 258-268.
-
Hanefeld J, Horsfall D, Lunt N, Smith R (2013) Medical Tourism: A Cost or Benefit to the NHS?. PLoS ONE 8(10): e70406.
-
Lunt N, Mannion R (2014) Patient mobility in the global marketplace: a multidisciplinary perspective. Int J Health Policy Manag 2(4): 155-157.
-
Horsfall D (2019) Medical tourism from the UK to Poland: how the market masks migration. Journal of Ethnic and Migrations Studies pp: 4211-4229.
-
Beuken JA, Verdtegen DL, Dolmans DHJM, Van Kersbergen L, Losfeld X, et al. (2020) Going the extra mile – cross-border patient handover in a European border region: qualitative study of healthcare professionals’ perspectives. BMJ Qual Saf 29(12): 980-987.
-
Brekke KR, Levaggi R, Siciliani L, Straume OR (2016) Patient mobility and health care quality when regions and patients differ in income. J Health Econ 50: 372-387.
-
Directive, 2011/24/EU of European Parliament and of the Council of 9 March 2011 on the application of patients’ right in cross-border healthcare. Official journal of the European Union 88: 45-65.
-
Pinto C (2017) Percived quality and formation of inter- regional networks of health care migration. Advanced in Managament and Applied Economics 7(3): 93.
-
Messina G, Vigiani N, Lispi L, Nante N (2008) Patient migration among the Italian region in 2003. Ital J Public Health 5(1): 45-52.
-
Nante N, Messina G, Lispi L, Serafini A, Prisco G, et al. (2016) Mobility trends of patients across Italian Regions: implications for planning and evaluation of hospital service. Ann Ig 28(5): 328-338.
-
Messina G, Forni S, Collini F, Quercioli C, Nante N (2013) Patient mobility for cardiac problems: a risk-adjusted analysis in Italy. BMC Health Serv Res 13: 56.
-
Brenna E, Spandonaro F (2015) Regional incentives and patient cross-border mobility: evidence from the Italian experience. International journal of health policy and management 4(6): 363-372.
-
Levaggi R, Zanola R (2004) Patient’s migration across regions: the case of Italy. Applied Economics 36: 1751- 1757.
-
Fattore G (2010) Traveling for care. Inter-regional mobility for aortic valve substitution in Italy. Health policy 117: 90-97.
-
Tiebout CM (1956) A pure theory of local expenditure. Journal of Political Economy 64(5): 416-424.
-
Delil S, Çelik NR, San S, Dundar M (2017) Clustering patient mobility patterns to assess effectiveness of health-service delivery. BMC Health Services Research 17: 458.
-
Pierini E, Pioppo M, Troiano G, Casucci P, Checconi O, et al. (2015) Patient mobility for bone marrow transplant. The experience of the Perugia Hospital, years 2000- 2013. Ann Ig 27(5): 769-776.
-
Victor A (2012) Determinants of patient choice of healthcare providers: a scoping review. BMC Health Services Research 12(1): 272.
-
Aggarwal A, Lewis D, Mason M, Sullivan R, Van der Meulen J (2017) Patient Mobility for Elective Secondary Health Care Services in Response to Patient Choice Policies: A Systematic Review. Medical care research and review: MCRR 74(4): 379-403.
-
Howell EA, Gardiner N, Concato J (2002) Do women prefer Female Obstetrician? Obstetrics and Genecology 99(6): 1031-1035.
-
Schnatz PF, Murphy JL, Sullivan DM, Sorosky JI (2007) Patient choice: comparing criteria for selectin an obstetrician-gynecologist based on image, gender and professional attributes. American Journal of Obstetrics and Ginecology 197(5): 548-654.
-
Fotaki M (2008) What benefits will choice bring to Patients? Literature Review and Assessment of Implication. Journal of Health Services Research and Policy 13 (3): 178-184.
-
Mafrolla E, D’Amico E (2013) Patients’ mobility as an indicator for (in) efficiency: panel data analysis on Italian health care authorities. Health economics review 3(1): 3.
-
Neri S (2015) Interregional Patient Mobility in the Italian NHS: A Case of Badly-Managed Decentralization Comment on “Regional Incentives and Patient Cross- Border Mobility: Evidence From Italian Experience. Int J Health Policy Manag 4: 857-859.
-
Addari P, Nante N, Giannuzzi P, Ngoyi Ngongo K, De Bedin C, et al. (1995) Studio della mobilità sanitaria relativo al bacino di utenza del Policlinico Senese. Atti sez. Toscana S.I.t.I Firenze pp: 51-59.
-
Nante N, Guarducci G, Lorenzini C, Messina G, Carle F, et al. (2021) Inter-Regional Hospital Patients’ Mobility in Italy. Healthcare 9(9): 1182.
-
Ferre F, de Belvis AG, Valerio L, Longhi S, Lazzari A, et al. (2014) Italy: health system review. Health Syst Transit 16(4): 1-68.
-
Gandy RJ (1981/a) The calculation of catchment populations within the national health service, Statistician 28: 29-37.
-
Gandy RJ (1981/b) The calculation of catchment populations within the national health service -reprise Forum. Statistician 30: 297-302.
-
Gandy RJ (1979) A graphical representation of the inter- relationship between districts. Hosp Health Serv Rev 75: 50-51.
-
Gandy RJ, Franci A, Guerrieri C, McClelland B (2001) Demonstrating Access to Public Services Diagrammatically. Int J Public Admin 34: 516-527.
- Capacity Constraints in Pediatric Inpatient Psychiatric Care: A Cross-Sectional Analysis of Bed Availability and Geographic Access in North Carolina
- Why Healthcare Analytics Still Optimizes the Wrong Things
- Coding, Coverage, and Care: The Infrastructure of Transgender Health Inequities
- The Effect of Classroom Attendance on Academic Achievement of Management and Leadership Discipline of Nursing Students at Instituto Superior Cristal and Universidade de Dili, Timor-Leste, 2024: A Case Study
- The Role of Social Bonds in Facilitating Shared Investments and Resource Allocation: Addressing the “Wrong Pocket Problem” in Public Health and Healthcare
- Social-Cultural Factors Contributing to Antimicrobial Resistance in Livestock Farmers and Community Households in Kayonza District, Rwanda