Spectrophotometric Determination of Lanthanum (III) and Some Rare Earths with Xylenol Orange
Xylenol orange reagent was used to complex lanthanum cations in aqueous solutions, where the solution was colourless before complexing, and when adding Xylenol orange, it turned violet at a wavelength of 578 μm at a pH of about 6, where it was adjusted using a buffer solution composed of acetic acid and sodium acetate. Between the lanthanum cation and the indicator in a ratio of 1:1, the resulting complex is very stable for a time of up to 180 minutes at a room temperature of approximately 25 °C. Sulphate ions, chlorides and nitrates did not affect the absorbance of the solution at different concentrations, while fluorides, oxalates and tartrate negatively affected in high quantities, and the presence of EDTA and NTA negatively affects complex formation and stability.
Introduction
Since xylenol orange was first prepared by KSrbl and others [1, 2, 3] as a metallochromic indicator of the “complexone type”, this reagent has widely been used by a number of investigators in complexometric titrations. However, only a few workers have applied this reagent to the spectrophotometric determination of metals; Cheng [4, 5, 6, 7, 8], and recently bitsmuth, by Onishi and Ishiwatari [9, 10], have thus determined zirconium, hafnium, iron and bismuth. The present investigation was undertaken to evaluate the applicability of xylenol orange as a spectrophotometric reagent for various metal cations. From the results, a new spectrophotometric method for the determination of lanthanum- (III) and of some rare earth elements is proposed. As in the other cases [4, 5, 6, 7, 8, 9], the molar ratio of the complex between rare earth and this reagent is also 1:1.
Experimental
Reagents
Stock solutions of rare earths were prepared separately by dissolving the purified oxide of rare earths (lanthanum, Cerium, neodymium and yttrium) and were standardized by EDTA titration, using xylenol orange as an indicator [10, 11, 12]. About 10-3M of a xylenol orange solution was prepared by dissolving Dottie XO reagent (Dojindo & Co., Kumamoto) in distilled water. According to Ueno [12, 13], this solution is stable for several months [14, 15].
Apparatus
All the absorption measurements were made with a Hitachi model EPU-2A spectrophotometer, using 1cm. cells.
Procedure
From zero to 100 ppm. Of one of the rare earths was transferred to a 25ml volumetric flask. (When lanthanum was to be determined, 1ml of a 0.5% solution of ascorbic acid was added to prevent oxidation of the lanthanum(III) to the ceric state).
Three to four milliliters of a xylenol orange solution and 15ml. of an acetate buffer solution (pH 6.1±0.1, 0.17M as acetate ions) were then added. After the mixture had been diluted to the mark with water and mixed, the absorbance of the solution was measured at the wavelengths mentioned below.
Results and Discussion
Absorption Spectra
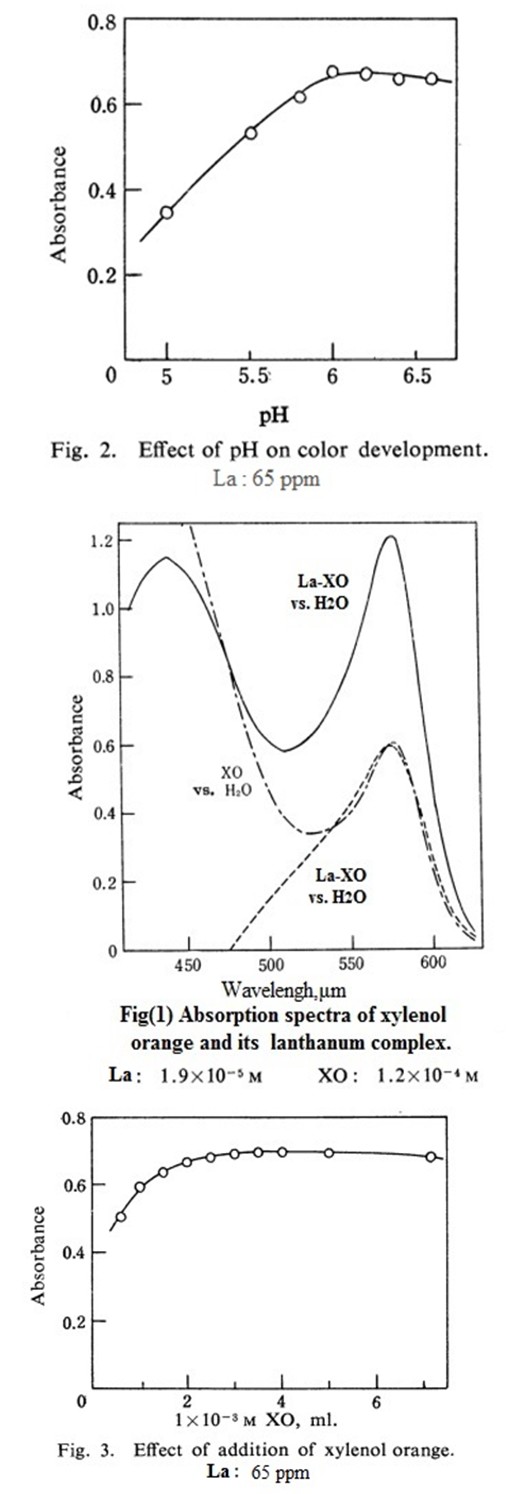
Figure 1 shows the absorption spectra of xylenol orange and its lanthanum complex at a pH of 6.1. Both the reagent and the complex have an absorption maximum at about 580 μm. When a correction for the reagent blank is applied, an absorption peak of the complex is found at 575 μm. A wavelength of 575μm, therefbre, has beenadopted in the determination of lanthanum. (At this wavelength the absorbance of the complex is about six times that of the reagent itself.) The complexes of lanthanum, neodymium and yttrium exhibit similar tendencies with the lanthanum complex. Their absorption peaks are found at 576 μm for lanthanum and 578 μm for neodymium and yttrium.
Effect of pH
The effect of pH on the color development of the lanthanum complex was studied with solutions varying in pH value from 4 to 7. Figure 2 shows that the maximum color development is obtained over the pH range of 6.0 to 6.5. Similar results are also obtained for the other rare earths.
Effect of Xylenol Orange
A practically constant absorbance is obtained by adding 3 to 5ml. of a 1×10⁻³M xylenol orange solution (Figure 3). Too large amounts of the dye tend to decrease the absorbance. It seems, therefore, that in the presence of a large excess of the dye, these rare earths may form a complex other than a 1:1 complex.
Stability of Complex
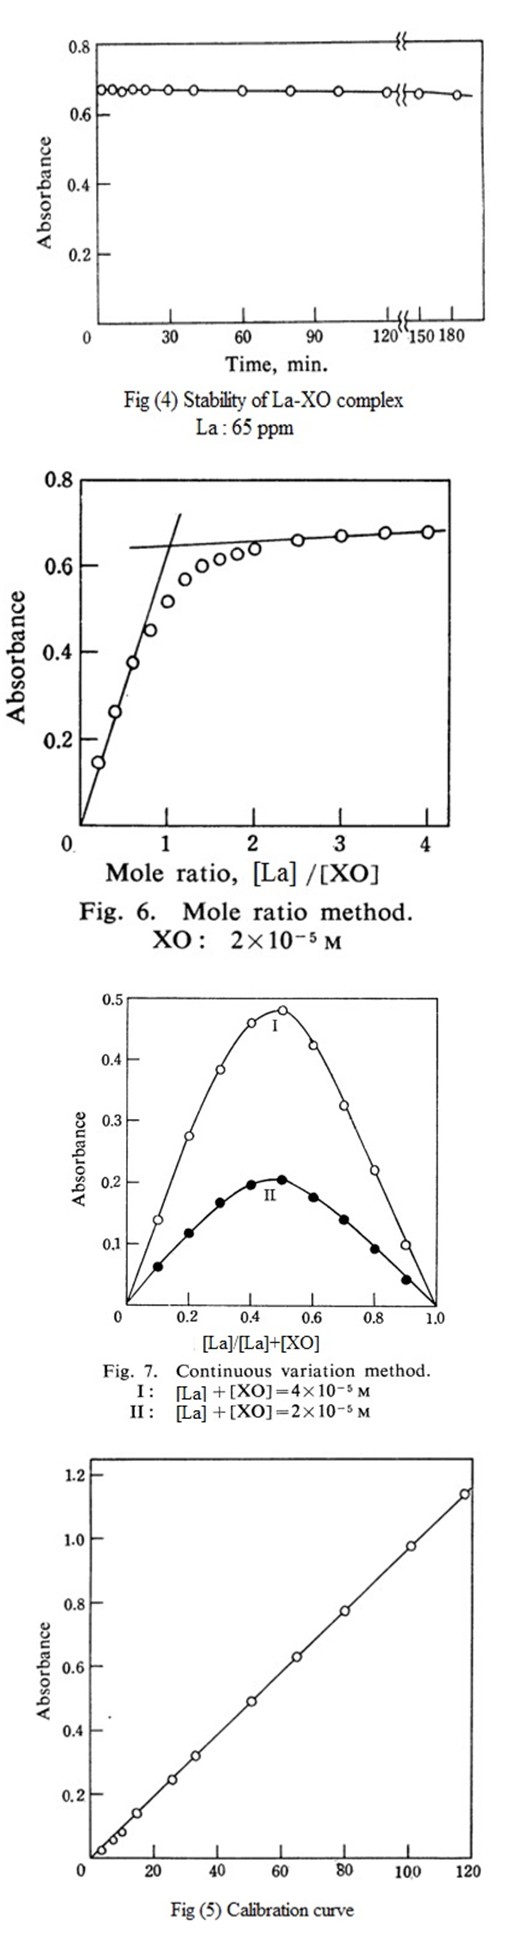
Figure 4 shows the stability of the colored complex of lanthanum. Since the color is stable at room temperature for at least 2hr., no particular attention need be paid to the time of standing.
Calibration Curve
As is shown in Figure 5, a linear relationship exists between the absorbance and the rare earth concentration over the range investigated. The optimum concentration range was then determined by Ringbom’s procedure [12] and was found to lie between 20 to 100 ppm lanthanum. At the measured wavelength, the molar extinction coefficients of the xylenol orange complexes of lanthanum, cerium, neodymium and yttrium are 32000, 31000, 38000 and 48000 respectively. From these high sensitivities, xylenol orange is found to be the most convenient reagent for spectrophotometric determination of trace amounts of rare earths.
Formation Constant
The mole ratio method and the continuous variation method (Job’s method) were applied to establish the mole ratio of the complex in solution. From Figures 6,7 it is evident that lanthanum forms a 1:1 complex with xylenol orange. The formation constant was calculated from the curves shown in Figure 7, based on the method described by Cheng [5] and et al. It was found to be 3×10⁵ at 25℃. Because of its low formation constant, it is easily understood why xylenol orange has been successfully used as an indicator in the EDTA titration of rare earths. Lanthanum, neodymium and yttrium also form a 1:1 complex with xylenol orange; their formation constants are calculated to be 7×10⁵, 1×10⁶ and 3×10⁵ respectively. These values are slightly lower than those of zirconium (5), hafnium (6) and bismuth-xylenol orange (8,9) complexes.
Effect of Anions
Table 1 indicates the effect of anions on the determination of lanthanum. Chloride, nitrate, sulfate and thiosulfate do not interfere. Large amounts of fluoride, oxalate, tartrate and citrate decrease the absorbance considerably. NTA (nitrilotriaceticacid) and EDTA, which may form a stable complex with the rare earths, seriously inhibit the color development of the complex.
| Anions | Lanthanum | ||
|---|---|---|---|
| Present | Added | Taken | Found |
| (μ mole) | (μ gram) | (μ gram) | |
| Chloride | 200 | 98.3 | 98.3 |
| 400 | 98.3 | 98 | |
| Fluoride | 2 | 95.5 | 90.3 |
| 6 | 95.5 | 81.7 | |
| 10 | 95.5 | 70.1 | |
| Nitrate | 200 | 98.3 | 98 |
| 400 | 98.3 | 98.3 | |
| Sulfate | 200 | 98.3 | 98.3 |
| 400 | 98.3 | 98.3 | |
| Oxalate | 2 | 96 | 83.1 |
| 6 | 96 | 75.2 | |
| Phosphate | 2 | 96 | 55.3 |
| 4 | 96 | 30.9 | |
| 6 | 96 | 12.1 | |
| Tartrate | 10 | 96 | 87.6 |
| NTA | 0.5 | 95 | 90.4 |
| 1 | 95 | 79.9 | |
| 1.5 | 95 | 54.5 | |
| EDTA | 0.01 | 95 | 78.6 |
| 0.05 | 95 | 42.3 | |
| 0.1 | 95 | 16.7 | |
| 0.2 | 95 | 1.2 |
Table 1: Effect of anions on Lanthanum determination.
Summary
A method has been described for the spectrophotometric determination of 20 to 100 ppm. of a rare earth element using xylenol orange. The complexes of lanthanum (III), cerium (III), neodymium(III) and yttrium(III) with xylenol orange have an absorption maximum at 575 to 578 μm vs. the reagent blank. Each of them is a 1:1 complex and has a formation constant of approximately 105 under the conditions studied. Anions such as NTA and EDTA inhibit the color development of the complexes.
References
-
Yoshimura J, Ohgo Y, Sato T (1961) Synthesis of D-Threosamine and D-Erythrosamine. Presented at the 14th Annual Meeting of the Chemical Society of Japan 34(8): 1197-1198.
-
Korbl J, Pribil R, Emr A (1957) Complexometric titrations (chelatometry) XXV. Xylenol orange as a new specific indicator. Collection Czech Chem Communs 22(3): 961- 966.
-
Korbl J, Pribil R (1956) Chemist Analyst. 46: 102.
-
Ueno K (1960) Chelate Titration. Nankodo, Tokyo pp: 328.
-
Ringdom AZ (1938) Anal Chem, 115: 332.
-
Vijayan S, Melnky AJ, Singh RD, Nuttall K (1989) Min Eng. 41: 13.
-
Ocana JA, Callejon M, Barragan FJ (2000) Terbium- sensitized luminescence determination of levofloxacin in tablets and human urine and serum. Analyst 125: 1851-1854.
-
Al-Kindy SMZ, Suliman FEO (2007) Determination of ibuprofen in pharmaceutical formulations using time-resolved terbium-sensitized luminescence. Luminescence 22(4): 294-301.
-
Ahmed IS, Amin AS, Issa YM (2006) The surfactant sensitized analytical reaction of cerium(IV) with some triphenylformazan derivatives. Spectrochimica Acta Part A: Molecular and Biomolecular Spectroscopy 64(1): 246-250.
-
Mohsen K (2008) PWASET 33, 2070.
-
Soylak M, Turkolu O (2000) Spectrophotometric determination of samarium (III) with chrome azurol S in the presence of cetylpyridinium chloride. Talanta 53(1): 125-129.
-
Preisler J, Jancar L, Sommer L (1993) The Spectrophotometric Determination of Elements with Chromazurol S in the Presence of Cetyltrimethylammonium Bromide and Triton X-100. I. The Determination of the Sum of the Rare Earth Elements. Collection of Czechoslovak Chemical Communications 58(7): 1495-1508.
-
Chowdary GP, Mohan Reddy KPPR, Krishna Reddy V, Raveendra Reddy P (2008) 2- Hydroxy-1- naphthaldehyde-_p_-hydroxybenzoic hydrazine as a spectrophotometric reagent for the determination of lanthanum(III) Indian Journal of Chemistry 47A: 1381- 1383.
-
Li-xin Z, Rong S, Hong-wen G (2003) Investigation of Surfactant-Stain-Metal Interaction: Naphthochrome Green/Cetyltrimethylammonium Bromide/Rare Earths Ternary Complexation. The Chinese Journal of Process Engineering 3(5): 1-8.
-
Tyagi S, Kumar R, Singh UP (2005) Solution Studies of Some Binary and Ternary Lanthanide Complexes. J Chem Eng Data 50(2): 377-382.
- Introduction and Sources of Molluscicides
- Trimetazidine: An Antianginal Drug and Not Only!
- Nature Inspired Discovery and Development of Antibacterials: An Update
- Fungal Biodegradation of Polycyclic Aromatic Hydrocarbons (PAHs)
- Recent Approaches of Impurity Profiling in Pharmaceutical Analysis: A Concise Review
- Next Generation Tools in mRNA Purification: The Role of Continuous Raman Spectroscopy Testing with Pretreatment of the Sample