Systematic Review and Meta-analysis Investigating the Prevalence of Depression, Anxiety, Loneliness and Help seeking among International Students
Objectives: To identify current data, research gaps, and forms of the prevalence of depression, anxiety, loneliness and help seeking among international students around the world. To present estimations outlining international students figures through systematic review and meta-analysis investigation. And to look at patterns in nations where data are available. Design: Systematic review and meta-analysis. Data sources: Data derived from various electronic databases, including JSTOR, PubMed, Wiley Online Library, ScienceDirect, Springer, and Sage Publishing. Eligibility requirements for chosen studies: Studies were considered eligible if they satisfied all of the requirements for inclusion, including the study population (international students enrolled in higher education), outcomes (depression, anxiety, loneliness, or help-seeking behaviour). Quantitative, qualitative, and mixed-methods studies were included, (enough information to calculate the prevalence of depression, anxiety, loneliness, or help-seeking behaviour). Methods: The Q statistic, which measures weighted squared deviations, T2, the between-studies variance, T, the betweenstudies standard deviation, and I2, which measures the ratio of true heterogeneity to total observed variance, were used to quantify heterogeneity in effect sizes, i.e., variation in the true effect sizes. Results: According to the analysis's findings using the random-effects model, the estimated prevalence of depression was 31.3%, with a 95% confidence interval (CI) of [24.4, 38.7]. The estimated prevalence of anxiety, or the summary effect size, was found to be 29.3%, with a 95% confidence interval (CI) of [22.6, 36.4]. And estimated prevalence of loneliness, or the summary effect size, was found to be 45.8%, with a 95% confidence interval (CI) of [39.0, 52.7]. In terms of estimated prevalence of help-seeking behaviour, or the summary effect size, was 15.1%, with a 95% confidence interval (CI) of [12.3, 18.0], based on analytical results from the random-effects model. Conclusion: A sizeable section of international students in many nations experiences problematic levels of depression, anxiety, loneliness with decreased number of those seeking help. results are constrained by the lack of data and methodological diversity.
Abbreviations
CI: Confidence Interval; PRISMA: Preferred Reporting Items for Systematic Reviews and Meta-Analysis; NOS: Newcastle- Ottawa Quality Assessment Scale; PHQ-9: Patient Health Questionnaire-9; DASS: Depression Anxiety Stress Scale; BDI-II: Beck Depression Inventory–II; GCS: Generalized Contentment Scale; GHQ-28: General Health Questionnaire – 28; HADS: Hospital Anxiety and Depressive Scale; CES-D: Center for Epidemiological Studies–Depression Scale; BHM- 20: Behavioral Health Measure-20.
Introduction and Literature Review
International education involves personal and academic development opportunities that students treat as exciting prospects. According to Oduwaye O, et al. [1], the path of international students contains substantial obstacles that combine cultural differences with language communication problems and the experience of living in physical isolation. These stressful conditions push people toward developing mental health problems, which include depression, anxiety, and loneliness [2, 3]. The global increase in international students does not match the existing knowledge about how common mental health issues are among them, as well as how these students seek help. The research investigates both the occurrence of depression and anxiety and feelings of loneliness among international students, together with their behavior toward getting assistance. By revealing these mental health problems, the study aims to aid the development of support programs that improve international student welfare.
Prevalence of Mental Health Issues
The evidence shows that international students face higher risks of developing mental health problems. The data indicates that international students suffer from depression and anxiety at rates higher than their domestic counterparts. At Southern Medical University in China, researchers discovered that depression afflicted 36% of international students, along with 52.63% who experienced [4, 5]. These high mental health rates among international students result mostly from academic stress combined with cultural differences and insufficient social friendships [3]. The mental health issues of international students become worse because of the feelings of being alone, which develop from being separated from loved ones.
Loneliness and its Impact
Social bonds are essential for human wellbeing, when this is not established, feelings of loneliness begin to develop. The experience of loneliness is widespread among studying abroad students because this social condition directly triggers depression and anxiety. Based on Corney T, et al. [2], international students usually experience social isolation symptoms after moving to a new cultural setting since they fail to connect with fellow students. Research shows that both mental health effects and performance decline accompanied by reduced quality of life result from experiencing [1, 6]. It is essential to address loneliness because doing so helps reduce its negative effects on international student welfare.
Help-Seeking Behaviors
Beyond the excitement of enrolling as an international student, one needs assistance and support when living abroad embarking on a new path. A large percentage of international learners show lower rates of consulting mental health professionals compared to students who are native to the host nation. As LaMontagne AD, et al. [7] explains, several obstacles prevent international students from seeking help, such as public disgrace, inadequate knowledge of resources, and discrepancies in mental health beliefs between cultures. International student help-seeking intentions receive significant influence from their subjective norms and opinions and perceived ability to control behavior, according to research that employs the Theory of Planned Behavior. To promote help-seeking behaviors, it is vital to increase mental health knowledge and fight social prejudices.
Interventions and Support Systems
Effective support for international students’ needs to address personal needs alongside structural improvements. Students’ mental health results improve substantially through culturally appropriate counseling mixed with membership programs and educational mental health resources [8]. Higher education institutions are essential in creating protected environments that support international students’ mental wellness [6, 7]. Organizations that unite peer- based assistance with community involvement strategies demonstrate high effectiveness in reducing student feelings of loneliness and promoting proper help-seeking channels.
Therefore, future research must emphasize studying the critical issue of international student mental health. The research investigates both mental health prevalence rates and barriers that prevent help-seeking in order to build new intervention programs. International students require fast intervention regarding mental support since it affects how students perform academically as well as their overall lifestyle quality.
Report
Objective of the Project
The objective of the project was to conduct a systematic review and meta-analysis for a)prevalence of depression among international students b) prevalence of anxiety among international students c) prevalence of loneliness among international students d)prevalence of help seeking among international students
Methods
Definitions of the 4 study variables
The study involved 4 variables, depression, anxiety, loneliness, and help-seeking behavior.
- Depression is a condition characterized by a sense of despair, isolation, avoidance, and poor self-esteem [9]. Symptoms associated with depression include lack of interest and pleasure from activity, detachment from social activity, loss of appetite, sleep disturbance, and feelings of worthlessness [10].
- Anxiety is a state of mind overwhelmed by unsafe, threatening, and unpleasant impacts due to stimulants experienced by individuals [11]. Anxiety is also described as a non-adaptive hypervigilance or a concern towards an unknown outcome [12].
- Loneliness is described as the unpleasant and distressing feeling resulted from the discrepancy between a person’s desired and attained levels of social relations [13]. In other words, loneliness is the subjective experience of a quantitative or qualitative deficiency in one’s social relationships [14].
- Help-seeking behavior is formal help-seeking that involves any action of energetically seeking help from professional health care services who have a legitimate and recognized professional role in providing relevant advice, support, and/or treatment (e.g., professional psychological services and mental health services) [15].
Search Strategy
The Preferred Reporting Items for Systematic Reviews and Meta-Analysis (PRISMA) statement was consulted to report this systematic review [16]. A comprehensive searching strategy was carefully designed to select eligible studies, published between January 1, 2013 and October 31, 2022, from multiple electronic databases, including JSTOR, PubMed, Wiley Online Library, ScienceDirect, Springer, and Sage Publishing. The search was performed by combining the following keywords: “international students” and (“depression” or “anxiety” or “loneliness” or “help seeking” or “psychological health” or “mental health”) without limitations on the publication type, but excluding languages other than English. According to Morrison A, et al. [17], there was no evidence of a systematic bias from the use of language restrictions in systematic review-based meta-analyses.
In addition, according to Jones JB, et al. [18] the average length of time from publication to the emergence of new evidence was about 6 years. Therefore, the search was limited to articles published between 2013 and 2022 to capture research on the recent prevalence of depression, anxiety, loneliness, and help-seeking behavior for international students. The references listed in each identified article were also screened and manually searched to make the results more comprehensive. Authors of conference abstracts were contacted for full text publications, if available. The work was done by the researcher solely.
Study Selection, Inclusion and Exclusion Criteria
The researcher solely assessed articles potentially relevant for eligibility. After removing duplicates, the researcher reviewed all abstracts returned from the literature search and selected articles for full-text reading based on the inclusion and exclusion criteria. The selected full-text articles were downloaded and reviewed by the researcher. Eligible studies were included if they met the inclusion criteria for the study population (international students in higher education), outcomes (depression, anxiety, loneliness, or help-seeking behavior), study methods (quantitative, qualitative, and mixed-methods studies) and statistics (sufficient data to allow calculation of prevalence of depression, anxiety, loneliness, or help-seeking behavior).
Specifically, studies were included if they had a primary focus on international students in higher education. As such, studies that focused on domestic students or studies that did not distinguish results between domestic and international students were excluded. Articles were included if they provided results addressing depression, anxiety, loneliness, or help-seeking behavior directly and were excluded if they were only referred to in the context of general psychological distress (or similar). As the primary focus of the review was on depression, anxiety, loneliness, and help-seeking behavior, not the broader well-being construct, articles addressing well-being were only included if they also included specific reference to depression, anxiety, loneliness, or help-seeking behavior.
Finally, articles were restricted to English language, peer-reviewed journal, conference proceedings or PhD dissertations, and quantitative, qualitative (with sufficient descriptive statistics), or mixed methodologies. Encyclopedia, editorials, comments/discussion, qualitative research without sufficient descriptive statistics, practice guidelines, appendices, and literature reviews, were excluded.
Data Extraction
The researcher extracted the following information from the included articles: first author, year of publication, research method, research design, target population, sample, sampling method, host country, ages, years in the host country, total number of subjects surveyed, total number of subjects responded, total number of international students, instruments used and the scoring rules for the outcome measures (i.e., depression, anxiety, loneliness, and help-seeking behavior), and number of subjects for each event of interest (i.e., depression, anxiety, loneliness, and help-seeking behavior). In the event more information was needed (e.g., frequency counts (or percentages) were only provided for severe depression but not for moderate level of depression), the corresponding author(s) of the original paper were contacted.
Study Quality Appraisal
The quality of the studies selected for retrieval was assessed using the Newcastle-Ottawa quality assessment scale (NOS), adapted for cross sectional studies [19, 20]. The adapted form of NOS for cross sectional studies (see Table 1) contains seven items, categorized into three dimensions including selection, comparability, and outcome, to evaluate risk of bias for a study. For each item a series of response options is provided. The total score of the adapted form of NOS can be obtained by summing the scores of each item. The total score ranged from 0-9, with higher scores indicating lower risk of bias. Specifically, studies were considered to have a low, medium or high risk of bias if they scored 7-9 points, 5-6 points, and 4 points or less, respectively [21].
| Dimension | Scoring options |
|---|---|
| Selection (maximum 5 points) | |
| Representativeness of the cases | 1 point was given if the sample was truly representative of the average in the target population (all subjects or random sampling) or somewhat representative (non-random sampling); 0 point was given otherwise. |
| Sample size | 1 point was given if sample size was justified and satisfactory; 0 point was given otherwise. |
| Non-respondents | 1 point was given if comparability between included and non-included subjects was established, and if the response rate was satisfactory; 0 point was given otherwise. |
| Ascertainment of the survey tool | 2 points were given if secure record (medical charts) or validated measurement tool was used, |
| 1 point was given if self-report was used; 0 point was given if no description of measurement tool. | |
| Comparability (maximum 1 point) | |
| Demographic information | 1 point was given if description of the sample demographics was provided; 0 point was given otherwise. |
| Outcome (maximum 3 points) | |
| Assessment of outcome | 2 points were given if the measures of outcomes were assessed independently and blindly or from record linkage (database records);1 point was given if the outcome was assessed by self-report; 0 point was given otherwise. |
| Statistical analysis | 1 point was given if the statistical test used to analyze the data was clearly described and appropriate; 0 point was given otherwise. |
Table 1: Newcastle-Ottawa quality assessment scale (adapted for cross sectional studies).
Statistical analysis
Data were compiled in and analyzed using Microsoft Excel 2019. As the data collected were frequency counts, proportion (i.e., prevalence), the variance of proportion, and the associated 95% confidence interval (CI) were computed to represent the effect sizes to assess the consistency of the effect across studies and to compute a summary effect [22].
Note that all computations related to effect sizes were carried out after applying the arcsine transformation for proportions and the results were converted back to the original metric [23].
Heterogeneity in effect sizes, i.e., variation in the true effect sizes, was quantified using the following statistics, the Q statistic (a measure of weighted squared deviations), T_2 (the between-studies variance), _T (the between-studies standard deviation), and _I_2 (the ratio of true heterogeneity to total observed variance) [22].
The Q statistic is defined as ( ) 2 1 k i i i Q W Y M = = − ∑ , where i W is the study weight, iY is the study effect size (in terms of proportion), M is the summary effect, and k is the number of studies (See the computation for summary effect for the fixed-effect model for more details of how to obtain i W and M) [24]. The value Q is weighted sum of squares, which is a measure of weighted squared deviations reflecting the total dispersion. Under the null hypothesis that all studies share a common effect size, Q follows a central chi-squared distribution with degrees of freedom equal to k – 1. A p-value less than 0.05 for the Q statistic would lead to a rejection of the null hypothesis and provide evidence that the true effects vary, and hence we can conclude that the studies do not share a common effect size.
The between-studies variance 2 T is the estimation of the variance of the true effect sizes τ2, and is defined
2 Q df T c − = , where (Q-df) represents the dispersion in true effects on a standardized scale, which reflects the excess dispersion. Since Q is the observed weighted sum of squares and df is the expected weighted sum of squares (under the assumption that all studies share a common effect), the difference, Q – df, reflects the excess variation, the part that will be attributed to differences in the true effects from study as = = = = −∑ ∑ ∑ , with a purpose of putting the measure back to the original metric. This method of estimating the variance between studies is known as the method of moments or the DerSimonian and Laird method [25] T, the estimate of the actual standard deviation τ, is simply the square root of 2 T . This is 2 T T = . T can be used to describe the distribution of the effects size and how wide spread the range of the true effect sizes is (i.e., the dispersion of true effect sizes).
2 1 1 1 k i i k i i k i i
W C W W to study. The quantity C is computed as The _I_2 statistic, proposed by Higgins JP, et al. [26], measures the proportion of the observed variance reflecting real differences in effect size. The _I_2 is computed as
2 *100% Q df I Q − = . _I_2 is interpreted as the proportion of total variation in study estimates due to heterogeneity rather than sampling error, and hence can be viewed as a measure of inconsistency. Higgins JP, et al. [26] suggest that values on the order of 25%, 50%, and 75% might be considered as low, moderate, and high, respectively. Fifty percent is often used as a cutoff for heterogeneity.
To assess the heterogeneity in meta-analysis is a crucial issue because the presence of heterogeneity can affect the statistical model to be applied to the meta-analytic data [25, 27, 28, 29]. There are two popular statistical models for meta-analysis, the fixed-effect model and the random-effects model [22, 23]. Under the fixed-effect model, it is assumed that all studies in the analysis share the same true effect size and that all differences in observed effects are due to sampling error, and hence the summary effect is the estimate of this common effect size [22, 30]. Under the random-effects model, it is assumed that the true effect size varies from study to study, and the summary effect is an estimate of the mean of the distribution of effect sizes [22, 30].
Therefore, in this study, when the studies’ results only differ by the sampling error (i.e., no significant heterogeneity), a fixed-effect model can be applied to obtain an estimate of the common effect size. By contrast, if the study results differ by more than the sampling error (i.e., significant heterogeneity), then a random-effects model, in order to take into account both within- and between-studies variability, is applied to obtain an estimate of the mean of the distribution of effect sizes [22, 25, 27, 28, 29, 30]. In this study, the computation of the summary effects for fixed-effect model and random-effects model followed the steps discussed in Chapter 11 (pp. 63-67) for estimating the summary effect using a fixed-effect model and Chapter 12 (pp. 68-75) for estimating the summary effect using a random-effects model in Borenstein M, et al. [22].
In particular, under the fixed-effect model, the weighted mean M, i.e., the summary effect size, can be estimated as = = ∑ ∑ . Note that i W is the weight assigned to each study in a fixed-effect analysis with 1/ i i Y W V = where i Y V is k i i i k i i WY M W
1 =
1 the within-study variance for study i (i.e., i Y V is the estimated variance of the observed effect size for study i). The variance
1 M k i i V W = = ∑ , and the estimated standard error of the summary effect is of the summary effect size is estimated as 1 M M SE V = . Following that, the 95% lower and upper limits ( M LL vs. M UL ) for the summary effect can be estimated as * M M LL M Z SE = − and * M M UL M Z SE = + , where Z is the upper (1-α)/2 critical value for the standard normal distribution. For a 95% confidence interval (α = 0.05), the critical value for the standard normal distribution 1.96. Also, Z-value to test the null hypothesis that the common true effect is zero can be computed using / M Z M SE = .
Under the random-effects model, the weight assigned to each study is * * 1/ i i Y W V = , where * i Y V is defined as the sum of the within-study variance for study i ( ) i Y V and the between- studies variance ( ) 2 T . The weighted mean M*, i.e., the = = ∑ ∑ , * 1 * 1 * k i i i k i i W Y M W = summary effect size, can be estimated as * i W is the weight assigned to each study in a random- effects analysis. The variance of the summary effect size is where
1 k M i i V W = = ∑ , and the estimated standard estimated as * * 1
error of the summary effect is * * M M SE V = . Following
that, the 95% lower and upper limits ( ) * * M M LL vsUL for the summary effect can be estimated as * * * * M M LL M Z SE = − and * * * * M M UL M Z SE = + , where Z is the upper (1-α)/2 critical value for the standard normal distribution. For a 95% confidence interval (α = 0.05), the critical value for the standard normal distribution 1.96. Finally, a Z-value to test the null hypothesis that the common true effect is zero can be computed using * * / M Z M SE = . Without further specification, for any tests, a p-value less than 0.05 was an indication of statistical significance. All p-values were two sided.
Analysis Results
Study Selection
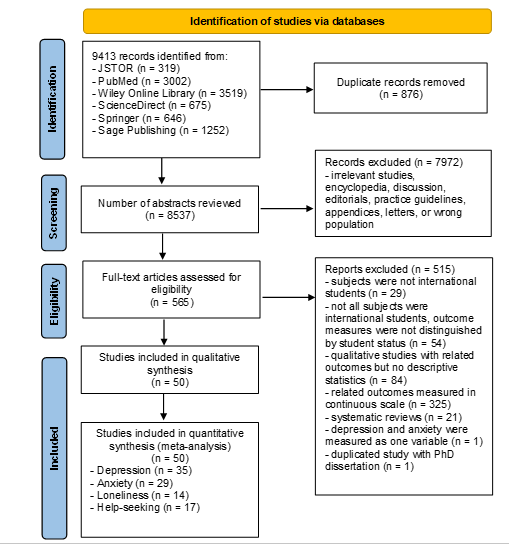
The systematic search identified 9413 references across all databases, of which 8537 were screened after duplicates were removed. Titles and abstracts were screened for the 8537 articles and 7972 did not fulfil inclusion criteria based on titles and abstract. Full-text review was conducted on 565 manuscripts and 515 were excluded at this step. 50 papers fulfilled inclusion criteria for the systematic review and meta-analysis and reported prevalence data for at least one outcome of interest (n = 35 for depression, n = 29 for anxiety, n = 14 for loneliness, and n = 17 for help-seeking behavior). The study selection process is briefly described in the PRISMA flow diagram (Figure 1).
Characteristics of the Selected Studies
Table 2 summarizes the characteristics of the 50 selected studies. Each study reported at least one outcome measure of interest. Majority of the studies (n = 38) were quantitative studies, 2 were qualitative studies with descriptive statistics, and 10 were mixed-methods studies. All the quantitative and mixed-methods studies utilized cross-sectional surveys for data collection. The mixed-methods studies also implemented interviews (n = 6), focus groups (n = 2), and open-ended questions (n = 3) to collect qualitative data. The two qualitative studies collected data via interviews and open-ended questions.
| Study | Outcomes | Research method | Research design | Target population | Sampling method | Host country | Ages | Years in host country | N surveyed | N valid responses |
|---|---|---|---|---|---|---|---|---|---|---|
| Alam MD, et al. [31] | depression, anxiety, loneliness | quantitative | cross-sectional survey study | international university students in China | snowball sampling | China | 18-40 | 35.3% > 3 years | 428 | 402 |
| AlKrenawi A, et al. [32] | depression, anxiety | quantitative | cross-sectional survey study | female Saudi Arabian students enrolled in US colleges and universities | convenience sampling | US | 17-58 | 1-27 years | 84 | 84 |
| Atherton K, et al. [33] | help seeking | mixed methods | cross-sectional survey + open-ended questions | Chinese international university students in New Zealand | convenience sampling | New Zealand | 17-26+ | 62.4% > 1 year | 838 | 205 |
| Barreira P, et al. [34] | depression, anxiety, help seeking | quantitative | cross-sectional survey study | PhD students in the Economics departments of US universities | convenience sampling | US | 20-35+ | 1-6+ years | 1185 | 513 (238 domestic + 275 international) |
| Bathke A, et al. [35] | depression, anxiety, loneliness | quantitative | cross-sectional survey study | students participated in study abroad through the Learning Abroad Center of the University of Minnesota | purposeful sampling | Europe, America, Oceania, Asia, Africa/Middle East | 18+ | NA | 7191 | 613 |
| Chae D, et al. [36] | depression, anxiety, loneliness | quantitative | cross-sectional survey study | international university students in South Korea | convenience sampling | South Korea | Mean = 24.91 | NA | 165 | 165 |
| Chen H, et al. [37] | help seeking | quantitative | cross-sectional survey study | Chinese international university students in US | convenience sampling | US | 18-30 | 0-3+ years | 113 | 110 |
| Clough BA, et al. [38] | help seeking | quantitative | cross-sectional survey study | university students in Australia | convenience sampling | Australia | 17-52 | 0-3+ years | 357 | 357 (148 domestic + 209 international) |
| Clough BA, et al. [39] | help seeking | quantitative | cross-sectional survey study | international tertiary students (undergraduate + postgraduate) in Australia | convenience sampling | Australia | 17-52 | 0-3+ years | 67 | 45 |
| Gülnar B, et al. [40] | depression | quantitative | cross-sectional survey study | international university students in Turkey | purposeful sampling | Turkey | mean = 21.95 | mean = 3.34 years | 283 | 283 |
| Han X, et al. [41] | depression, anxiety | quantitative | cross-sectional survey study | Chinese international students at Yale university | convenience sampling | US | 18-39 | NA | 364 | 130 |
university students in South Korea
Jiang X, et al. [42] depression quantitative cross-sectional survey study Jones-White DR, et al. [43]
depression, anxiety quantitative cross-sectional survey study doctoral students in US random sampling US 18-73 NA 2582 international university students in Malaysia depression, anxiety, help seeking quantitative cross-sectional survey study Kahwa KM, et al. [44]
international university students in Australia
cross-sectional survey + follow-up interviews depression, anxiety, loneliness Kambou- ropoulos A [45]
mixed methods cross-sectional survey + focus group discussions international university students in Malaysia Khosravi R, et al. [46] depression, anxiety mixed methods international university students in South Korea Kim HR, et al. [47] depression, anxiety quantitative cross-sectional survey study depression, anxiety, loneliness quantitative cross-sectional survey study university students in Netherlands Kivelä L, et al. [48]
international university students in UK or USA
Lai AYK, et al. [49] depression quantitative cross-sectional survey study international university students in China Larnyo E, et al. [50] depression, anxiety quantitative cross-sectional survey study interview + online survey with open-ended questions Lefdahl Davis EM, et al. [51]
Saudi women international students
loneliness, help seeking qualitative cross-sectional survey + open-ended questions Asian international university students Li P, et al. [52] help seeking mixed methods cross-sectional survey + open-ended questions Chinese international university students in US Lian Z [53] depression, anxiety, help seeking mixed methods international students studying medicine in China Lu L, et al. [54] depression quantitative cross-sectional survey study international students in the health professions Mahihu C [4] depression, anxiety quantitative cross-sectional survey study snowball sampling South Korea mean = 24.02 NA 533 533
2582 (1768 domestic + 814 international students) purposeful sampling Malaysia 18-35 NA 280 280 convenience sampling Australia mean = 23.9 NA 90 (survey) 90 convenience sampling Malaysia 18-64 NA 60 (survey) 60 snowball sampling South Korea 20-30+ NA 488 488
349 (180 domestic + 169 international students) purposeful sampling Netherlands mean = 21 NA 374 snowball sampling UK or US 18-25+ NA 124 124 purposeful sampling China 18-42 0-5+ years 480 474 purposeful sampling US 20-35 1-3+ years 25 25 convenience sampling US 18-47 NA 177 177 purposeful sampling US mean = 23.75 NA 389 222 purposeful sampling China mean = 22.76 NA 1030 519 purposeful sampling China 18-44 0-5 years 114 114
international university students in US
depression, anxiety, loneliness quantitative cross-sectional survey study Maleku A, et al. [55]
university students in China and Africa (Chinese in China, Africans in China, Africans in Africa) Marahwa P, et al. [56] depression, anxiety quantitative cross-sectional survey study university students in Canada de Moissac D, et al. [57] depression, anxiety quantitative cross-sectional survey study international university students in Australia Morris A, et al. [58] loneliness quantitative cross-sectional survey study international students from a country with difficult socio-political environment than Australia cross-sectional survey + focus group discussions + interviews Nahidi S [59] help seeking mixed methods international university students in Malaysia Nasir MAM, et al. [60] help seeking quantitative cross-sectional survey study Asian international university students Negrete V [61] help seeking quantitative cross-sectional survey study international university students in Japan Nguyen MH, et al. [62] depression quantitative cross-sectional survey study depression, anxiety, loneliness quantitative cross-sectional survey study international students convenience sampling US 18-46 NA 168 168 Poyrazli S [63]
depression, anxiety, help seeking quantitative cross-sectional survey study U.S. students studying abroad purposeful sampling Italy 69% under 21 years old NA 111 111 Poyrazli S, et al. [64]
international and domestic university students in Canada
Rosa D, et al. [65] depression, anxiety quantitative cross-sectional survey study depression, anxiety, loneliness, help seeking university students in Australia quantitative cross-sectional survey study Sanci L, et al. [66]
purposeful sampling US mean = 27.8 NA 835 103
purposeful sampling China 98% < 35 years NA 636 636
932 (722 domestic + 210 international students) convenience sampling Canada mean = 24 NA 5000 all international students in the 43 higher education institutions in Sidney and Melbourne, Australia purposeful sampling Australia 18-30+ NA
7084 convenience sampling Australia 18-40 0-3 years 180 (survey) 180
convenience sampling Malaysia 18-28+ 1-5+ years 23 23
snowball sampling US 18-40 0-2 years 236 78
268 (67 domestic + 201 international) convenience sampling Japan 17-20+ 0-3+ years 268
4640 (4035 domestic + 605 international) random sampling Canada 18-30+ NA 15000
14880 (9398 domestic + 5482 international students) convenience sampling Australia mean = 24 NA 56375
international university students in Malaysia
cross-sectional survey + semi- structured interviews Saravanan C, et al. [67] depression, loneliness mixed methods
- university students in
- Australia
- Schofield MJ, et al. [68] depression quantitative cross-sectional survey study international university students in US
- Shadowen N, et al. [69] depression, anxiety quantitative cross-sectional survey study international university students from war and conflict zones
- Snoubar Y
- [70] help seeking quantitative cross-sectional survey study
- Chinese international university students in US
- Song B, et al.
- [71] depression, anxiety quantitative cross-sectional survey study
- Sustarsic M, et al. [72] loneliness qualitative interviews international graduate students in US
- Chinese international university students in Japan
- Teng Y, et al.
- [73] loneliness quantitative cross-sectional survey study
- Chinese international students in community colleges in US cross-sectional survey + interviews
- Tu D [74] help seeking mixed methods international university students in
- Australia cross-sectional survey + interviews
- Udah H, et al. [75] depression, anxiety mixed methods
- Indian international university students in
- Canada cross-sectional survey + interviews
- Varughese A, et al. [76] depression, anxiety mixed methods
- Asian international university students in US
- Xiong Y, et al.
- [77] help seeking quantitative cross-sectional survey study
- Asian international university students in US depression, anxiety, loneliness quantitative cross-sectional survey study
- Xiong Y, et al.
- [78] international medical students in China
- Yuan LL, et al. [79] depression, anxiety quantitative cross-sectional survey study
Table 3: Study descriptions.
The target populations were either university students (including both domestic and international students) or international students. The sampling methods utilized in these studies included snowball sampling (n = 7), random purposeful sampling Malaysia 19-21 NA 520 29
800 (696 domestic + 104 international) random sampling Australia 18-26+ NA 5000
purposeful sampling US Mean = 24.9 46% <= 2 years 1991 490
Demographic questionnaire issued, no results reported in the article purposeful sampling Turkey NA 121 63 snowball sampling US 19-23+ NA 291 261 purposeful sampling US 23-37 mean = 2.5 years 20 20 snowball sampling Japan mean = 24.67 mean = 35.31 months 307 305 convenience sampling US 18+ 2 months to 84 months 39 39 convenience sampling Australia 18-45 NA 58 (survey) 58 convenience sampling Canada 75% were 18-25 NA 1000 600
97259 (3701 Asian international students)
97259 (3701 Asian international students)
random sampling US mean = 22.15 NA
97259 (3701 Asian international students)
97259 (3701 Asian international students)
random sampling US mean = 22.15 NA
purposeful sampling China 16-42 NA 1030 550
sampling (n = 5), purposeful sampling (n = 18), and convenience sampling (n = 20). US (n = 18), Australia (n = 8), and China (n = 6) were the top three host countries. Almost all studies (n = 49) reported ages of the participants.
Only 19 studies reported how long study participants have been in the host countries. The sample size of the studies (international students only) ranged from 20 to 5482.
Of the 50 studies, 35 reported data for prevalence of depression. Table 3 summarized the instruments and the associated scoring instructions and criteria used to determine depression for each study. Patient Health Questionnaire-9 (PHQ-9) [80] (n = 12), Depression Anxiety Stress Scale (DASS-21) [81] (n = 4), and Beck Depression Inventory–II (BDI-II) [82] (n = 3) were the most commonly utilized instruments for measuring depression. Other instruments utilized to measure depression included: Patient Health Questionnaire-2 (PHQ-2) depression screener [83, 84] (n = 2), Generalized Contentment Scale (GCS) [85] (n = 1), General Health Questionnaire – 28 (GHQ-28) [86] (n = 1), Patient Health Questionnaire-4 (PHQ-4) [87] (n =
1), Hospital Anxiety and Depressive Scale (HADS) [88] (n = 1), and the 20-item Center for Epidemiological Studies– Depression Scale (CES-D) [89] (n = 1). The remaining studies (n = 9) utilized a single item to measure depression, including
- One Likert-scale item from the Behavioral Health Measure-20 (BHM-20) [90] (symptoms of depression),
- one Likert-scale question regarding social and psychological issues – depression
- yes/no questions such as a) mental health symptoms (depression) during the last month, b) any experiences of depression in the twelve months (from Retrospective Depression, Anxiety, and Major life Events scale (R-DA- MLES-12) [91], c) depression diagnosis, d) depression in the past year, e) experiencing the psychological symptom/concern – depression, f) diagnosis of depression in the last 12 months, and g) felt depression during the pandemic.
| Depression | |||
|---|---|---|---|
| Study | Instrument | Scoring | Indication of depression |
| Alam MD, et al. [31] | DASS-21 | The depression subscale consists of items 3, 5, 10, 13, 16, 17, and 21 with scores ranging from normal (0–9), mild (10–13), moderate (14– 20), severe (21–27), to extremely severe (28+). | DASS-21 depression scale score ≥ 14 |
| AlKrenawi A, et al. [32] | BDI-II | Beck AT, et al. [82] suggested the cut score guidelines for the total scores as follows: 0–13 (minimal), 14–19 (mild), 20–28 (moderate), and 29–63 (severe). A cut off of 20 was used as an indication of depression. | BDI-II score ≥ 20 |
| Barreira P, et al. [34] | PHQ-9 | The total scores can range from 0 to 27, with scores indicating minimal or none (0–4), mild (5–9), moderate (10–14) or severe (≥15) depression levels, respectively. A PHQ-9 score of 10 or higher is regarded as a cut- off point, with a sensitivity of 88% for major depression. | PHQ-9 score ≥ 10 |
| Bathke A, et al. [35] | one Likert-scale item from BHM-20 (symptoms of depression) | 5-point Likert scale (never/rarely/ sometimes/often/almost always) | response = sometimes/ often/almost always |
| Chae D, et al. [36] | one yes/no question (Mental health symptoms (depression) during the last month) | yes/no | response = yes |
| Gülnar B, et al. [40] | GCS | The GCS is a 25-item self-rating instrument, each statement on a 5-point scale ranging from “rarely or none of the time” (1) to “most or all of the time” (5). Answers | GCS score ≥ 2.61 |
| ranged one to five therefore 0.80 (4/5= 0.80) range was used in staging: 1.00-1.80 = very low; 1.81- 2.60 = low; 2.61-3.40 = midpoint; 3.41-4.20 = high; 4.21-5.00 = very high. | |||
| Han X, et al. [41] | PHQ-9 | The total scores can range from 0 to 27, with scores indicating minimal or none (0–4), mild (5–9), moderate (10–14) or severe (≥15) depression levels, respectively. A PHQ-9 score of 10 or higher is regarded as a cut- off point, with a sensitivity of 88% for major depression. | PHQ-9 score ≥ 10 |
| Jiang X, et al. [42] | PHQ-9 | The total scores can range from 0 to 27, with scores indicating minimal or none (0–4), mild (5–9), moderate (10–14) or severe (≥15) depression levels, respectively. A PHQ-9 score of 10 or higher is regarded as a cut- off point, with a sensitivity of 88% for major depression. | PHQ-9 score ≥ 10 |
| Jones-White DR, et al. [43] | PHQ-2 | The response options included “not at all (0),” “several days (+1),” “more than half the days (+2),” and “nearly every day (+3).”. Summed the two items and use a cut-point of 3 recommended by Kroenke K, et al. [80]. | PHQ-2 score ≥3 |
| Kahwa KM, et al. [44] | DASS-21 | The depression subscale consists of items 3, 5, 10, 13, 16, 17, and 21 with scores ranging from normal (0–9), mild (10–13), moderate (14– 20), severe (21–27), to extremely severe (28+). | DASS-21 depression scale score ≥ 14 |
| Kambouropoulos A [45] | one Likert-scale question (social and psychological issues - depression) | never a problem, has been a problem, ongoing problem | depression “has been a problem” or is an “ongoing problem” |
| Khosravi R, et al. [46] | GHQ-28 | severe depression (Items 22-28): For every item, there are 4 probable answers on hand (0-not at all, 1-no more than usual, 2-rather more than usual, 3-much more than usual). | Based on GHQ-28 subscale - severe depression (Items 22-28) (cut-off value for the subscale was not mentioned in the study) |
| Kim HR, et al. [47] | PHQ-9 | The total scores can range from 0 to 27, with scores indicating minimal or none (0–4), mild (5–9), moderate (10–14) or severe (≥15) depression levels, respectively. A PHQ-9 score of 10 or higher is regarded as a cut- off point, with a sensitivity of 88% for major depression. | PHQ-9 score ≥ 10 |
| Kivelä L, et al. [48] | BDI-II | Beck AT, et al. [82] suggested the cut score guidelines for the total scores as follows: 0–13 (minimal), 14–19 (mild), 20–28 (moderate), and 29–63 (severe). A cut off of 20 was used as an indication of depression. | BDI-II score ≥ 20 |
| Lai AYK, et al. [49] | PHQ-4 | Total score is determined by adding together the scores of each of the 4 items. Scores are rated as normal (0-2), mild (3-5), moderate (6-8), and severe (9-12). Total score ≥3 for first 2 questions suggests anxiety. Total score ≥3 for last 2 questions suggests depression. Löwe B, et al [87] recommends a cut-off score of 6 for the total score. | PHQ-4 score ≥ 6 |
| Larnyo E, et al. [50] | PHQ-9 | The total scores can range from 0 to 27, with scores indicating minimal or none (0–4), mild (5–9), moderate (10–14) or severe (≥15) depression levels, respectively. A PHQ-9 score of 10 or higher is regarded as a cut- off point, with a sensitivity of 88% for major depression. | PHQ-9 score ≥ 10 |
| Lian Z [53] | one one yes/no question of R-DA-MLES-12 (any experiences of depression in the twelve months) | yes/no | response = yes |
| Lu L, et al. [54] | PHQ-9 | The total scores can range from 0 to 27, with scores indicating minimal or none (0–4), mild (5–9), moderate (10–14) or severe (≥15) depression levels, respectively. A PHQ-9 score of 10 or higher is regarded as a cut- off point, with a sensitivity of 88% for major depression. | PHQ-9 score ≥ 10 |
| Mahihu C [4] | HADS | The questionnaire contains 14 questions, with seven items related to depression and another seven related to anxiety. Each item has a score ranging from 0 - 3. Thus, depending on the level of depression and anxiety, the scores can vary from 0 - 21. The cut-off score for each subscale is a score greater or equal to 8. | HADS score ≥ 8 |
| Maleku A, et al. [55] | PHQ-9 | The total scores can range from 0 to 27, with scores indicating minimal or none (0–4), mild (5–9), moderate (10–14) or severe (≥15) depression levels, respectively. A PHQ-9 score of 10 or higher is regarded as a cut- off point, with a sensitivity of 88% for major depression. | PHQ-9 score ≥ 10 |
| Marahwa P, et al. [56] | PHQ-9 | The total scores can range from 0 to 27, with scores indicating minimal or none (0–4), mild (5–9), moderate (10–14) or severe (≥15) depression levels, respectively. A PHQ-9 score of 10 or higher is regarded as a cut- off point, with a sensitivity of 88% for major depression. | PHQ-9 score ≥ 10 |
| de Moissac D, et al. [57] | one yes/no question (depression in the past year) | yes/no | response = yes |
| Nguyen MH, et al. [62] | PHQ-9 | The total scores can range from 0 to 27, with scores indicating minimal or none (0–4), mild (5–9), moderate (10–14) or severe (≥15) depression levels, respectively. A PHQ-9 score of 10 or higher is regarded as a cut- off point, with a sensitivity of 88% for major depression. | PHQ-9 score ≥ 10 |
| Poyrazli S [63] | one yes/no question (experiencing the psychological symptom/ concern - depression) | yes/no | response = yes |
| Poyrazli S, et al. [64] | PHQ-9 | The total scores can range from 0 to 27, with scores indicating minimal or none (0–4), mild (5–9), moderate (10–14) or severe (≥15) depression levels, respectively. A PHQ-9 score of 10 or higher is regarded as a cut- off point, with a sensitivity of 88% for major depression. | PHQ-9 score ≥ 10 |
Rosa D, et al. [65] one yes/no question (diagnosis of depression in the last 12 months) yes/no response = yes Sanci L, et al. [66] PHQ-9 Saravanan C, et al. [67] BDI-II Schofield MJ, et al. [68] DASS-21 Shadowen N, et al. [69] CES-D Song B, et al. [71] DASS-21 Udah H, et al. [75] one yes/no question (felt depression during the pandemic) yes/no response = yes Varughese A, et al. [76] PHQ-2 The total scores can range from 0 to 27, with scores indicating minimal or none (0–4), mild (5–9), moderate (10–14) or severe (≥15) depression levels, respectively. A PHQ-9 score of 10 or higher is regarded as a cut- off point, with a sensitivity of 88% for major depression.
PHQ-9 score ≥ 10
Beck AT, et al. [82] suggested the cut score guidelines for the total scores as follows: 0–13 (minimal), 14–19 (mild), 20–28 (moderate), and 29–63 (severe). A cut off of 20 was used as an indication of depression.
BDI-II score ≥ 20
The depression subscale consists of items 3, 5, 10, 13, 16, 17, and 21 with scores ranging from normal (0–9), mild (10–13), moderate (14– 20), severe (21–27), to extremely severe (28+).
DASS-21 depression scale score ≥ 14
Items were rated on a 4-point scale, and total CES-D scores could range from 0 to 60, with higher scores indicating more depressive symptoms. A score of 16 and above is the typical cut-off score for screening positively for clinically significant depressive symptoms [89].
CES-D score ≥ 16
The depression subscale consists of items 3, 5, 10, 13, 16, 17, and 21 with scores ranging from normal (0–9), mild (10–13), moderate (14– 20), severe (21–27), to extremely severe (28+).
DASS-21 depression scale score ≥ 14
Each of the four questions (two for PHQ and two for GAD) is scaled from 0 (not at all) to 3 (nearly every day). For each PHQ-2 score ≥3 scale, the responses to the two questions are summed to yield a score that ranges from 0 to 6. If the combined score on the two PHQ- 2 questions is 3 or greater, major depressive disorder is likely.
Xiong Y, et al. [78] one yes/no question (depression diagnosis) yes/no response = yes
- Yuan LL, et al. [79]
- PHQ-9
Table 5: Measurement of depression for the 35 studies selected.
Of the 50 studies, 29 reported data for prevalence of anxiety. Table 4 summarized the instruments and the associated scoring instructions and criteria used to determine anxiety for each study. General Anxiety Disorder-7 (GAD-7) [92] (n = 9), DASS-21 (n = 3), and Beck anxiety inventory (BAI) [93] (n = 3) were the most commonly utilized instruments for measuring depression. Other instruments utilized to measure depression included: Generalized Anxiety Disorder-2 (GAD-2) scale [94] (n = 2), GHQ-28 (n = 1), PHQ-4 (n = 1), and HADS (n = 1). The remaining studies (n = 9) utilized a single item to measure anxiety, including The total scores can range from 0 to 27, with scores indicating minimal or none (0–4), mild (5–9), moderate (10–14) or severe (≥15) depression levels, respectively. A PHQ-9 score of 10 or higher is regarded as a cut- off point, with a sensitivity of 88% for major depression.
PHQ-9 score ≥ 10
- one Likert-scale item from BHM-20 (symptoms of anxiety),
- one Likert-scale question regarding social and psychological issues – anxiety, and
- yes/no questions such as a) any experiences of anxiety in the past twelve months (from R-DA-MLES-12), b) anxiety diagnosis, c) anxiety in the past year, d) diagnosis of anxiety in the last 12 months, e) experienced anxiety during the pandemic, g) experiencing the psychological symptom/concern – anxiety, and h) mental health symptoms (anxiety) during the last month.
| Anxiety | |||
|---|---|---|---|
| study | Instrument | Scoring | Indication of anxiety |
| Alam MD, et al. [31] | DASS-21 | The anxiety subscale consists of items 2, 4, 7, 9, 15, 19, and 20, with scores ranging from normal (0–7), mild (8–9), moderate (10–14), severe (15–19), to extremely severe (20+). | DASS-21 anxiety scale ≥ 10 |
| AlKrenawi A, et al. [32] | BAI | Beck AT [93] suggested the cut score guidelines for the total scores as follows: 0–7 (minimal), 8–15 (mild), 16–25 (moderate), and 26–63 (severe). The suggested cutoff score in the manual for clinically significant anxiety is 16. | BAI score ≥ 16 |
| Barreira P, et al. [34] | GAD-7 | Based on a clinical cut-off score of 10, the GAD-7 scale distributes anxiety levels across minimal or none (0–4), mild (5–9), moderate (10–14) or severe (≥15) levels [92]. | GAD-7 ≥ 10 |
| Bathke A, et al. [35] | one Likert-scale item from BHM- 20 (symptoms of anxiety) | 5-point Likert scale (never/rarely/ sometimes/often/almost always) | response = sometimes/often/ almost always |
one yes/no question (Mental health symptoms (anxiety) during the last month) Chae D, et al. [36]
Han X, et al. [41] GAD-7
Jones-White DR, et al. [43] GAD-2
Kahwa KM, et al. [44] DASS-21
one Likert-scale question (social and psychological issues - anxiety) Kambouropoulos A [45]
Khosravi R, et al. [46] GHQ-28
Kim HR, et al. [47] GAD-7
Kivelä L, et al. [48] BAI
Lai AYK, et al. [49] PHQ-4
Larnyo E, et al. [50] GAD-7
yes/no response = yes Based on a clinical cut-off score of 10, the GAD-7 scale distributes anxiety levels across minimal or none (0–4), mild (5–9), moderate (10–14) or severe (≥15) levels.
GAD-7 ≥ 10
Response options included “not at all (0),” “several days (+1),” “more than half the days (+2),” and “nearly every day (+3).” A cut-point of 3 was an indication of clinically significant GAD symptoms.
GAD-2 ≥ 3
The anxiety subscale consists of items 2, 4, 7, 9, 15, 19, and 20, with scores ranging from normal (0–7), mild (8–9), moderate (10–14), severe (15–19), to extremely severe (20+).
DASS-21 anxiety scale ≥ 10
never a problem, has been a problem, ongoing problem anxiety “has been a problem” or is an “ongoing problem” anxiety (Items 8-14): For every item, there are 4 probable answers on hand (0-not at all, 1-no more than usual, 2-rather more than usual, 3-much more than usual).
Based on GHQ-28 subscale - anxiety (Items 8-14) (cut-off value for the subscale was not mentioned in the study) Based on a clinical cut-off score of 10, the GAD-7 scale distributes anxiety levels across minimal or none (0–4), mild (5–9), moderate (10–14) or severe (≥15) levels.
GAD-7 ≥ 10
Beck AT [93] suggested the cut score guidelines for the total scores as follows: 0–7 (minimal), 8–15 (mild), 16–25 (moderate), and 26–63 (severe). The suggested cutoff score in the manual for clinically significant anxiety is 16.
BAI score ≥ 16
Total score is determined by adding together the scores of each of the 4 items. Scores are rated as normal (0-2), mild (3-5), moderate (6-8), and severe (9- 12). Total score ≥3 for first 2 questions suggests anxiety. Total score ≥3 for last 2 questions suggests depression. Löwe et al (2010) [87] recommends a cut-off score of 6 for the total score.
PHQ-4 ≥ 6
Based on a clinical cut-off score of 10, the GAD-7 scale distributes anxiety levels across minimal or none (0–4), mild (5–9), moderate (10–14) or severe (≥15) levels.
GAD-7 ≥ 10
one yes/no question of R-DA- MLES-12 (any experiences of anxiety in the past twelve months) Lian Z [53]
Mahihu C [4] HADS
Maleku A, et al. [55] GAD-7
Marahwa P, et al. [56] GAD-7
de Moissac D, et al. [57] one yes/no question (anxiety in the past year) yes/no response = yes one yes/ no question (experiencing the psychological symptom/concern - anxiety) Poyrazli S [63]
Poyrazli S, et al. [64] GAD-7
one yes/ no question (Diagnosis of anxiety in the last 12 months) Rosa D, et al. [65]
Sanci L, et al. [66] GAD-7
Shadowen N, et al. [69] BAI
yes/no response = yes The questionnaire contains 14 questions, with seven items related to depression and another seven related to anxiety. Each item has a score ranging from 0 - 3. Thus, depending on the level of depression and anxiety, the scores can vary from 0 - 21. The cut-off score for each subscale is a score greater or equal to 8.
HADS ≥ 8
Based on a clinical cut-off score of 10, the GAD-7 scale distributes anxiety levels across minimal or none (0–4), mild (5–9), moderate (10–14) or severe (≥15) levels.
GAD-7 ≥ 10
Based on a clinical cut-off score of 10, the GAD-7 scale distributes anxiety levels across minimal or none (0–4), mild (5–9), moderate (10–14) or severe (≥15) levels.
GAD-7 ≥ 10
yes/no response = yes Based on a clinical cut-off score of 10, the GAD-7 scale distributes anxiety levels across minimal or none (0–4), mild (5–9), moderate (10–14) or severe (≥15) levels.
GAD-7 ≥ 10
yes/no response = yes Based on a clinical cut-off score of 10, the GAD-7 scale distributes anxiety levels across minimal or none (0–4), mild (5–9), moderate (10–14) or severe (≥15) levels.
GAD-7 ≥ 10
Beck AT [93] suggested the cut score guidelines for the total scores as follows: 0–7 (minimal), 8–15 (mild), 16–25 (moderate), and 26–63 (severe). The suggested cutoff score in the manual for clinically significant anxiety is 16.
BAI score ≥ 16
| Song B, et al. [71] | DASS-21 | The anxiety subscale consists of items 2, 4, 7, 9, 15, 19, and 20, with scores ranging from normal (0–7), mild (8–9), moderate (10–14), severe (15–19), to extremely severe (20+). | DASS-21 anxiety scale ≥ 10 |
|---|---|---|---|
| Udah H, et al. [75] | one yes/ no question (experienced anxiety during the pandemic) | yes/no | response = yes |
| Varughese A, et al. [76] | GAD-2 | Each of the 2 questions is scaled from 0 (not at all) to 3 (nearly every day). The responses to the two questions are summed to yield a score that ranges from 0 to 6. If the combined score on the two GAD-2 is 3 or greater, generalized anxiety disorder is likely. | GAD-2 ≥ 3 |
| Xiong Y, et al. [78] | one yes/no question (anxiety diagnosis) | yes/no | response = yes |
| Yuan LL, et al. [79] | GAD-7 | Based on a clinical cut-off score of 10, the GAD-7 scale distributes anxiety levels across minimal or none (0–4), mild (5–9), moderate (10–14) or severe (≥15) levels. | GAD-7 ≥ 10 |
Table 7: Measurement of anxiety for the 29 studies selected.
Of the 50 studies, 14 reported data for prevalence of loneliness. Table 5 summarized the instruments and the associated scoring instructions and criteria used to determine loneliness for each study. Three instruments, such as the 3-item University of California, Los Angeles, Loneliness Scale (UCLA-LS) [95] (n = 1), the 8-item UCLA loneliness scale (ULS-8) [96] (n = 1), and De Jong-Gierveld Loneliness Scale (DJGLS) [97] (n =1) were utilized by three studies (n = 3) to measure loneliness. Four studies (n = 4) had used Likert-scale items, such as a) symptoms of loneliness (from BHM-20), b) I feel lonely in Australia, c) factors (loneliness) contributing for the depression and homesickness among students who did not recover from their depression and homesickness, and d) how frequently do you have such feeling since Covid-19. Another 4 studies (n = 4) had used yes/no questions such as a) social and psychological issues – loneliness, b) experiencing the psychological symptom/ concern – loneliness, c) experienced any of the following while at university, and d) loneliness experienced, to measure loneliness. For the two qualitative studies [51, 72], number of participants endorsed the idea of loneliness was used to determine the prevalence of loneliness for the study participants.
| Loneliness | |||
|---|---|---|---|
| Study | Instrument | Scoring | Indication of loneliness |
| Alam MD, et al. [31] | 3-item UCLA-LS | Answers were scored on a 3-point scale ranging from 1 (Hardly ever) to 3 (Often) and summed to create a continuous total score ranging from 3 to 9. The score then collapsed into one of two categories: a score of 3–5 reflects a negative screening for loneliness, and a score of 6–9 reflects a positive screening for loneliness. | UCLA-LS ≥ 6 |
one Likert item from BHM-20 (symptoms of loneliness) Bathke A, et al. [35]
Chae D, et al. [36]
One Likert-scale question (social and psychological issues - loneliness) Kambouropoulos A [45]
Kivelä L, et al. [48] DJGLS
Lefdahl Davis EM, et al. [51] NA NA number of participants endorsed the idea (experienced loneliness) Maleku A, et al. [55] 8-item UCLA loneliness scale (ULS-8) Morris A, et al. [58] one Likert-scale question (I feel lonely in Australia) one yes/no question (experiencing the psychological symptom/ concern - loneliness) Poyrazli S [63]
one yes/no question (Experienced any of the following while at university) Sanci L, et al. [66]
one Likert-scale question (factors (loneliness) contributing for the depression and homesickness among students who did not recover from their depression and homesickness) Saravanan C, et al. [67]
5-point Likert scale (never/rarely/ sometimes/often/almost always) response = sometimes/often/ almost always one yes/no question (feeling loneliness during the last month) yes/no response = yes loneliness “has been a problem” or is an “ongoing problem” never a problem, has been a problem, ongoing problem DJGLS consists of 11 items assessing subjective loneliness rated on a 5-point scale. Total scores range from 0 to 11, with scores 0–2 reflecting no loneliness, 3–8 moderate loneliness, and 9–11 severe loneliness.
DJGLS ≥ 3
Each item has a 4-level frequency score, with answer choices of 1 (never), 2 (rarely), 3 (sometimes), and 4 (always). The total score ranges from 8 to 32 points, with higher scores suggesting a higher degree of loneliness.
moderate/severe loneliness (cut-off value not mentioned in the article)
5-point Likert scale (1 = strongly disagree, 2 = disagree, 3 = neither agree nor disagree, 4 = agree, 5 = strongly agree) response = agree / strongly agree yes/no response = yes yes/no response = no problem, mild, moderate, severe response = moderate / severe Sustarsic M, et al. [72] NA NA number of participants endorsed the idea of loneliness one Likert-scale question (how frequently do you have such feeling since Covid-19)
1 = never, 2 = rarely, 3 = sometimes, and 4 = always response = always Xiong Y, et al. [78] one yes/no question (loneliness experienced) yes/no response = yes
- Note. NA = not available.
Table 9: Measurement of loneliness for the 14 studies selected.
Of the 50 studies, 17 reported data for prevalence of help-seeking behavior. Table 6 summarized the instruments and the associated scoring instructions and criteria used to determine help-seeking behavior for each study. All studies utilized one single item to measure help-seeking behavior. One study (n = 1) asked one question regarding methods of coping. The remaining studies (n = 16) asked a yes/no question to assess help-seeking behavior. The yes/ no questions were a) accessing the university’s student counselling service, b) receiving treatment for depression, anxiety, or any mental health issue, c) previous experience in counseling, d) previous use of mental health services, e) previous use of mental health services, f) had sought help for their psychological distress from the available university services, g) had attended mental health or counseling services, h) received counseling services, i) has previous experience with psychological counselling, j) used counseling services for social adjustment, k) seen a mental health professional, l) previously attended mental health counseling, m) accessed counselling and psychological services, n) personally received counseling in the past, and o) sought mental health services.
| Help-Seeking | |||
|---|---|---|---|
| Study | Instrument | Scoring | Indication of help-seeking behavior |
| Atherton K, et al. [33] | one yes/no question (accessing the university’s student counselling service) | yes/no | response = yes |
| Barreira P, et al. [34] | one yes/no question (receiving treatment for depression, anxiety, or any mental health issue) | yes/no | response = yes |
| Chen H, et al. [37] | one yes/no question (previous experience in counseling) | yes/no | response = yes |
| Clough BA, et al. [38] | one yes/no question (previous use of mental health services) | yes/no | response = yes |
| Clough BA, et al. [39] | one yes/no question (previous use of mental health services) | yes/no | response = yes |
| Kahwa KM, et al. [44] | one yes/no question (had sought help for their psychological distress from the available university services) | yes/no | response = yes |
| Li P, et al. [52] | one yes/no question (had attended mental health or counseling services?) | yes/no | response = yes |
| Lian Z [53] | one yes/no question of R-DA- MLES-12 (received counseling services) | yes/no | response = yes |
Table 10: Measurement of help-seeking behavior for the 17 studies selected. Risk of Bias The adapted form of NOS for cross section
- Nahidi S [59] one yes/no question (has previous experience with psychological counselling) yes/no response = yes
- Nasir MAM, et al. [60] one yes/no question (used counseling services for social adjustment) yes/no response = yes
- Negrete V [61] one yes/no question (seen a mental health professional?) yes/no response = yes
- Poyrazli S, et al. [64] one yes/no question (previously attended mental health counseling) yes/no response = yes
- Sanci L, et al. [66] one yes/no question (accessed counselling and psychological services) yes/no response = yes family support, prayers to God, friends’ support, psychologist/ social worker support
- Snoubar Y [70] one question (methods of coping)
- Tu D [74] one yes/no question (personally received counseling in the past) yes/no response = yes
- Xiong Y, et al. [77] one yes/no question (sought mental health services) yes/no response = yes
Table 11: Measurement of help-seeking behavior for the 17 studies selected.
Table 6: Measurement of help-seeking behavior for the 17 studies selected. Risk of Bias The adapted form of NOS for cross sectional studies was used to determine the risk of bias and the quality of the studies included (Table 7). With regard to the sample selection, all studies had samples that were representative of the target population and had had satisfactory sample sizes. However, none of the studies reported the comparability of the respondents and the non-respondents, which may imply there was a self-selection bias. While over half of the studies (n = 27) utilized validated measurement tools for outcome measures, the remaining studies (n = 23) studies
| Study | Selection | Comparability | Outcome | |||||
|---|---|---|---|---|---|---|---|---|
| Represent- ativeness of the cases | Sample size | Non- respondents | Ascertainment of the survey tool | Demographic information | Assessment of outcome | Statistical analysis | Total | |
| Alam MD, et al. [31] | 1 | 1 | 0 | 2 | 1 | 1 | 7 | |
| AlKrenawi A, et al. [32] | 1 | 1 | 0 | 2 | 1 | 1 | 1 | 7 |
| Atherton K, et al. [33] | 1 | 1 | 0 | 1 | 1 | 1 | 1 | 6 |
Table 12: Newcastle-Ottawa quality assessment scale, adapted for cross sectional studies.
| Barreira P, et al. [34] | 1 | 1 | 0 | 2 | 1 | 1 | 1 | 7 |
|---|---|---|---|---|---|---|---|---|
| Bathke A, et al. [35] | 1 | 1 | 0 | 2 | 1 | 1 | 1 | 7 |
| Chae D, et al. [36] | 1 | 1 | 0 | 1 | 1 | 1 | 1 | 6 |
| Chen H, et al. [37] | 1 | 1 | 0 | 1 | 1 | 1 | 1 | 6 |
| Clough BA, et al. [38] | 1 | 1 | 0 | 1 | 1 | 1 | 1 | 6 |
| Clough BA, et al. [39] | 1 | 1 | 0 | 1 | 1 | 1 | 1 | 6 |
| Gülnar B, et al. [40] | 1 | 1 | 0 | 2 | 1 | 1 | 1 | 7 |
| Han X, et al. [41] | 1 | 1 | 0 | 2 | 1 | 1 | 1 | 7 |
| Jiang X, et al. [42] | 1 | 1 | 0 | 2 | 1 | 1 | 1 | 7 |
| Jones-White DR, et al. [43] | 1 | 1 | 0 | 2 | 1 | 1 | 1 | 7 |
| Kahwa KM, et al. [44] | 1 | 1 | 0 | 2 | 1 | 1 | 1 | 7 |
| Kambouropoulos A [45] | 1 | 1 | 0 | 1 | 1 | 1 | 1 | 6 |
| Khosravi R, et al. [46] | 1 | 1 | 0 | 2 | 1 | 1 | 1 | 7 |
| Kim HR, et al. [47] | 1 | 1 | 0 | 2 | 1 | 1 | 1 | 7 |
| Kivelä L, et al. [48] | 1 | 1 | 0 | 2 | 1 | 1 | 1 | 7 |
| Lai AYK, et al. [49] | 1 | 1 | 0 | 2 | 1 | 1 | 1 | 7 |
| Larnyo E, et al. [50] | 1 | 1 | 0 | 2 | 1 | 1 | 1 | 7 |
| Lefdahl Davis EM, et al. [51] | 1 | 1 | 0 | 1 | 1 | 1 | 1 | 6 |
| Li P, et al. [52] | 1 | 1 | 0 | 1 | 1 | 1 | 1 | 6 |
| Lian Z [53] | 1 | 1 | 0 | 2 | 1 | 1 | 1 | 7 |
| Lu L, et al. [54] | 1 | 1 | 0 | 2 | 1 | 1 | 1 | 7 |
| Mahihu C [4] | 1 | 1 | 0 | 2 | 1 | 1 | 1 | 7 |
| Maleku A, et al. [55] | 1 | 1 | 0 | 2 | 1 | 1 | 1 | 7 |
| Marahwa P, et al. [56] | 1 | 1 | 0 | 2 | 1 | 1 | 1 | 7 |
| de Moissac D, et al. [57] | 1 | 1 | 0 | 1 | 1 | 1 | 1 | 6 |
| Morris A, et al. [58] | 1 | 1 | 0 | 1 | 1 | 1 | 1 | 6 |
| Nahidi S [59] | 1 | 1 | 0 | 1 | 1 | 1 | 1 | 6 |
| Nasir MAM, et al. [60] | 1 | 1 | 0 | 1 | 1 | 1 | 1 | 6 |
| Negrete V [61] | 1 | 1 | 0 | 1 | 1 | 1 | 1 | 6 |
| Nguyen MH, et al. [62] | 1 | 1 | 0 | 2 | 1 | 1 | 1 | 7 |
| Poyrazli S [63] | 1 | 1 | 0 | 1 | 1 | 1 | 1 | 6 |
| Poyrazli S, et al. [64] | 1 | 1 | 0 | 1 | 1 | 1 | 1 | 6 |
| Rosa D, et al. [65] | 1 | 1 | 0 | 1 | 1 | 1 | 1 | 6 |
| Sanci L, et al. [66] | 1 | 1 | 0 | 2 | 1 | 1 | 1 | 7 |
| Saravanan C, et al. [67] | 1 | 1 | 0 | 2 | 1 | 1 | 1 | 7 |
| Schofield MJ, et al. [68] | 1 | 1 | 0 | 2 | 1 | 1 | 1 | 7 |
| Shadowen N, et al. [69] | 1 | 1 | 0 | 2 | 1 | 1 | 1 | 7 |
| Snoubar Y [70] | 1 | 1 | 0 | 1 | 0 | 1 | 1 | 5 |
| Song B, et al. [71] | 1 | 1 | 0 | 2 | 1 | 1 | 1 | 7 |
| Sustarsic M, et al. [72] | 1 | 1 | 0 | 1 | 1 | 0 | 1 | 5 |
| Teng Y, et al. [73] | 1 | 1 | 0 | 1 | 1 | 1 | 1 | 6 |
| Tu D [74] | 1 | 1 | 0 | 1 | 1 | 1 | 1 | 6 |
| Udah H, et al. [75] | 1 | 1 | 0 | 1 | 1 | 1 | 1 | 6 |
| Varughese A, et al. [76] | 1 | 1 | 0 | 2 | 1 | 1 | 1 | 7 |
| Xiong Y, et al. [77] | 1 | 1 | 0 | 1 | 1 | 1 | 1 | 6 |
| Xiong Y, et al. [78] | 1 | 1 | 0 | 1 | 1 | 1 | 1 | 6 |
| Yuan LL, et al. [79] | 1 | 1 | 0 | 2 | 1 | 1 | 1 | 7 |
Table 13: Newcastle-Ottawa quality assessment scale, adapted for cross sectional studies.
Prevalence of Depression
Figure 2 shows the forest plot of prevalence of depression. The number of international students for the 35 studies ranged from 29 to 4624. The event counts (i.e., number of subejcts exhibiting symptoms of depression) for the 35 studies ranged from 3 to 1221. The prevalence of depression (computed as “(event counts / number of international students)*100%) ranged from 4.3 to 94.8. Figure 2 also summarizes the results of the meta-analysis using the fixed effectt model and the random-effects model, and the study weights under each model.
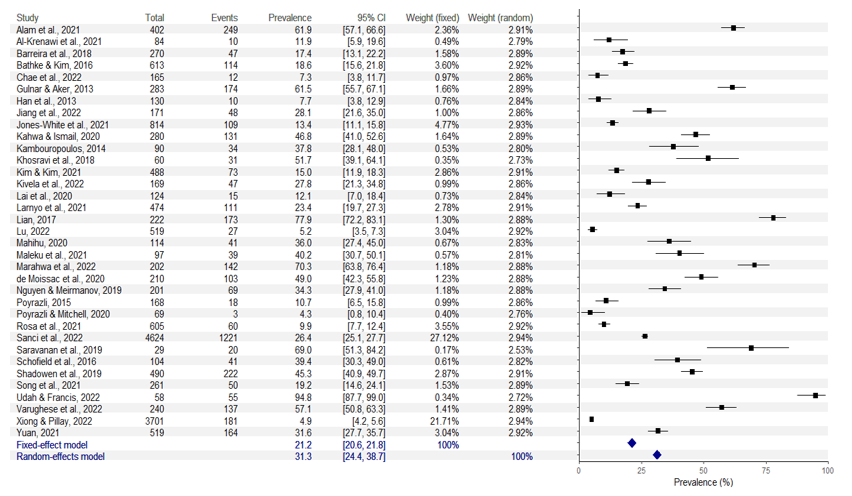
Figure 2: Forest plot for prevalence of depression. Note. Total = total number of international students; event = number of subejcts exhibiting symptoms of depression; prevalence = prevalence of depression (computed as “(event counts / number of international students)*100%”); CI = confidence interval; weight (fixed) = study weight under fixed effect model; weight (random) = study weight under fixed effect model.
Heterogeneity in effect sizes, i.e., variation in the true effect sizes, among the 35 studies, was quantified using the following statistics, the Q statistic, T2, T, and the I_2 statistics. The _Q statistic was equal to 3177.2522, with df = 34 and p < 0.001, indicating that the studies did not share a common effect size and not all variation was due to sampling errors within studies. The between-studies variance T2 was 0.0532, the between-studies standard deviation T was 0.2305. The _I_2 statistic was 0.9893, indicating 98.93% of total variation across studies was due to heterogeneity rather than chance. Based on these measures of heterogeneity, as there was evidence of heterogeneity among the studies, the random- effects model was used to obtain the summary effect (i.e., the estimated prevalence of depression) for the 35 studies. Based on the analysis results of the random-effects model, the summary effect size, i.e., the estimated prevalence of depression, was 31.3%, with a 95% CI = [24.4, 38.7].
Prevalence of Anxiety
Figure 3 shows the forest plot of prevalence of anxiety. The number of international students for the 29 studies ranged from 58 to 4260. The event counts (i.e., number of subejcts exhibiting symptoms of anxiety) for the 29 studies ranged from 6 to 599. The prevalence of anxiety (computed as “(event counts / number of international students)*100%) ranged from 5.5 to 74.3. Figure 4 also summarizes the results of the meta-analysis using the fixed effectt model and the random-effects model, and the study weights under each model.
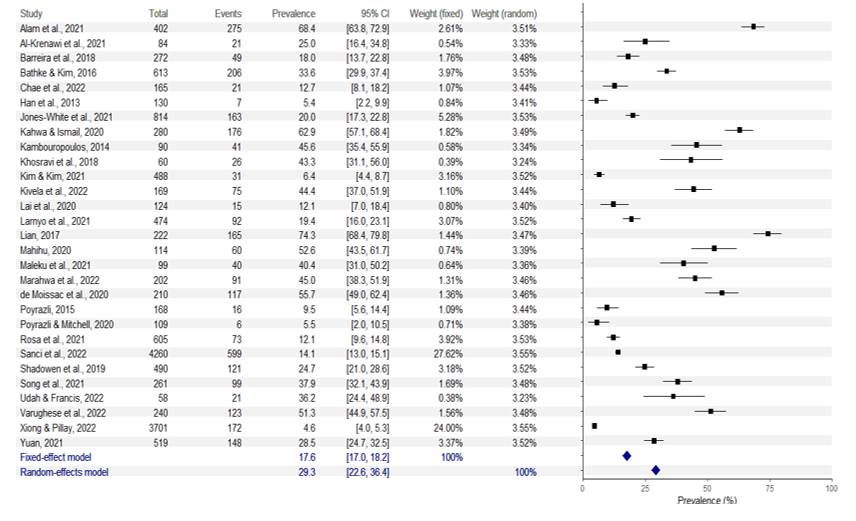
Note. Total = total number of international students; event = number of subejcts exhibiting symptoms of anxiety; prevalence = prevalence of anxiety (computed as “(event counts / number of international students)*100%”); CI = confidence interval; weight (fixed) = study weight under fixed effect model; weight (random) = study weight under fixed effect model.
Heterogeneity in effect sizes, i.e., variation in the true effect sizes, among the 29 studies, was quantified using the following statistics, the Q statistic, T2, T, and the I_2 statistics. The _Q statistic was equal to 2671.0811, with df = 28 and p < 0.001, indicating that the studies did not share a common effect size and not all variation was due to sampling errors within studies. The between-studies variance T2 was 0.0428, the between-studies standard deviation T was 0.2070. The _I_2 statistic was 0.9895, indicating 98.95% of total variation across studies was due to heterogeneity rather than chance. Based on these measures of heterogeneity, as there was evidence of heterogeneity among the studies, the random- effects model was used to obtain the summary effect (i.e., the estimated prevalence of anxiety) for the 29 studies. Based on the analysis results of the random-effects model, the summary effect size, i.e., the estimated prevalence of anxiety, was 29.3%, with a 95% CI = [22.6, 36.4].
Prevalence of Loneliness
Figure 4 shows the forest plot of prevalence of loneliness. The number of international students for the 14 studies ranged from 20 to 7077. The event counts (i.e., number of subejcts exhibiting loneliness) for the 14 studies ranged from 3 to 2477. The prevalence of loneliness (computed as “(event counts / number of international students)*100%) ranged from 12.0 to 77.5. Figure 5 also summarizes the results of the meta-analysis using the fixed effectt model and the random- effects model, and the study weights under each model.
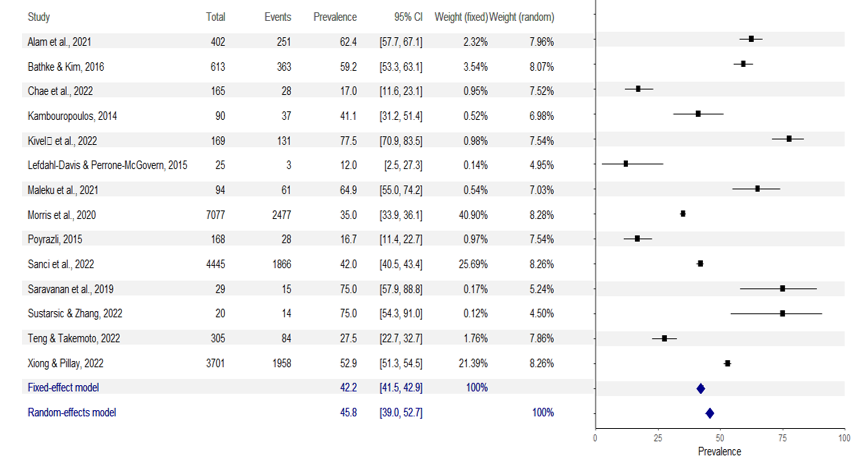
Note. Total = total number of international students; event = number of subejcts exhibiting loneliness; prevalence = prevalence of loneliness (computed as “(event counts / number of international students)*100%”); CI = confidence interval; weight (fixed) = study weight under fixed effect model; weight (random) = study weight under fixed effect model.
Heterogeneity in effect sizes, i.e., variation in the true effect sizes, among the 14 studies, was quantified using the following statistics, the Q statistic_, T_2, T, and the I_2 statistics. The _Q statistic was equal to 748.9388, with df = 13 and p <
0.001, indicating that the studies did not share a common effect size. The between-studies variance T2 was 0.0148, the between-studies standard deviation T was 0.1216. The _I_2 statistic was 0.9826, indicating 98.26% of total variation across studies was due to heterogeneity rather than chance. Based on these measures of heterogeneity, as there was evidence of heterogeneity among the studies, the random- effects model was used to obtain the summary effect (i.e., the estimated prevalence of loneliness) for the 14 studies. Based on the analysis results of the random-effects model, the summary effect size, i.e., the estimated prevalence of loneliness, was 45.8%, with a 95% CI = [39.0, 52.7].
Prevalence of Help-Seeking Behavior
Figure 5 shows the forest plot of prevalence of help- seeking behavior. The number of international students for the 17 studies ranged from 23 to 4426. The event counts (i.e., number of subejcts exhibiting help-seeking behavior) for the 17 studies ranged from 2 to 504. The prevalence of help- seeking behavior (computed as “(event counts / number of international students)*100%) ranged from 3.2 to 37.2. Figure 5 also summarizes the results of the meta-analysis using the fixed effectt model and the random-effects model, and the study weights under each model.
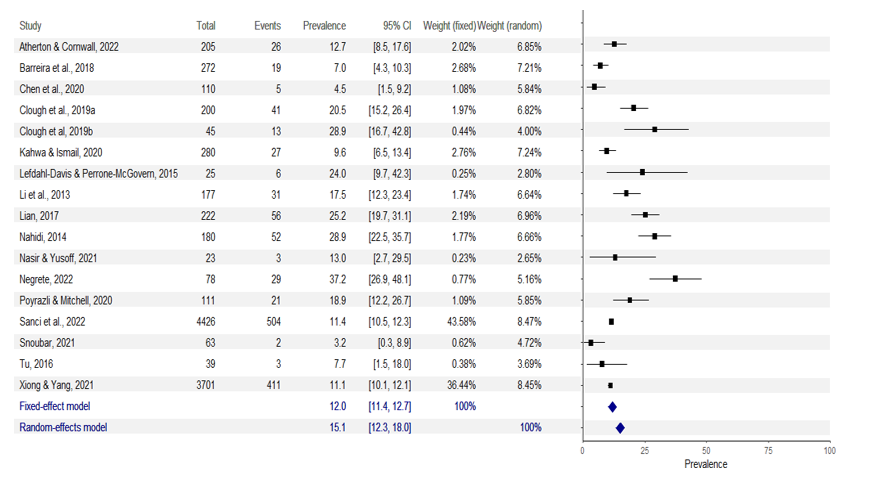
Note. Total = total number of international students; event = number of subjects exhibiting help-seeking behavior; prevalence = prevalence of help-seeking behavior (computed as “(event counts / number of international students)*100%”); CI = confidence interval; weight (fixed) = study weight under fixed effect model; weight (random) = study weight under fixed effect model.
Heterogeneity in effect sizes, i.e., variation in the true effect sizes, among the 17 studies, was quantified using the following statistics, the Q statistic, T2, T, and the I_2 statistics. The _Q statistic was equal to 149.0017, with df = 16 and p < 0.001, indicating that the studies did not share a common effect size. The between-studies variance _T_2 was 0.0049, the between-studies standard deviation T was 0.0697. The _I_2 statistic was 0.8926, indicating 89.26% of total variation across studies was due to heterogeneity rather than chance. Based on these measures of heterogeneity, as there was evidence of heterogeneity among the studies, the random- effects model was used to obtain the summary effect (i.e., the estimated prevalence of help-seeking behavior) for the 17 studies. Based on the analysis results of the random-effects model, the summary effect size, i.e., the estimated prevalence of help-seeking behavior, was 15.1%, with a 95% CI = [12.3, 18.0].
References
-
Oduwaye O, Kiraz A, Sorakin Y (2023) A trend analysis of the challenges of international students over 21 years. Sage Open 13(4).
-
Corney T, du Plessis K, Woods B, Lou C, Dewhurst A, Mawren D (2024) ‘if you are feeling alone and you are not feeling safe, it impacts everything’: A mixed-methods exploration of international students’ accommodation, subjective wellbeing and mental health help-seeking. BMC Public Health 24(1).
-
Zheng K, Johnson S, Jarvis R, Victor C, Barreto M, et al. (2023) The experience of loneliness among international students participating in the BBC loneliness experiment: Thematic analysis of qualitative survey data. Current Research in Behavioral Sciences 4: 100113.
-
Mahihu C (2020) Prevalence of Depression, Anxiety among International Students in the Health Professions at Southern Medical University, PR China. Open Journal of Social Sciences 8(12): 161.
-
Yee T, Ryan K (2022) Examining international students’ help-seeking intentions utilizing the theory of planned behavior. International Journal for the Advancement of Counselling 45(2): 370-384.
-
Prasath PR, Xiong Y, Zhang Q, Jeon L (2022) Psychological capital, well-being, and distress of international students. International Journal for the Advancement of Counselling, 44(3): 529-549.
-
LaMontagne AD, Shann C, Lolicato E, Newton D, Owen PJ, et al. (2023) Mental health-related knowledge, attitudes and behaviours in a cross-sectional sample of Australian university students: A comparison of domestic and international students. BMC Public Health 23(1).
-
Hosseinpur H, Parsa AD, Kabir R (2023) The prevalence of depression and its predictors among international postgraduate students studying Public Health at a UK university. Journal of Psychosexual Health 5(2): 94-101.
-
Dobson KS (1985) The relationship between anxiety and depression. Clinical Psychology Review 5(4): 307-324.
-
Nasr E, Hassan H, Sheha E (2016) Psychological consequences of hypertensive disorders among pregnant women. Scientific Research Journal 4(9): 1-8.
-
Hassan HE, Ahmed WFM, Mahmoud AA (2020) Impact of tailored educational program on primigravida anxiety and knowledge regarding minor discomforts in upper Egypt. International Journal of Studies in Nursing 5(1): 1.
-
Sylvers P, Lilienfeld SO, LaPrairie JL (2011) Differences between trait fear and trait anxiety: Implications for psychopathology. Clinical Psychology Review 31(1): 122-137.
-
Perlman D, Peplau LA (1981) Toward a social psychology of loneliness. Personal Relationships 3: 31-56.
-
Nyqvist F, Victor CR, Forsman AK, Cattan M (2016) The association between social capital and loneliness in different age groups: a population-based study in Western Finland. BMC Public Health 16(1): 1-8.
-
Rickwood D, Thomas K (2012) Conceptual measurement framework for help-seeking for mental health problems. Psychology Research and Behavior Management 5: 173- 183.
-
Moher D, Liberati A, Tetzlaff J, Altman DG (2009) Preferred reporting items for systematic reviews and meta-analyses: the PRISMA statement. Annals of internal medicine 151(4): 264-269.
-
Morrison A, Polisena J, Husereau D, Moulton K, Clark M, et al. (2012) The effect of English-language restriction on systematic review-based meta-analyses: a systematic review of empirical studies. International journal of technology assessment in health care 28(2): 138-144.
-
Jones JB, Blecker S, Shah NR (2008) Meta-analysis 101: What you want to know in the era of comparative effectiveness. American Health & Drug Benefits 1(3): 38- 43.
-
Wells GA, Shea B, O’Connell D, Peterson J, Welch V, et al. (2000) The Newcastle-Ottawa Scale (NOS) for assessing the quality of nonrandomised studies in meta-analyses.
-
Herzog R, Álvarez-Pasquin M, Díaz C, Del Barrio JL, Estrada JM, et al. (2013) Are healthcare workers’ intentions to vaccinate related to their knowledge, beliefs and attitudes? A systematic review. BMC Public Health 13(1): 1-17.
-
Naafs JC, Vendrig LM, Limpens J, Van Der Lee HJ, Duijnhoven RG, et al. (2020) Cognitive outcome in congenital central hypothyroidism: a systematic review with meta-analysis of individual patient data. European Journal of Endocrinology 182(3): 351-361.
-
Borenstein M, Hedges LV, Higgins JP, Rothstein HR (2009) Introduction to meta-analysis. Chichester, UK: John Wiley & Sons, Ltd.
-
Evangelou E, Veroniki AA (2022) Meta-research: Methods and protocols. Springer.
-
Cochran WG (1950) The comparison of percentages in matched samples. Biometrika 37(3/4): 256-266.
-
DerSimonian R, Laird N (1986) Meta-analysis in clinical trials. Controlled clinical trials 7(3): 177-188.
-
Higgins JP, Thompson SG, Deeks JJ, Altman DG (2003) Measuring inconsistency in meta-analyses. BMJ 327(7414): 557-560.
-
Hedges L (1992) Meta-analysis. Journal of Educational Statistics 17: 279-296.
-
Hedges L, Vevea J (1998) Fixed- and random-effects models in meta-analysis. Psychological Methods 3: 486- 504.
-
Normand S (1999) Meta-analysis: Formulating, evaluating, combining, and reporting. Statistics in Medicine 18: 321-359.
-
Borenstein M, Hedges LV, Higgins JP, Rothstein HR (2010) A basic introduction to fixed‐effect and random‐effects models for meta‐analysis. Research synthesis methods 1(2): 97-111.
-
Alam MD, Lu J, Ni L, Hu S, Xu Y (2021) Psychological outcomes and associated factors among the international students living in China during the COVID-19 pandemic. Frontiers in Psychiatry 12: 707342.
-
Al-Krenawi A, Alotaibi F, Elbedour S (2021) Acculturative stress among female Saudi college students in the United States. Community Mental Health Journal 57(2): 372- 379.
-
Atherton K, Cornwall J (2022) Psychological Distress and Help-seeking Behaviour: Chinese International Students in New Zealand. JANZSSA-Journal of the Australian and New Zealand Student Services Association.
-
Barreira P, Basilico M, Bolotnyy V (2018) Graduate student mental health: Lessons from American economics departments. Harvard Univ.
-
Bathke A, Kim R (2016) Keep Calm and Go Abroad: The Effect of Learning Abroad on Student Mental Health. Frontiers: The Interdisciplinary Journal of Study Abroad 27: 1-16.
-
Chae D, Yang H, Doorenbos AZ, Park CG, Asami K (2022) The Relationship Between Duration of Stay and Self- rated Health Among International College Students in South Korea. Journal of Community Health pp: 1-12.
-
Chen H, Akpanudo U, Hasler E (2020) How Do Chinese International Students View Seeking Mental Health Services?. Journal of International Students 10(2): 286- 305.
-
Clough BA, Nazareth SM, Day JJ, Casey LM (2019) A comparison of mental health literacy, attitudes, and help- seeking intentions among domestic and international tertiary students. British Journal of Guidance & Counselling 47(1): 123-135.
-
Clough BA, Nazareth SM, Casey LM (2020) Making the grade: a pilot investigation of an e-intervention to increase mental health literacy and help-seeking intentions among international university students. British Journal of Guidance & Counselling, 48(3): 347- 359.
-
Gülnar B, Aker H (2013) The relationship between depression interpersonal communication and media using among international students. International Journal of Social, Behavioral, Educational, Economic, Business and Industrial Engineering 7(5): 1199-1205.
-
Han X, Han X, Luo Q, Jacobs S, Jean-Baptiste M (2013) Report of a mental health survey among Chinese international students at Yale University. Journal of American College Health 61(1): 1-8.
-
Jiang X, Zhao B, Nam EW, Kong F (2022) Assessing Knowledge, Preventive Practices, and Depression Among Chinese International Students and Local Korean Students in South Korea During the COVID-19 Pandemic: An Online Cross-Sectional Study. Frontiers in Psychiatry 13: 920887.
-
Jones-White DR, Soria KM, Tower EK, Horner OG (2022) Factors associated with anxiety and depression among US doctoral students: Evidence from the gradSERU survey. Journal of American College Health 70(8): 2433- 2444.
-
Kahwa KM, Ismail A (2020) Prevalence, associated factors, and help seeking behavior related to psychological distress among international students at Universiti Kebangsaan Malaysia. Malaysian Journal of Public Health Medicine 20(2): 215-223.
-
Kambouropoulos A (2014) An examination of the adjustment journey of international students studying in Australia. The Australian Educational Researcher 41(3): 349-363.
-
Khosravi R, Azman A, Khosravi S, Khosravi N (2018) Addressing Mental Health Issues of International Students at University Sains Malaysia: An Inquiry for Social Work Policy and Practice. The International Journal of Humanities 25(2): 31-43.
-
Kim HR, Kim EJ (2021) Factors associated with mental health among international students during the COVID-19 pandemic in South Korea. International Journal of Environmental Research and Public Health 18(21): 11381.
-
Kivelä L, Mouthaan J, van der Does W, Antypa N (2022) Student mental health during the COVID-19 pandemic: Are international students more affected?. Journal of American College Health pp: 1-9.
-
Lai AYK, Lee L, Wang MP, Feng Y, Lai TTK, (2020) Mental health impacts of the COVID-19 pandemic on international university students, related stressors, and coping strategies. Frontiers in Psychiatry 11: 584240.
-
Larnyo E, Dai B, Nutakor JA, Ampon-Wireko S, Appiah R, et al. (2021) Assessing the Impact of Social Media Use on Everyday Emotion in Health Crises: A Study of International Students in China during COVID-19. In Healthcare 9(8): 1011.
-
Lefdahl Davis EM, Perrone McGovern KM (2015) The cultural adjustment of Saudi women international students: A qualitative examination. Journal of Cross- Cultural Psychology 46(3): 406-434.
-
Li P, Wong YJ, Toth P (2013) Asian international students’ willingness to seek counseling: A mixed-methods study. International Journal for the Advancement of Counselling 35(1): 1-15.
-
Lian Z (2017) Predictors of Depression/Anxiety, Mental Health Service Utilization, and Help-Seeking for Chinese International Students: Role of Acculturation, Microaggressions, Social Support, Coping Self-Efficacy, Stigma, and College Staffs’ Cultural Competence and Cultural Humility, Doctoral dissertation, Teachers College, Columbia University, USA.
-
Lu L, Wang X, Wang X, Guo X, Pan B (2022) Association of Covid-19 pandemic-related stress and depressive symptoms among international medical students. BMC Psychiatry 22(1): 20.
-
Maleku A, Kim YK, Kirsch J, Um MY, Haran H, et al. (2022) The hidden minority: Discrimination and mental health among international students in the US during the COVID‐19 pandemic. Health & Social Care in the Community 30(5): e2419-e2432.
-
Marahwa P, Makota P, Chikomo DT, Chakanyuka T, Ruvai T, et al. (2022) The psychological impact of COVID-19 on university students in China and Africa. PLoS One 17(8): e0270824.
-
de Moissac D, Graham JM, Prada K, Gueye NR, Rocque R (2020) Mental health status and help-seeking strategies of international students in Canada. Canadian Journal of Higher Education 50(4): 52-71.
-
Morris A, Hastings C, Wilson S, Mitchell E, Ramia G, et al. (2020) The experience of international students before and during COVID-19: Housing, work, study and wellbeing. University of Technology Sydney: Institute for Public Policy and Governance, Australia.
-
Nahidi S (2014) Mental health and psychological help- seeking of Iranian international students at unsw Australia. Unpublished doctoral dissertation). University of New South Wales, Sydney, Australia.
-
Nasir MAM, Yusoff AMM (2021) The utilization of counseling services by international students in relation to their academic and social adjustment issues. Jurnal Personalia Pelajar 24(1): 29-39.
-
Negrete V (2022) Attitudes toward Seeking Professional Psychological Help among Asian International Students: Acculturation and Loss of Face, Doctoral dissertation, Alliant International University, USA.
-
Nguyen MH, Le TT, Meirmanov S (2019) Depression, acculturative stress, and social connectedness among international university students in Japan: A statistical investigation. Sustainability 11(3): 878.
-
Poyrazli S (2015) Psychological symptoms and concerns experienced by international students: Outreach implications for counseling centers. Journal of International Students 5(3): 306-312.
-
Poyrazli S, Mitchell MA (2020) Mental health problems of US students studying abroad. Journal of International Students 10(1): 17-27.
-
Rosa D, Sabiston CM, Kuzmocha Wilks D, Cairney J, Darnell SC (2021) Group differences and associations among stress, emotional well-being, and physical activity in international and domestic university students. J Am Coll Health 71(1): 235-241.
-
Sanci L, Williams I, Russell M, Chondros P, Duncan AM, et al. (2022) Towards a health promoting university: descriptive findings on health, wellbeing and academic performance amongst university students in Australia. BMC Public Health 22(1): 1-24.
-
Saravanan C, Mohamad M, Alias A (2019) Coping strategies used by international students who recovered from homesickness and depression in Malaysia. International Journal of Intercultural Relations 68: 77- 87.
-
Schofield MJ, Ohalloran P, McLean SA, Forrester Knauss C, Paxton SJ (2016) Depressive symptoms among Australian university students: Who is at risk?. Australian Psychologist 51(2): 135-144.
-
Shadowen N, Williamson AA, Guerra NG, Ammigand R, Drexlerd ML (2019) Prevalence and correlates of depressive symptoms among international students: Implications for university support offices. Journal of International Students 9(1): 129-148.
-
Snoubar Y (2021) Social work practices and enabling the integration of students from war and conflict zones. Humanities and Social Sciences Communications 8(1): 1-8.
-
Song B, Zhao Y, Zhu J (2021) COVID-19-related traumatic effects and psychological reactions among international students. Journal of Epidemiology and Global Health 11(1): 117-123.
-
Sustarsic M, Zhang J (2022) Navigating through uncertainty in the era of COVID-19: Experiences of international graduate students in the United States. Journal of International Students 12(1): 61-80.
-
Teng Y, Takemoto K (2022) Associations between psychological conditions and social capital among Chinese international students in Japan during the COVID-19 pandemic. Journal of Disaster Research 17(1): 136-143.
-
Tu D (2016) Help-seeking attitudes in Chinese international students in community colleges: A study of the impact of acculturative stress and coping strategies. Doctoral dissertation. Northwest University.
-
Udah H, Francis A (2022) Vulnerability and well-being: International students’ experience in north Queensland, Australia. Journal of Comparative & International Higher Education 14(5): 171-196.
-
Varughese A, Schwartz S, Sheen N (2022) Sitting with myself by myself”: Indian Students in Canada During the Pandemic. Comparative and International Education 51(1): 57-74.
-
Xiong Y, Yang L (2021) Asian international students’ help-seeking intentions and behavior in American postsecondary institutions. International Journal of Intercultural Relations 80: 170-185.
-
Xiong Y, Pillay Y (2022) A national study of the mental health status of Asian international students in the United States. Journal of Multicultural Counseling and Development 51(2): 82-91.
-
Yuan LL, Lu L, Wang XH, Guo XX, Ren H, et al. (2021) Prevalence and predictors of anxiety and depressive symptoms among international medical students in China during COVID-19 pandemic. Frontiers in Psychiatry 12: 761964.
-
Kroenke K, Spitzer RL, Williams JB (2001) The PHQ‐9: validity of a brief depression severity measure. Journal of General Internal Medicine 16(9): 606-613.
-
Lovibond PF, Lovibond SH (1995) The structure of negative emotional states: Comparison of the Depression Anxiety Stress Scales (DASS) with the Beck Depression and Anxiety Inventories. Behaviour Research and Therapy 33(3): 335-343.
-
Beck AT, Steer RA, Brown GK (1996) Beck depression inventory II (BDI-II). Pearson, New York, USA.
-
Kroenke K, Spitzer RL, Williams JB (2003) The Patient Health Questionnaire-2: validity of a two-item depression screener. Medical Care 41(11): 1284-1292.
-
Wang Y (2006) Internet use among Chinese students and its implication for cross-cultural adaptation. Doctoral dissertation, Kent State University, USA.
-
Hudson WW (1982) Generalized contentment scale. In Fischer J, Corcoran K (Eds.), Measures for clinical practice: A sourcebook. In: 2nd (Edn.), Free Press, New York, USA, pp: 236-238.
-
Kilic C, Rezaki M, Rezaki B, Kaplan I, Ozgen C, et al. (1997) General Health Questionnaire (GHQ12 & GHQ28): psychometric properties and factor structure of the scales in a Turkish primary care sample. Social Psychiatry and Psychiatric Epidemiology 32(6): 327- 331.
-
Löwe B, Wahl I, Rose M, Spitzer C, Glaesmer H, et al. (2010) A 4-item measure of depression and anxiety: validation and standardization of the Patient Health Questionnaire-4 (PHQ-4) in the general population. Journal of Affective Disorders 122(1-2): 86-95.
-
Bocéréan C, Dupret E (2014) A validation study of the Hospital Anxiety and Depression Scale (HADS) in a large sample of French employees. BMC Psychiatry 14: 354.
-
Radloff L (1977) The CES-D scale: A self-report depression scale for research in the general population. Applied Psychological 1(3): 385-401.
-
Kopta SM, Lowry JL (2002) Psychometric evaluation of the Behavioral Health Questionnaire-20: A brief instrument for assessing global mental health and the three phases of psychotherapy outcome. Psychotherapy Research 12(4): 413-426.
-
Rodriguez JD (2016) An online investigation of diverse college students’ experiences of stress: Predictors of high levels of past month perceived stress. Unpublished doctoral dissertation, Teachers College, Columbia University, USA.
-
Spitzer RL, Kroenke K, Williams JB, Löwe B (2006) A brief measure for assessing generalized anxiety disorder: the GAD-7. Archives of Internal Medicine 166(10): 1092- 1097.
-
Beck AT (1993) Beck anxiety inventory (BAI). Pearson, New York, USA.
-
Kroenke K, Spitzer RL, Williams JB, Monahan PO, Löwe B (2007) Anxiety disorders in primary care: prevalence, impairment, comorbidity, and detection. Annals of Internal Medicine 146(5): 317-325.
-
Hughes ME, Waite LJ, Hawkley LC, Cacioppo JT (2004) A short scale for measuring loneliness in large surveys: Results from two population-based studies. Research on Aging 26(6): 655-672.
-
Xu S, Qiu D, Hahne J, Zhao M, Hu M (2018) Psychometric properties of the short-form UCLA Loneliness Scale (ULS-8) among Chinese adolescents. Medicine 97(38): e12373.
-
de Jong-Gierveld J, van Tilburg T (1999) Manual of the Loneliness Scale. Department of Social Research Methodology, Vrije Universiteit Amsterdam, Amsterdam, Netherlands.
-
Yu IT, Tse SL (2012) Workshop 6--sources of bias in cross-sectional studies; summary on sources of bias for different study designs. Hong Kong Medical Journal 18(3): 226-227.
- Family Experiences and their Interpretations as a Source of Adaptive Behaviour in Young Adults: A Qualitative Model of Adaptive Behaviour
- The Development of Responsibility in Teenage Mothers: A Qualitative Model
- Post-Truth Reality: Worldwide Infodemia and Mental Health Concerns during and Post COVID-19 Pandemic Scenarios
- Psycho-Emotional Rehabilitating Means of Overcoming Extreme and Stressful Impact
- The Paradox of Humbleness, Arrogance and the Concept of Fluid Individuality
- Psychological Self-Help in Conditions of Bombing of Ukraine