Selection in Sugarcane Germplasm under the Egyptian Conditions
Two hundred and ninety four sugarcane germplasm, collected from different geographical origins in the world were planted at Mattana Agricultural Research Station (latitude of 25° 17' N and longitude of 32° 33'), Luxor Governorate, Egypt for evaluation and selection of the best ones. Genetic variation and genetic advance were studied under very wide of genotypes variation. The experimental work was conducted at two stages. The 1st one (March, 2014) was to evaluate the 294 genotypes for cane and sugar yields in a randomized complete block design with three replications and to select the best ones, based on sugar yield with 5% selection intensity. The 2nd stage aimed to evaluate the selected genotypes from the 1st stage for yield and quality traits and to compare them with the two prevailed commercial variety GT54-9 and the new one namely G2003-47 for two years as a plant cane grown in 2015-2016 season and its 1st ratoon in 2016-2017, in a randomized complete block design with two replications. The results revealed highly variation among the evaluated 294 genotypes in all studied traits. High estimates of broad-sense heritability (H %) were obtained for all studied traits, which ranged between 87.19% for brix and 99.82% for stalk length. All evaluated traits had high heritability estimates with high genetic advance values under 5% selection intensity, indicating the high probability of selecting individuals with better performance in the next stages. Results of the 2nd stage showed that cane yield, sugar recovery, sugar yield, purity, sucrose percent and stalk length were highly heritable characters in both plant and its 1st ratoon cane crops, while stalk diameter and stalk weight were highly heritable only in the plant cane and 1st ratoon, respectively. Genotypic coefficient of variation (GCV%) estimates were greater than 10% for stalk length, sugar recovery and sugar yield and reached 17.80% for stalk weight, indicating the presence of genetic variability and potential of selection for these traits. The overall mean of the two seasons pointed out to six genotypes showing the superiority in sugar yield/fad, which were: EH88/5-27 (8.78 tons/fad), SP72-5181 (9.58 tons/fad), G2008-64 (10.13 tons/fad), G2008-20(10.50 tons/fad), G2007-61 (8.45 tons/fad), and G2006-36 (9.78 tons/fad) (fad = 4200m2) higher than that produced by the two check cultivars: GT54-9 (6.45 tons) and G2003-47 (8.43 tons/fad).
Abo Elenen FFM, Eid M Mehareb*, Ghonema MA and El-Bakry A
Sugar Crops Res. Inst, Agric Res Center, Giza, Egypt
Egypt, Email: elmoharb@yahoo.com
in a randomized complete block design with two replications.
Introduction
Sugarcane is an ancient crop with a complex genetic history. Until the 20th century, sugarcane industries throughout the world relied on “noble canes” (Saccharum officinarum L.) for sugar production. However, since early in the 20th century most of the production world-wide has been derived from polyploid, aneuploid interspecific hybrids of two or more basic Saccharum species [1]. Sucrose yield in sugarcane is a product of cane yield and sucrose content of the cane. While both cane yield and sucrose content are important, increasing sucrose content has been a priority in the Egyptian sugarcane breeding programs. Most sugarcane breeding programs worldwide use modified recurrent selection for sucrose to increase the sucrose content of new cultivars [2]. Sugar yield from a cane crop is a complex attribute governed by a number of contributing factors. The relative importance of the components in the selection process may be determined only by knowing their respective contribution to sugar yield. The extent to which this component will respond to selection is also subject to genetic parameters such as variability, heritability and genetic advance [3]. The cane yield of sugarcane is influenced by many contributing traits combined with the environmental factors. Improvement in cane and sugar yields is the main objective of most of the breeding programs, especially for abiotic stresses [4]. Germplasm is the most important source of variability for various quantitative and qualitative traits required in a breeding program. Sugarcane varieties are the complex polyploids consisting of interspecific hybrids combining the genomes mainly of the Saccharum species like Saccharum officinarum, Saccharum barberi, Saccharum sinense, and Saccharum spontaneum. The world collection of sugarcane germplasm maintained at the Sugar Crops Research Institute, Agricultural Research Centre, Egypt, includes about 500 foreign hybrids, originating from the major sugarcane breeding stations. Proper evaluation, screening, and documentation of the germplasms under specific condition would provide an estimate of their potential value as suitable donors for breeding purpose. Characterization and conservation of diversified plant genetic resources are the prerequisites for generation of genomic resources, which can be used by the breeders to develop stress tolerant cultivars [5].
In Egypt, sugarcane is usually grown commercially over four to five ratoon crops, and good performance in ratoon crops is an important attribute of sugarcane cultivars. In sugarcane breeding programs, genotypes normally are evaluated across one or more ratoon crops in most stages of selection. However, evaluation across ratoon crops in a multistage selection program significantly increases the time and resources needed for selection. In the present study, an attempt was made to generate the information on genetic variability, heritability, and characters association among the yield contributing traits in old (out of cultivation) and new (under cultivation) accessions of germplasms to find out whether there are any genetic changes in both the populations and to identify parent for developing varieties suitable through breeding.
Materials and Methods
Two hundred and ninety four sugarcane germplasm, collected from different geographical origins in the world were planted at Mattana Agricultural Research Station (latitude of 25° 17' N and longitude of 32° 33'), Luxor Governorate, Egypt for evaluation and selection of the best ones. Genetic variation and genetic advance were studied under wide genotypic variation. The experimental work was conducted at two stages as follows:
Stage I
Each genotype of the evaluated germplasm (Table 1) was planted during the 1st week of March, 2014 in two rows of 5-m in length and 1-m width in a randomized complete block design with three replications. After 12 months from planting, the following data were recorded: 1. Millable cane height (cm) was measured from soil surface up to the top visible dewlap.
2. Millable cane diameter (cm) was measured at the middle part of stalks.
3. Brix% (total soluble solids percent) was determined using “Brix Hydrometer” according to A.O.A.C. [6].
4. Sugar content % was determined using the following equation of: Sugar content % = brix% x 0.69 [7].
5. Cane yield/fad (ton). (Fad = 4200 m2).
6. Theoretical sugar yield was assessed as follows: Sugar
yield = cane yield (ton) x sugar content %.
| Origin | Genotype | Origin | Genotype | Origin | |
|---|---|---|---|---|---|
| NA 56-79 | Argentina, Norte | G 98-28 | Egypt, Giza | G 2005-64 | Egypt, Giza |
| 59 A 506 | Guatemala | G 2009-38 | Egypt, Giza | G 84-68 | Egypt, Giza |
| 58 A 116 | Guatemala | G 2009-73 | Egypt, Giza | G 2009-86 | Egypt, Giza |
| IS 76-183 | Bangladesh, Ishurdi | G 2009-3 | Egypt, Giza | G 2009-67 | Egypt, Giza |
| 62 B 201 | Barbados | G 98-132 | Egypt, Giza | G 85-166 | Egypt, Giza |
| 54 B 469 | Barbados | G 95-19 | Egypt, Giza | G 2009-37 | Egypt, Giza |
| B 37-61 | Barbados | G 2005-83 | Egypt, Giza | G 2009-27 | Egypt, Giza |
| B 36-21 | Barbados | G 75-393 | Egypt, Giza | G 2009-84 | Egypt, Giza |
| IAC 5120 | Brazil, Campinas | G 68-421 | Egypt, Giza | G 95-21 | Egypt, Giza |
| Sp 59-56 | Brazil, Sao Paulo | G 69-55 | Egypt, Giza | G 2004-27 | Egypt, Giza |
| SP 80-3280 | Brazil, Sao Paulo | G 87-149 | Egypt, Giza | G 2009-11 | Egypt, Giza |
| SP 80-1842 | Brazil, Sao Paulo | G 2009-24 | Egypt, Giza | G 2009-2 | Egypt, Giza |
| SP 72-5181 | Brazil, Sao Paulo | G 2009-34 | Egypt, Giza | G 2009-12 | Egypt, Giza |
| SP 70-1143 | Brazil, Sao Paulo | G 73-185 | Egypt, Giza | G 2009-40 | Egypt, Giza |
| SP 81-1763 | Brazil, Sao Paulo | G 2009-71 | Egypt, Giza | G 2009-73 | Egypt, Giza |
| SP 79-2233 | Brazil, Sao Paulo | G 2008-58 | Egypt, Giza | G 70-112 | Egypt, Giza |
| SP 79-2233 | Brazil, Sao Paulo | G 99-160 | Egypt, Giza | G 2004-25 | Egypt, Giza |
| SP 81-3250 | Brazil, Sao Paulo | G 70-53 | Egypt, Giza | G 84-47 | Egypt, Giza |
| CB 38-22 | Brizel, Campos, Rio de Janeira | G 2009-5 | Egypt, Giza | G 2009-99 | Egypt, Giza |
| ROC 10 | China | G 2009-45 | Egypt, Giza | G 2006-3 | Egypt, Giza |
| 84 C 130 | Cuba, Central Jaranu | G 74-96 | Egypt, Giza | G 2007-13 | Egypt, Giza |
| 83 C 81 | Cuba, Central Jaranu | G 2007-28 | Egypt, Giza | G 2007-133 | Egypt, Giza |
| 83 C 37 | Cuba, Central Jaranu | G 2009-42 | Egypt, Giza | G 2005-47 | Egypt, Giza |
| 83 C 59 | Cuba, Central Jaranu | G 2009-22 | Egypt, Giza | G 2005-44 | Egypt, Giza |
| GT 54-9 | Egypt - Taiwan | G 2007-14 | Egypt, Giza | G 74-99 | Egypt, Giza |
| EN 4-2 | Egypt- South Africa ( Natal) | G 99-80 | Egypt, Giza | G 2006-36 | Egypt, Giza |
| EH 85/2-19 | Egypt, Hawamdeia | CO 284 | India, Coimbatore | EL 18-1 | Salvador |
|---|---|---|---|---|---|
| EH 87/40-17 | Egypt, Hawamdeia | CO 997 | India, Coimbatore | EI 58-28 | Salvador |
| EH 85/19-2 | Egypt, Hawamdeia | CO 662 | India, Coimbatore | EL 8-1 | Salvador |
| EH 87/31-11 | Egypt, Hawamdeia | CO 798 | India, Coimbatore | EI 58-28 | Salvador |
| EH 89/8-27 | Egypt, Hawamdeia | CO 331 | India, Coimbatore | EI 27-2 | Salvador |
| EH 87/26-11 | Egypt, Hawamdeia | CO 1129 | India, Coimbatore | EI 21-4 | Salvador |
| EH 1-5 | Unknown | CO 281 | India, Coimbatore | EI 60-26 | Salvador |
| EH 73-11 | Unknown | KOEng Java | Indonesia | EI 242-16 | Salvador |
| EH 16-9 | Unknown | IN 84-003 | Indonesia | EL 4-10 | Salvador |
| EH 67-11 | Unknown | IR 16-5 | Iran | EL 18-4 | Salvador |
| EH 16-1 | Unknown | IR 28-10 | Iran | EL 13-6 | Salvador |
| EH 26-3 | Unknown | PS 87-2378 | Java, Pasuruan | EI 27-2 | Salvador |
| EH 128-2 | Unknown | PS 79-54 | Java, Pasuruan | EI 44-5 | Salvador |
| EH 26-2 | Unknown | PS 81-640 | Java, Pasuruan | NCO 339 | South Africa – India |
| E 37-10 | Mauritius | PS 80-1007 | Java, Pasuruan | 84 N 5 | South Africa, Natal |
| 84 E 1 | Mauritius | PS 82-1098 | Java, Pasuruan | N 26 | South Africa, Natal |
| 86 E 409 | Mauritius | PS 77-155 | Java, Pasuruan | N 11 | South Africa, Natal |
| 69 E 18 | Mauritius | PS 80-1424 | Java, Pasuruan | K 81113 | Sri Lanka, Kantalai |
| E 32-70 | Mauritius | M 57-35 | Mauritius | F 150 | Taiwan |
| 86 E 131 | Mauritius | M 35-157 | Mauritius | F 36-81 | Taiwan |
| 43 E 35 | Mauritius | M 253-48 | Mauritius | F 161 | Taiwan |
| IK 76-63 | Unknown | M 55-157 | Mauritius | 84 K 1 | Thailand |
| IK 76-79 | Unknown | Mix 58-1868 | Mexico | CP 63-35 | USA (Florida, Canal Point) |
| A 63-10 | Guatemala | Mix 2001-80 | Mexico | CP XXXXX | USA (Florida, Canal Point) |
| A 63-20 | Guatemala | Mix 58-1866 | Mexico | CP 46-115 | USA (Florida, Canal Point) |
| 62 D 509 | Guyana , Demerara | Mix 2001-80 | Mexico | CP 63-46 | USA (Florida, Canal Point) |
| 83 D 49 | Guyana , Demerara | PH 10 | Philippines | CP 57-614 | USA (Florida, Canal Point) |
| 86 D 1 | Guyana , Demerara | EI 43-84 | Salvador | CP 72-35 | USA (Florida, Canal Point) |
| 86 D 296 | Guyana , Demerara | EL 4-4 | Salvador | CP 67-412 | USA (Florida, Canal Point) |
| BO 3 | India, Bihar, Orissa | EI 17-178 | Salvador | CP 43-44 | USA (Florida, Canal Point) |
| BO 22 | India, Bihar, Orissa | EI 4-40 | Salvador | CP 76-331 | USA (Florida, Canal Point) |
| BO 18 | India, Bihar, Orissa | EI 33-17 | Salvador | CP 44-101 | USA (Florida, Canal Point) |
| BO 21 | India, Bihar, Orissa | EI 36-80 | Salvador | 86 L 37 | USA (Louisiana) |
| BO 41-24 | India, Bihar, Orissa | EI 8-129 | Salvador | L 60-25 | USA (Louisiana) |
| CO 214 | India, Coimbatore | EI 58-37 | Salvador | L 61-49 | USA (Louisiana) |
| CO 1157 | India, Coimbatore | EI 7-44 | Salvador | L 62-96 | USA (Louisiana) |
| CO 775 | India, Coimbatore | EI 21-20 | Salvador | 86 L 37 | USA (Louisiana) |
| CO 284 | India, Coimbatore | EI 4-49 | Salvador | CI 47-143 | USA, Florida, Clewiston |
| CO 744 | India, Coimbatore | EI 8-10 | Salvador | CI 47-83 | USA, Florida, Clewiston |
| CO 624 | India, Coimbatore | EI 45-43 | Salvador | PR 1059 | USA, Puerto Rico |
| CO 603 | India, Coimbatore | EI 60-13 | Salvador | PR 1013 | USA, Puerto Rico |
| CO 859 | India, Coimbatore | EI 4-21 | Salvador | US 59-161 | USA, South Florida |
| CO 775 | India, Coimbatore | EI 8-129 | Salvador | 69 H 5 | USA, Hawaii |
| CO 349 | India, Coimbatore | EI 47-2 | Salvador | H 86-371 | USA,Hawaii |
| CO 395 | India, Coimbatore | EI 24-2 | Salvador | H 86-486 | USA,Hawaii |
| BP 41-227 | Unknown | EI 23-4 | Salvador | S | Unknown |
| EPC 10232 | Unknown | EI 264-2 | Salvador | NS 3-3 | Unknown |
Table 2: Geographic origins of tested cane materials.
Stage II
A total number of 14 sugarcane genotypes from stage I were selected as the best ones based on sugar yield at 5% selection intensity, to be evaluated in stage II as a plant cane and its 1st ratoon crops. They were replanted during the 1st week of March, 2015 in three rows of 5-m in length and 1-m in a randomized complete block design with two replications. Two standard cultivars (the commercial variety GT 54-9 and new variety G2003-47) were used as checks. Planting was achieved by placing twenty five 3-budded cane cuttings in each row. The field was irrigated right after planting and all other agronomic practices were carried out as recommended by Sugar Crops Research Institute. Harvest took place at age of 12 months in both plant and 1st ratoon cane crops. In addition to the traits recorded at stage I, the following traits were determined for each genotype in stage II:
- Sucrose percentage of clarified juice was determined using automated Sacharimeter according to A.O.A.C. [6].
- Juice purity percentage was calculated according to the following equation of: Juice purity % = (sucrose %/brix %) x 100 [8].
- Sugar recovery % was calculated according to the following equation, described by: Sugar recovery % = [sucrose % - 0.4 (brix % - sucrose %)] x 0.73 [9].
- Cane yield/fad (ton) was determined from cane weight of each plot (kg), which was converted into ton per fad.
- Sugar yield/fad (ton) was calculated according to the following equation as described by Mathur: Sugar yield/fad (ton) = cane yield/fad (ton) x sugar recovery% [10].
Statistical Analysis
The collected data were statistically analyzed according to the procedures outlined by Snedecor and Chochran to estimate the following criteria [11]:
a. Estimation of Variance Components
Genotypic and phenotypic components of variance were estimated with the help of following formulae:
Genotypic Variance ($\sigma^2$ g) = gMS – eMS
Phenotypic variance ($\sigma^2$ p) = $\sigma^2$ g + eMS
b. Coefficient of Variability
Both genotypic and phenotypic coefficient of variability were computed for each character as per method suggested by Burton and Devane (1953)
Genotypic Coefficient of Variation (GCV) % was estimated as:
(GCV) % = ($\delta$g / general mean) x 100.
Phenotypic Coefficient of Variation (PCV) % was estimated as:
(PCV) % = ($\delta$p / general mean) x 100.
Where:
$\delta$g = genotypic standard deviation
$\delta$p = phenotypic standard deviation
Heritability (H) in broad sense was computed for each character as the ratio of genetic variance to the total variance as suggested by Hanson, et al. (1956)
H = $\sigma^2$ g / $\sigma^2$ p x 100
Where,
$\sigma^2$g and $\sigma^2$p are genotypic and phenotypic variances respectively.
Expected genetic gains from selection as % of mean (GA %) were calculated following the formula adopted by Falconer:
GA = K× H x $\delta$p
GA as % of mean = (GA / general mean) x 100
Where:
K= 2.06 for 5% selection intensity, $\delta$p = phenotypic standard deviation and H = broad sense heritability.
To compare between treatment means, LSD at 5% level of significance was used according to Steel and Torrie [12]. All statistical analyses were performed using analysis of variance technique of (MSTAT-c) computer software package and Genes computer software package.
Results and Discussion
The discussion of the obtained results begins with the first stage of selection among 294 sugarcane germplasm for the studied traits. Thereafter, data of the best selected 14 ones will be discussed.
The First Stage
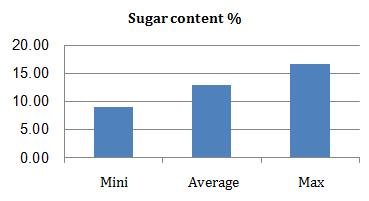
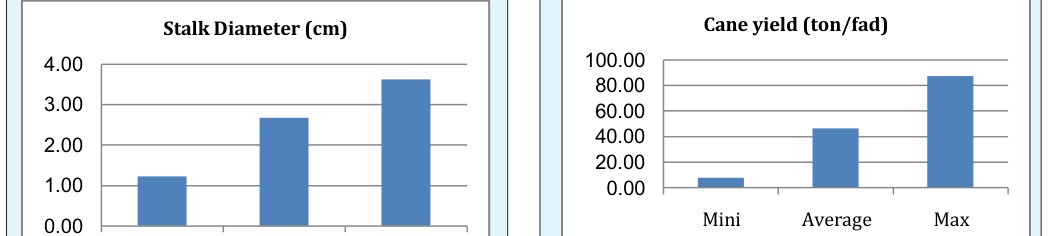
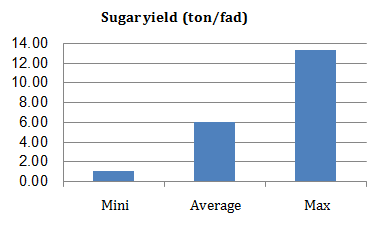
The results revealed higher range of variance among the evaluated 294 genotypes in the studied characters, i.e. stalk length, diameter, brix%, sugar content%, cane and sugar yields/fad (Figures 1-6). A wide variation was obtained in stalk length of genotypes at harvest, which ranged from 58 to 259 cm. Likewise, values of 1.22 to 3.62 cm were observed for stalk diameter of the tested genotypes. Juice brix showed a great variation ranged from 13 to 24%, while the recorded values of sucrose% ranged from 8.97 to 16.56%. Moreover, an extreme variance of 7.74-87.26 and 0.98-13.25 ton/fed was detected in cane and sugar yield, successively.
| Component | Stalk length | Stalk diameter | Brix | Sugar content | Cane yield | Sugar yield |
| $\sigma^{2}e$ | 1.96 | 0.004 | 0.58 | 0.28 | 1.22 | 0.06 |
| $\sigma^{2}g$ | 1114.47 | 0.2 | 3.97 | 1.89 | 191.41 | 3.98 |
| $\sigma^{2}p$ | 1116.42 | 0.2 | 4.55 | 2.17 | 192.63 | 4.04 |
| H% | 99.82 | 98.16 | 87.19 | 87.19 | 99.37 | 98.43 |
| GCV% | 20.47 | 16.54 | 10.64 | 10.64 | 29.66 | 32.97 |
| PCV% | 20.49 | 16.7 | 11.4 | 11.39 | 29.75 | 33.24 |
| GA% | 42.13 | 33.76 | 20.47 | 20.47 | 60.9 | 67.39 |
Table 3: Variance components, coefficients of variation, broad sense heritability and genetic advance for studied traits of Table
Table 2: Variance components, coefficients of variation, broad sense heritability and genetic advance for studied traits of Table 2: Variance components, coefficients of variation, broad sense heritability and genetic advance for studied traits of 294 sugarcane germplasm in stage one. Genotypic and Phenotypic Variance After partitioning phenotypic variance, it was found that genotypic variance was higher than the environmental one for the six characters studied (Table 2). The magnitude of variance was the highest in stalk length (σ2g = 1114.47, σ2e = 1.96) followed by cane yield/fed (σ2g = 191.41, σ2e = 1.22). These results indicate that a negligible role was played by the environmental factors in the inheritance of these characters in sugarcane. The high genotypic variance in stalk height, diameter and brix was also reported by Singh and Singh [8].
Genotypic and Phenotypic Coefficients of Variation The estimates for phenotypic coefficient of variation (PCV) were closed with genotypic coefficient of variation (GCV) in all the traits, indicating lower influence of environment on genetic variation (Table 2). The highest phenotypic and genotypic coefficient of variation were observed for sugar yield (PCV = 33.24% and GCV = 32.97%) followed by cane yield/fed (PCV = 29.75% and GCV = 29.66%) and stalk length (PCV = 20.49% and GCV = 20.47%). High genotypic and phenotypic coefficients of variation for stalk height, stalk diameter, brix % and cane yield were reported by Singh RK, Singh GP [13]. Heritability Genotypic coefficient of variation is not a correct determine the heritable variation present and should be considered together with heritability estimates. Table, 2 illustrated that high heritability estimates were recorded for all characters, stalk length (99.82%), yield/fed (99.37%), sugar yield (98.43%), stalk diameter (98.16%), brix and sugar content (87.19%). These findings suggest that simple selection for these traits would be more effective. High heritability estimate for stalk diameter was reported by Chaudhary RR [14]. Similarly, Jamoza, et al. also found high heritability for stalk diameter and moderate heritability for cane yield [15].
Genetic Advance Heritability estimates along with expected genetic gain is more useful than the heritability value alone in predicting the resultant effect for selecting the best genotypes [16]. Genetic gain, expressed as percent of mean, came in the following descending rank: sugar yield (67.39%), cane yield/fed (60.90%), stalk length (42.13%), stalk diameter (33.76%), brix (20.47%) and sugar content (20.47%), indicating that there is a scope to improve cane yield to a considerable extent by adopting suitable breeding procedures (Table 2). High genetic advance in cane yield was also reported by Jamoza JE, Owuoche J, Kiplagat O, Opile W [15]. Total soluble solids and sugar content had high heritability with moderate genetic advance. Gravois and Milligan illustrated that moderate heritability with low genetic advance in sugar quality parameters indicate the presence of non-additive gene action [17]. Therefore, simple selection on phenotypic performance may not be effective. Gulzar et al. reported that moderate to high heritability coupled with high genetic advance were recorded for juice/cane, juice extraction % and sucrose per cent [18]. Tena, et al. found that moderate broad sense heritability estimates were found in sugar % and brix %, this suggests that a considerable proportion of the total variance is heritable and selection of these traits would be effective [19]. The results suggest that selection should be practiced on the basis of sugar yield, yield/fed, stalk Length and diameter for higher cane yield. Improvement in these traits would lead to a significant increase in yield in limited selection cycles.
The second Stage
Data in Tables 3-5 cleared that the 14 selected genotypes from the first stage differed significantly (P = 0.05) in all studied traits; stalk diameter, stalk length, stalk weight, brix%, sucrose%, juice purity%, sugar recovery%, cane and sugar yields, in plant cane and first ratoon. Stalk Diameter: Results in table 3 showed that the selected genotypes varied significantly in stalk diameter, in the plant cane and first ratoon, and their mean. The two genotypes namely SP72-5181 and G2006-36 recorded significantly higher than that of the two check varieties; GT54-9 and G2003-47 in the plant cane, first ratoon and their mean. Stalk Length: Data in Table 3 revealed that the tested genotypes differed markedly in stalk length, in the plant cane and first ratoon. Stalk length varied from 225 cm for the genotype M57-35 in the plant cane and 231.5 cm for the commercial variety GT54-9 in first ratoon to (352.5 and 358.5 cm) for the genotype EI58-37 in the plant cane and first ratoon, respectively. The five genotypes; F150, EI58-37, F161, G2008-64 and G2003-49 gave significantly taller stalks as compared to two check varieties GT54-9 and G2003-47, in the plant cane and first ratoon. These results are in agreement with those mentioned by Yousif, et al. Mehareb, et al, Mehareb and Abazied, Ahmed, who found that the tested varieties significantly differed in stalk height and diameter [20, 21, 22, 23]. Stalk Weight: Results in Table 3 indicated that the evaluated genotypes differed substantially in stalk weight, in the plant cane and first ratoon, and the mean of the two cane crops. In the plant cane, the genotype F161 recorded the highest mean value of stalk weight. Three genotypes namely F161, G2008-64 and G2006-36 had significantly higher than that recorded by the two check varieties; GT54-9 and G2003-47. In first ratoon, most of genotypes were significantly higher than the two check varieties in this growth trait. Moreover, F150 recorded the highest mean value of stalk weight in the first ratoon and overall mean of the two seasons. These results are in agreement with those reported by El-Shafai and Ismail, Yousif, et al., Mehareb, et al., Mehareb and Abazied, Mehareb et al., who found that the studied varieties significantly differed in stalk weight [20, 21, 22, 24, 25].
| Stalk diameter (cm) | Stalk length (cm) | Stalk weight (kg) | ||||||||
|---|---|---|---|---|---|---|---|---|---|---|
| Selected germplasm | PC | FR | Mean | PC | FR | Mean | PC | FR | Mean | |
| Selected germplasm | G 2003-47 | 2.9 | 2.7 | 2.8 | 260 | 267.5 | 263.75 | 1.35 | 1.45 | 1.4 |
| EH 88/5-27 | 2.65 | 2.55 | 2.6 | 257.5 | 265 | 261.25 | 1.25 | 1.75 | 1.5 | |
| F 150 | 2.2 | 2.3 | 2.25 | 297.5 | 302.5 | 300 | 1.35 | 2.2 | 1.78 | |
| EI 58-37 | 2.65 | 2.55 | 2.6 | 352.5 | 358.5 | 355.5 | 1.25 | 1.05 | 1.15 | |
| M 57-35 | 2.65 | 2.5 | 2.58 | 225 | 232 | 228.5 | 1.15 | 1.3 | 1.23 | |
| F 161 | 2.85 | 2.65 | 2.75 | 277.5 | 285.5 | 281.5 | 1.75 | 1.45 | 1.6 | |
| SP 72-5181 | 3.35 | 3.25 | 3.3 | 237.5 | 245 | 241.25 | 1.45 | 1.6 | 1.53 | |
| G 2008-64 | 2.65 | 2.55 | 2.6 | 282.5 | 292.5 | 287.5 | 1.65 | 1.65 | 1.65 | |
| G 2003-49 | 2.7 | 2.6 | 2.65 | 277.5 | 285.5 | 281.5 | 1.25 | 1.3 | 1.28 | |
| L 62-96 | 2.85 | 2.7 | 2.78 | 270 | 274 | 272 | 1.1 | 1.3 | 1.2 | |
| G 2008-20 | 2.8 | 2.65 | 2.73 | 245 | 252 | 248.5 | 1.1 | 1.4 | 1.25 | |
| G 2007-61 | 2.6 | 2.45 | 2.53 | 270 | 278.5 | 274.25 | 1.2 | 1.7 | 1.45 | |
| SP 81-3250 | 2.75 | 2.45 | 2.6 | 260 | 266.5 | 263.25 | 0.9 | 1.7 | 1.3 | |
| CO 182 | 2.75 | 2.5 | 2.63 | 267.5 | 274 | 270.75 | 0.85 | 1.6 | 1.23 | |
| G 2006-36 | 3.1 | 2.95 | 3.03 | 267.5 | 276 | 271.75 | 1.6 | 1.8 | 1.7 | |
| GT 54-9 | 2.8 | 2.7 | 2.75 | 226.5 | 231.5 | 229 | 1.15 | 1.45 | 1.3 | |
| LSD 0.05 | 0.1 | 0.11 | 11.23 | 12.45 | 0.14 | 0.1 | ||||
Table 4: Mean performance of stalk diameter (cm), stalk length (cm) and stalk weight (kg) of the fourteen promising PC (plant can
Table 3: Mean performance of stalk diameter (cm), stalk length (cm) and stalk weight (kg) of the fourteen promising PC (plant cane), FR (first ratoon). Table 3: Mean performance of stalk diameter (cm), stalk length (cm) and stalk weight (kg) of the fourteen promising sugarcane genotypes at harvest in the plant and first ratoon cane crops. Brix %: Data in Table 4 revealed that genotype viz. EI58- 37 recorded the highest brix % in the plant cane, first ratoon and overall of both crops. Six genotypes namely EI58-37, SP 72-5181, G2008-64, G2003-49, L62-96, G2008-20 and G2006-36 had significantly higher values of this trait than that recorded by the two check varieties; GT54-9 and G2003-47 in the plant cane, without significant variance among them, in the first ratoon. These results are in harmony with those of Mehareb, et al., Mehareb, et al., Mehareb and Abazied, who found differences in brix % among the tested sugar cane varieties [21, 22, 25]. Sucrose %: Data in Table 4 reveal that sucrose% varied significantly among studied genotypes in the plant cane, first ratoon and overall. Two genotypes; EI 58-37 (19.20% and 20.20%) and G2003-49 (18.70% and 20%) were stable and gave significantly higher sucrose % than the two check varieties; GT54-9 (16.60% and 17%) and G2003-47 (17.30% and 18.50%). In the plant cane and the first ratoon, respectively. Purity %: Purity percentage presented in Table 4, the genotype SP81-3250 recorded the highest significantly mean purity % (89.75%) in plant cane but the genotype F 150 recorded the highest significantly mean purity % (88%) in the first ratoon and the genotype G2006-36 recorded the highest significantly mean purity % (85.03%) in the overall.
| Brix % | Sucrose % | Purity % | |||||||
|---|---|---|---|---|---|---|---|---|---|
| Selected germplasm | PC | FR | Mean | PC | FR | Mean | PC | FR | Mean |
| G 2003-47 | 21.35 | 24.3 | 22.83 | 17.3 | 18.5 | 17.9 | 81 | 76.35 | 78.68 |
| EH 88/5-27 | 19.65 | 22.1 | 20.88 | 14.5 | 19.25 | 16.88 | 74 | 86.95 | 80.48 |
| F 150 | 21.1 | 23.1 | 22.1 | 15.8 | 20.3 | 18.05 | 75 | 88 | 81.5 |
| EI 58-37 | 22.35 | 24.5 | 23.43 | 19.2 | 20.2 | 19.7 | 86 | 82.4 | 84.2 |
| M 57-35 | 21.05 | 22.1 | 21.58 | 17.1 | 19.4 | 18.25 | 81 | 87.7 | 84.35 |
| F 161 | 20.3 | 22.7 | 21.5 | 15.7 | 17.6 | 16.65 | 77.5 | 77.95 | 77.73 |
| SP 72-5181 | 22.35 | 23.65 | 23 | 17.3 | 20.9 | 19.1 | 77.5 | 88.5 | 83 |
| G 2008-64 | 20.2 | 23.1 | 21.65 | 17.1 | 18.3 | 17.7 | 84.7 | 79.35 | 82.03 |
| G 2003-49 | 22.05 | 23.4 | 22.73 | 18.7 | 20 | 19.35 | 85 | 85.6 | 85.28 |
| L 62-96 | 22.3 | 23.6 | 22.95 | 18.4 | 18.8 | 18.6 | 82.4 | 79.7 | 81.03 |
| G 2008-20 | 22.2 | 23.6 | 22.9 | 17.7 | 18.95 | 18.33 | 79.7 | 80.3 | 79.98 |
| G 2007-61 | 20.35 | 22.5 | 21.43 | 15.1 | 16.1 | 15.6 | 74.2 | 71.35 | 72.75 |
| SP 81-3250 | 21.7 | 23.3 | 22.5 | 19.5 | 15.9 | 17.7 | 89.8 | 68.25 | 79 |
| CO 182 | 20.4 | 22.7 | 21.55 | 16.3 | 17.9 | 17.1 | 79.7 | 79.25 | 79.45 |
| G 2006-36 | 22.05 | 22.5 | 22.28 | 19.3 | 18.6 | 18.95 | 87.5 | 82.55 | 85.03 |
| GT 54-9 | 20.9 | 20.1 | 20.5 | 16.6 | 17 | 16.8 | 79.2 | 84.35 | 81.78 |
| LSD 0.05 | 0.51 | 1.4 | 0.57 | 0.7 | 1.1 | 2.61 | |||
Table 5: Mean performance of Brix %, Sucrose % and Purity %of the fourteen promising sugarcane genotypes at harvest PC (plant can
Table 4: Mean performance of Brix %, Sucrose % and Purity %of the fourteen promising sugarcane genotypes at harvest PC (plant cane), FR (first ratoon). Table 4: Mean performance of Brix %, Sucrose % and Purity %of the fourteen promising sugarcane genotypes at harvest in the plant and first ratoon cane crops. Sugar recovery %: Data presented in Table 5 showed that the evaluated genotypes differed significantly concerning sugar recovery% at the plant cane and first ratoon and over both crops. In the plant cane, the highest sugar recovery% was recorded for the genotype SP81- 3250 (13.55%) followed by the genotypes; G2006-36 (13.30%), EI58-37 (13.10%), G2003-49 (12.65%), and L62-96 (12.25%), respectively. All the previous genotypes gave significantly higher sugar recovery% as compared to the two checks GT54-9 (10.85%) and G2003-49 (11.45%). In the first ratoon, the genotypes; EH88/5-27 (13.20%), F150 (14.05%), EI58-37 (13.45), M57-35 (13.35%), SP72-5181 (14.45%), G2003-49 (13.65%) and G2008-20 (12.45%) significantly surpassed the two checks GT54-9 (11.45%) and G2003-47 (11.80%).
Cane yield: Data of the plant cane, first ratoon and overall of the two crops, in Table 5 revealed that the 14 genotypes selected from the first stage differed significantly in cane yield. In the plant cane, six genotypes; EH88/5-27(19.00 and 6.50), SP72-5181(16.10 and 3.60), G2008-64 (26.50 and 14.00) , G2008-20 (26.20 and 13.70), G2007-61 (24.50 and 12.00)and G2006-36 (16.00 and 3.50) produced significantly tons of canes higher than that obtained by GT54-9 and G2003-47 check cultivar, successively, corresponding to EH88/5-27(17.80 and 5.80), SP72-5181(13.00 and 1.00), G2008-64 (24.60 and 12.60) , G2008-20 (27.75 and 15.75), G2007-61 (29.70 and 17.70)and G2006-36 (15.50 and 3.50) tons of canes, in the 1st ratoon cane crop. The overall mean of the two seasons showed the superiority of seven genotypes viz. EH 88/5-27( 18.40 and 6.15), SP 72-5181( 14.55 and
2.30), G 2008-64(25.55 and 13.30), G 2008-20 (26.98 and 14.73), G 2007-61(27.10 and 14.85), SP 81-3250 and G2006-36(15.75 and 3.50), which out-yielded GT 54-9 and G 2003-47 cultivars by tons of canes, respectively.
Sugar yield: Results of Table 5 revealed that the sugar yield differed significantly among the evaluated genotypes in the plant cane, first ratoon and overall. In the plant cane, four genotypes; G2008-64 (3.50 and 1.75 ton/fad), G2008-20 (3.45 and 1.70 ton/fad), SP81-3250 (3.00 and 1.25 ton/fad) and G2006-36 (3.55 and 1.80 ton/fad) recorded significantly greater sugar yield values than the two checks GT54-9 (6.45 ton/fad) and G2003-47 (8.20 ton/fad). In the first ratoon, four genotypes; EH88/5-27 (3.40 and 1.80 ton/fad), SP72-5181 (1.95 and
0.20 ton/fad), G2008-64 (3.25 and 1.65 ton/fad) and G2008-20 (4.05 and 2.45 ton/fad) recorded significantly greater cane yield values than the two checks GT54-9 (7.05 ton/fad) and G2003-47 (8.65 ton/fad). In the over two seasons, six genotypes; EH88/5-27 (2.03 and 0.35), SP72-5181 (2.83 and 1.15 ton/fad), G2008-64 (3.38 and 1.70), G2008-20(3.75 and 2.08), G2007-61 (1.70 and 0.02), and G2006-36 (3.03 and 1.35) tons/fad recorded greater sugar yield values than the two checks GT54-9 (6.45 ton/fad) and G2003-47 (8.43 ton/fad). This result is in agreement with those reported by El-Shafai, & Ismail, Yousif, et al., Mehareb, et al., Ahmed, et al., Mehareb and Abazied and Mehareb, et al., who found that the tested varieties significantly differed in cane yield and sugar yield [20, 21, 22, 23, 24, 25].
| Sugar recovery % | Cane yield (t/fad) | Sugar yield (t/fad) | |||||||
|---|---|---|---|---|---|---|---|---|---|
| Selected germplasm | PC | FR | Mean | PC | FR | Mean | PC | FR | Mean |
| G2003-47 | 11.45 | 11.8 | 11.63 | 71.5 | 73.35 | 72.43 | 8.2 | 8.65 | 8.43 |
| EH 88/5-27 | 9.1 | 13.2 | 11.15 | 78 | 79.15 | 78.58 | 7.1 | 10.45 | 8.78 |
| F 150 | 10 | 14.05 | 12.03 | 68 | 71.45 | 69.73 | 6.8 | 10.05 | 8.43 |
| EI 58-37 | 13.1 | 13.45 | 13.28 | 61.5 | 60.9 | 61.2 | 8.1 | 8.2 | 8.15 |
| M 57-35 | 11.3 | 13.35 | 12.33 | 60.4 | 62.8 | 61.6 | 6.85 | 8.4 | 7.63 |
| F 161 | 10.15 | 11.4 | 10.78 | 72 | 70.2 | 71.1 | 7.3 | 8 | 7.65 |
| SP 72-5181 | 11.15 | 14.45 | 12.8 | 75.1 | 74.35 | 74.73 | 8.4 | 10.75 | 9.58 |
| G 2008-64 | 11.6 | 12 | 11.8 | 85.5 | 85.95 | 85.73 | 9.95 | 10.3 | 10.13 |
| G 2003-49 | 12.65 | 13.65 | 13.15 | 61.1 | 62.35 | 61.73 | 7.8 | 8.5 | 8.15 |
| L 62-96 | 12.25 | 12.3 | 12.28 | 65.1 | 67.05 | 66.08 | 8 | 8.3 | 8.15 |
| G 2008-20 | 11.6 | 12.45 | 12.03 | 85.2 | 89.1 | 87.15 | 9.9 | 11.1 | 10.5 |
| G 2007-61 | 9.45 | 9.85 | 9.65 | 83.5 | 91.05 | 87.28 | 7.95 | 8.95 | 8.45 |
| SP 81-3250 | 13.55 | 9.4 | 11.48 | 69.5 | 77.45 | 73.48 | 9.45 | 7.3 | 8.38 |
| CO 182 | 10.65 | 11.7 | 11.18 | 71.1 | 73.25 | 72.18 | 7.55 | 8.6 | 8.08 |
| G 2006-36 | 13.3 | 12.4 | 12.85 | 75 | 76.85 | 75.93 | 10 | 9.55 | 9.78 |
| GT 54-9 | 10.85 | 11.45 | 11.15 | 59 | 61.35 | 60.18 | 6.45 | 7.05 | 6.75 |
| LSD 0.05 | 0.45 | 0.64 | 1.46 | 1.11 | 0.73 | 1.47 | |||
Table 6: Mean performance of sugar recovery %, cane yield (t/fad) and sugar yield (t/fad) of the fourteen promising PC (plant can
Table 5: Mean performance of sugar recovery %, cane yield (t/fad) and sugar yield (t/fad) of the fourteen promising PC (plant cane), FR (first ratoon). Table 5: Mean performance of sugar recovery %, cane yield (t/fad) and sugar yield (t/fad) of the fourteen promising sugarcane genotypes at harvest in the plant and first ratoon cane crops. Genetic Parameter: Among the cane characters, showed wide range of variation in plant cane as well as in the ratoon crop (Tables 6-8), providing wide scope of selection for this traits. Wide range of variations for number of millable canes and stalk height was reported earlier by Ghosh and Singh [26]. Genotypic and Phenotypic Variance: The wide range of genotypic (σ2g) and phenotypic (σ2p) variation was observed for stalk length (σ2g = 739.35 & σ2p = 850.42) in plant cane and (σ2g = 721.53 & σ2p = 836.93) in first ratoon followed by cane yield (σ2g = 68.12 & σ2p = 70.01) in plant cane and (σ2g = 85.25 & σ2p= 86.33) in first ratoon followed by purity (σ2g = 22.82 & σ2p = 23.89) in plant cane and (σ2g = 30.14 & σ2p = 36.06) in first ratoon. The lowest estimates of σ2g and σ2p were exhibited by stalk diameter (σ2g = 0.05 & σ2p = 0.06) in plant cane and (σ2g = 0.04 & σ2p = 0.06) in first ratoon (Tables 6-8). Similar findings were reported by Hapase and Hapase and Verma, et al., found variability of higher magnitude for number of shoots per plot, number of millable canes and cane yield [27, 28]. Also Kumar, et al., and Pawar, et al., found similar results for most of the cane yield and its contributing traits [29, 30]. A perusal of the estimates of environmental component of variance in relation to their genotypic counterpart revealed that the estimates of σ2g were higher than σ2e for all of the characters. The higher magnitude of genotypic variance suggested little influence of environments in the expression of genetic variability.
| Parameters | Stalk length | Stalk diameter | Stalk weight | |||
| Parameters | Pc | FR | Pc | FR | Pc | FR |
| $\sigma^{2}$g | 739.35 | 721.53 | 0.05 | 0.04 | 0.05 | 0.08 |
| $\sigma^{2}$e | 111.06 | 115.4 | 0.01 | 0.01 | 0.02 | 0.002 |
| $\sigma^{2}$p | 850.42 | 836.93 | 0.06 | 0.06 | 0.07 | 0.08 |
| Heritability% | 86.94 | 86.21 | 85.5 | 78.32 | 74.51 | 97.74 |
| GCV | 10.08 | 9.7 | 8.45 | 7.98 | 17.25 | 17.8 |
| PCV | 10.92 | 10.55 | 9.13 | 8.99 | 20.1 | 18.07 |
Table 7: Components of variances, coefficients of variation, heritability for stalk length, stalk diameter and stalk weight in PC
Table 6: Components of variances, coefficients of variation, heritability for stalk length, stalk diameter and stalk weight in PC (plant cane), FR (first ratoon). Table 6: Components of variances, coefficients of variation, heritability for stalk length, stalk diameter and stalk weight in fourteen promising sugarcane genotypes for plant crop and first ratoon.
| Parameters | Brix% | Sucrose% | Purity% | |||
| Parameters | Pc | FR | Pc | FR | Pc | FR |
| $\sigma^{2}$g | 0.65 | 0.35 | 2.17 | 1.68 | 22.82 | 30.14 |
| $\sigma^{2}$e | 0.22 | 0.14 | 0.28 | 0.4 | 1.07 | 5.92 |
| $\sigma^{2}$p | 0.87 | 0.5 | 2.45 | 2.08 | 23.89 | 36.06 |
| Heritability% | 74.37 | 71 | 88.52 | 80.84 | 95.52 | 83.58 |
| GCV | 3.77 | 2.56 | 8.53 | 6.93 | 5.9 | 6.78 |
| PCV | 4.38 | 3.07 | 9.09 | 7.75 | 6.04 | 7.4 |
Table 8: Components of variances, coefficients of variation, heritability for Brix%, Sucrose% and Purity% in fourteen PC (plant c
| Parameters | Sugar recovery | Cane yield | Sugar yield | |||
| Parameters | Pc | FR | Pc | FR | Pc | FR |
| $\sigma^{2}$g | 1.74 | 1.68 | 68.12 | 85.25 | 1.1 | 1.12 |
| $\sigma^{2}$e | 0.17 | 0.36 | 1.88 | 1.08 | 0.12 | 0.19 |
| $\sigma^{2}$p | 1.92 | 2.03 | 70.01 | 86.33 | 1.22 | 1.31 |
| Heritability% | 90.99 | 82.5 | 97.31 | 98.75 | 90.21 | 85.43 |
| GCV | 11.56 | 10.47 | 11.43 | 12.42 | 12.77 | 11.6 |
| PCV | 12.15 | 11.58 | 11.72 | 12.63 | 13.63 | 12.73 |
Table 9: Components of variances, coefficients of variation, heritability for Sugar recovery%, Cane yield and Sugar yield in PC (
Table 8: Components of variances, coefficients of variation, heritability for Sugar recovery%, Cane yield and Sugar yield in PC (plant cane), FR (first ratoon). Table 8: Components of variances, coefficients of variation, heritability for Sugar recovery%, Cane yield and Sugar yield in fourteen promising sugarcane genotypes for plant crop and first ratoon Genotypic and phenotypic coefficient of variance. The genotypic coefficient of variability (GCV) was moderate for stalk weight followed by sugar yield, cane yield and sugar recovery in both plant and ratoon crops, whereas, brix was lowest also in both plant and ratoon crops (Tables 6-8). The slightly high phenotypic coefficient of variability (PVC) over GVC throughout the plant and ratoon crops indicated a good scope for selection of these characters. However, the differences between the estimates of GCV and PCV was comparatively narrow for all the characters, suggesting the possibility of affective selection of these traits and indicating high prospects for genetic progress through selection under the conditions of this investigation. The same finding was observed by earlier workers, viz. Nair, et al., Singh, et al., Verma, et al., Gosh and Singh and Bhaskar [26, 31, 32, 33, 34]. The success of a variety improvement program depends largely on the amount of genetic variability present in the population. The GCV values for stalk weight and its components like sugar yield, cane yield and sugar recovery were larger than the values for juice brix, purity and sucrose content. Singh and Singh also reported the large amount of genetic variation for stalk height, diameter and number of millable canes in clonal population and concluded that progress in breeding for higher sucrose yield can be made by emphasizing selection for high sucrose content at early ripening stage along with higher cane yield. Degree of Heritability: It is evident from Tables 6-8 that cane yield, sugar recovery, sugar yield, purity, sucrose percent and stalk length were highly heritable characters in both plant and first ratoon, while stalk diameter and stalk weight were highly only in plant crop and first ratoon, respectively. It might be due to high genetic variance or low environmental variance or both. Thus, high values of heritability suggested the possibility of improvement of these characters through selection Singh and Singh, which may indirectly help in the yield and quality improvement Gravois, et al. [35, 36, 37, 38, 39, 40].
References
-
Hogarth DM (1987) Genetics of sugarcane. Developments in Crop Science 11: 255-271.
-
Jackson PA (2005) Breeding for improved sugar content in sugarcane. Field Crops Research 92(2-3): 277-290.
-
Doule RB, Balasundaram N (2003) Genetic variability in sugar yield and its components for selection of sugarcane. Journal of Maharashtra Agricultural Universities 27(3): 326-327.
-
Singh A, Lal UR, Mukhtar HM, Singh PS, Shah G, et al. (2015) Phytochemical profile of sugarcane and its potential health aspects. Pharmacogn Rev 9(17): 45- 54.
-
Bardhan SR, Rao AR, Mehra PK, Marwaha S, Wahi SD (2015) Identification of suitable clustering method and allocation strategy for core set developlment in salt stress tolerant rice (Oryza sativa) germplasm. Indian Journal of Agricultural Sciences 85(12): 1560- 1564.
-
AOAC (1980) Official Methods of Analysis. USA pp:
-
Wu C, Wang Y, Xia H, Li F, Yang K, et al. (2009) Research on Heritability and Combing Ability of Creation Parents in Yunnan Sugarcane. Southwest China J Agric Sci 122(15): 1274-1278.
-
Singh RK, Singh GP (1998) Effect of sampling time on efficacy of selection for quality traits in sugarcane. Sugar Cane 2: 12-18.
-
Yadav RL, Sharma RK (1980) Effect of nitrogen levels and harvesting dates on quality characters and yield of four sugar cane genotypes. Indian Sugar Cane Journal 50(7): 581-589.
-
Mathur RB (1981) Handbook of cane sugar technology. Oxford & IBH Publishing Co.
-
Snedecor GW, Cochran WG (1981) Statistical Methods. Iowa State Univ Press Ames Iowa (7 Edn) USA.
-
Steel RGD, Torrie JH (1980) Principles and Procedures of Statistics. Second Edition, McGraw-Hill Comp. New York.
-
Singh RK, Singh GP (1999) Effect of Early Evaluation of Genotypes on Genetic Variability, Repeatability and Predictability in Plant and Ratoon Crops of Sugarcane. Sugar Technology 1(4): 128-131.
-
Chaudhary RR (2001) Genetic Variability and Heritability in Sugarcane. Nepal Agricultural Research Journal 4: 56-59.
-
Jamoza JE, Owuoche J, Kiplagat O, Opile W (2014) Broad-Sense Heritability Estimation and Correlation among Sugarcane (Saccharum spp. Hybrids) Yield and Some Agronomic Traits in Western Kenya. International Journal of Agricultural Policy and Research 2(1): 16-25.
-
Johnson HW, Robinson HF, Comstock RE (1955) Estimates of genetic and environmental variability in soybean. Agron J 47(7): 314-318.
-
Gravois KA, Milligan SB (1992) Genetic Relationships between Fiber and Sugarcane Yield Components. Crop Science 32(1): 62-67.
-
Sanghera GS, Tyagi V, Kumar R, Thind KS (2014) Genetic Variability For Cane Yield, Earliness And Quality Traits In Sugarcane Under Subtropical Region Of India. International Journal of Current Research 6(8): 7763-7765.
-
Tena E, Mekbib F, Ayana A (2016) Heritability and Correlation among Sugarcane (Saccharum spp.)Yield and Some Agronomic and Sugar Quality Traits in Ethiopia. American Journal of Plant Sciences 7(10): 1453-1477.
-
Yousif EMM, IbrahIm MM, El-Aref, Ahamed AZ (2015) Management of nitrogen fertilization for sugar cane on a sandy Soil: I yield and its components. Egypt J Appl Sci 30(11): 498-511.
-
Mehareb EM, Abou-Elwafa SF, Galal MOA (2015) Comparative Performance of sugarcane genotypes for ratoon ability in early clonal selection stages. Journal of Sugarcane Research 5(2): 11- 21.
-
Mehareb EM, Abazied SR (2017) Genetic Variability of Some Promising Sugarcane Varieties (Saccharum spp) under Harvesting Ages for Juice Quality Traits, Cane and Sugar Yield. Open Access Journal of Agricultural Research 2(2): 1-14.
-
Ahmed AZ (2017) Response of three sugarcane varieties to phosphorus bio fertilization. Egypt J Agron 39(2):149-158.
-
El-Shafai AMA, Ismail AMA (2006) Effect of row spacing on yield and quality of some promising sugarcane varieties. Egypt J Appl Sci 21(11): 32-46.
-
Mehareb EM, kun Y, Jun Z, Aboelenen FF, Wei Q, et al. (2017) Evaluation of seventy six sugarcane families at early selection stages. Journal of Plant Breeding and Crop Science 9(9): 151-159.
-
Ghosh J, Singh JRP (1996) Variability in early maturing clones of sugarcane (Saccharumspp). Coop Sug 27(5): 341-344.
-
Hapase RS, Hapase DG (1990) Genetic variability studies in late maturing sugarcane varieties. Bhartiya Sugar 15(10): 13-16.
-
Verma PS, Pal S, Karma NK (1999) Genetic variability and correlation studies in sugarcane. Indian Sugar 49(2): 125-128.
-
Kumar N, Singh, T, Kumar V (2010) A study on genetic parameters, repeatability and predictability in plant and ratoon crops of sugarcane (Saccharum officinarum L.). Indian Sugar LX (2): 23-27.
-
Pawar DS, Hapse RS, Repale JM, Deshmukh RB (2011) Studies on genetic variability, heritability and genetic advance in different sugarcane genotypes. Proc of 10th Joint Conv Of STAI and DSTA pp: 206-215.
-
Nair NV, Somarajan KG, Baasundaram N (1980) Genetic variability, heritability and genetic advance in Saccharum officinarum L. Int Sugarcane J 82(981): 275-276.
-
Singh HN, Singh SB, Chauhan RVS, Vishwakarma RS (1983) Variability for yield and quality in sugarcane. Indian J Agric Sci 53: 786-789.
-
Verma PS, Dhaka RPS, Singh HN (1988) Genetic variability and correlation studies in sugarcane. Indian J Genet 48: 213-217.
-
Bhaskar JV (2003) Genetic Architecture Of Cane Yield, Sugar Yield And Quality Parameters In Selected Elite Clones Of Sugarcane (Saccharum officinarim L.). M.Sc. (Agri) Thesis, Univ Agric Sci Bangalore pp: 114.
-
Singh RK, Singh S (1994) Early evaluation of crosses for varietal improvement in sugarcane. Sugar Cane 3: 17-21.
-
Gravois KA, Milligan SB, Martin FA (1991) Additive genetic effects for sugarcane yield components and implications for hybridization. Trop Agric (Trinidad) 68: 376-380.
-
Doule RB, Balasundaram N (1997) Variability, heritability and genetic advance for yield and quality attributes in sugarcane. Indian Sugar 47(7): 499502.
-
Hapase RS, Repale JM (2004) Variability studies of some quantitative and qualitative characters in sugarcane varieties. Indian Sugar LIV (3): 205210.
-
Leclerg EL, Leonard WH, Clark AG (1962) Field plot technique. Minnesota, Burgess Publishing Co.
-
Patil PP, Patel DU (2017) Study of Genetic Variability and Heritability in Sugarcane (Saccharum spp. Complex).nt. J Curr Microbiol App Sci 6(9): 3112- 3117.
- Enhancement of Vegetative Growth and Fruit Yield in Cucumber (Cucumis sativus L.) via Spiritual Blessing (Biofield) Energy Intervention
- Production of Açaí (Euterpe oleracea Mart.) under Different Agroforestry System Management Intensities in Amazonian Floodplain (Varzea) Forests
- Coffee and the Production Region: What is the Secret to the Expression "Quality"?
- Experiential Agripreneurship Training in Sub-Saharan Africa: Integrating a Business Incubator into Postgraduate Livestock Education at the University of Buea
- Advances in Agricultural High-Quality Development
- Linking Compost Residue to ABAGE in Plants - a Short Note