Mineral Fertilization of Potato Crop and Quantitative and Qualitative Characteristics in Southwestern Ethiopia
A field experiment was conducted to determine the optimum rates of phosphorous (P) and potassium (K) fertilizers for high yield and better tuber quality of potato (var. Jalanne) on Nitisols of Jimma, in 2011/12 under rain fed conditions. Four levels of P (0, 20, 40 and 60 kg P ha-1) and three levels of potassium (0, 55 and 110 kg K ha-1) were combined in a 4x3 factorial arrangement in Randomized Complete Block Design (RCBD) with three replications. Data were collected on yield, and tuber quality parameters such as dry matter, specific gravity and starch content. The result of the study showed significant effects P and K fertilizers on major yield parameters: harvest index, total tuber yield, marketable tuber yield, total tuber number, marketable tuber number, tuber diameter, mean tuber weight and tuber quality parameters: dry matter content tuber specific gravity, and starch content. The higher total tuber number (11), marketable tuber yield (41.4 t ha-1) and total tuber yield (44.9 t ha-1) was obtained from the combined application of 60:110 kg of P:K ha-1. An increased P application levels resulted in a reduced dry matter content of potato tuber from 24.9 to 20.9%. The highest dry matter content was obtained with no P application while the lowest was obtained from application of 60 kg P ha-1. Unlike P, increased level of K nutrient application from 0 to 110 kg ha-1 increased the dry matter content from 21.1 to 24.4%. Similarly, increasing the application of P from 0 to 60 kg ha-1 significantly decreased specific gravity of the tuber while increasing K levels from 0 to 110 kg K ha-1 increased the tuber specific gravity. Further, higher levels of P and K increased the starch content of potato tuber. Starch content was relatively higher in tubers treated with K compared to P treatments suggesting that the use of higher rates of K in potato could tend to enhance starch content in potatoes.
Introduction
Low soil fertility is one of the most important constraints limiting potato production in Eastern Africa. Accelerated and sustainable agricultural intensification is Thesis required for suitable potato production [1]. Fertility of most Ethiopian soils have already declined due to continuous cropping, abandoning of fallowing, reduced use of manure, crop rotation and removal of nutrients together with the harvested crops. The use of residues as fuel, which should be added to the soil, and erosion coupled with low inherent fertility are among the main causes for decreasing soil fertility [2, 3]. Soil fertility management is critical to profitable potato production. Potatoes have a relatively high phosphorus (P) requirement and availability of P to plants is reduced as pH decreases or calcium carbonate concentrations increase causing a reduction of P solubility [4]. Excessive P fertilizer application to potatoes can reduce zinc (Zn) uptake and yield and tuber size [5, 6]. Phosphorus is neither mobile nor subject to gaseous losses. In fact, the potential problem with P is related to the reasons why it is not mobile [7, 8].
The requirement of potato crops for nitrogen, phosphorus, and potassium (K) is known to increase with the introduction and adoption of improved varieties, better cultivation, irrigation facilities and better control of pests and diseases [9]. This situation would become more critical in potato production in view of the fact that the potato crop is known to be a heavy feeder of plant nutrients [10, 11]. Regardless of the fertility status of the soil and the types of cultivar, the blanket national recommendation of 165 kg urea and 195 kg DAP ha-1 is being used for potato production in Jimma, southwest Ethiopia. Potatoes grown for food and processing must not only produce good yields but also supply high dry matter and quality starch [12]. However, there is lack of adequate scientific data on the response of improved potato varieties to P and K application rates with regards to yield and quality. Hence, realizing the importance of fertilizers in crop production, the use of inorganic fertilizers in potato production is very essential. However, very little is known of the effects of P and K on yield and tuber quality of potato in the country in general and southwest Ethiopia in particular. Therefore, this study was carried out to study the effect of different levels of P and K fertilizers on tuber yield, dry matter production and starch content of potato at Jimma, southwest Ethiopia.
Materials and Methods
Description of the Experimental Site: The experiment was conducted under field condition at jimma University College of Agriculture and Veterinary Medicine (JUCAVM) research field in the year 2011/12 under rain- fed condition. JUCAVM is geographically located 346 km southwest of Addis Ababa at about 7°33'N latitude and 36°, 57'E longitude at an altitude of 1710 meter above sea level. The analysis of soil samples from the top 30 cm depth of the experimental site before setting up of the experiment revealed that the soil contains 1.5% organic carbon, 0.14% total nitrogen, 2.8 mg kg-1 available phosphorus, 53.1 (μS/cm) Electrical conductivity, bulk density (g/cm3) of 1.57 and a pH(H2O) value of 5.95. The mean maximum and minimum temperatures are 26.8°C and 11.4°C, respectively [13]. Experimental Materials: The experiment consisted of two types of fertilizers, P and K. The fertilizer treatments consisted of four levels of P (0, 20, 40 and 60 kg P ha-1) and three levels of K (0, 55 and 110 kg K ha-1). Triple Super Phosphate (TSP: 46% P2O5) and potassium Sulphate (K2SO4) (60% K2O) were used as P and K fertilizer sources, respectively. The whole doses of P and K treatments were applied during planting manually. Recommended dose of Nitrogen (N) (110kg N ha-1) was applied as basal dose split into two (50% at planting and the remaining 50% 45 days after planting) to each treatment plot. Standard potato seed tubers (45-60 g) of potato variety Jalanne was used as planting material for the experiment. Jalnne is a released variety for it its high yield, late blight tolerance and wide adaptability [14]. It is widely grown in the study area. Planting was done on 20th August, 2011 and harvested on November 14, 2011. Experimental Design and Treatments: The experiment was laid out in a 4 × 3 factorial design arranged in Randomized Complete Block Design (RCBD) with three replications. The treatments were randomly assigned to the experimental plots in each block (replication). Experimental Procedures: The plot size was 3m×3m (9 m2) with spacing of 75cm between rows and 30 cm between plants. Spacing between plots and blocks was 1 and 1.5 m, respectively. Each plot consisted of 4 rows and 10 plants per row with total plant population of 40 plants per plot. The treatment combinations were randomly assigned to each experimental unit in each block so as to allot one treatment combination only once in each block. Healthy, uniform and 45-50g seed tubers were planted according to the EARO [14] recommendation. All other agronomic management practices were provided as per recommendation equally for all treatments.
Data Collection and Analysis
Yield and Yield Components: Harvesting was done manually when 70% the plants’ leaves in each plot turned yellow. Dehaulming was carried out seven days before harvesting to enhance tuber maturity, facilitate harvesting and reduce tuber bruising. Tuber diameter (cm), total tuber number per plant, average tuber yield per plant (kg plant-1), Mean weight of marketable and unmarketable tubers from the middle rows was recorded after harvest and expressed in kilogram using a sensitive balance, marketable tuber yield per hectare (t ha-1), unmarketable tuber yield per hectare (t ha-1), total tuber yield per hectare (t ha-1).
Tuber Quality Response Variables
Dry Matter Content Of Tuber (%): Five fresh tubers were selected from each plot and weighed, then sliced, and dried in oven at 65°C for 72 hours to a constant weight and dry weight measured then dry matter percentage was calculated as: Dry matter content (DMC) = Dry weight×100 Fresh weight Tuber Specific Gravity (G Cm-3): Specific gravity of tubers was determined by tubers harvested from the middle rows. The harvested tubers were washed and then a representative five kg of clean tubers from each plot was taken. These samples units were weighed in air and reweighed under water method [15]. The average was taken as Specific gravity of tubers and it was calculated based on the following formula. Specific gravity = (weight of tuber in the air)/ [(Weight in air) - (weight in water)] Starch Content Percent of Tuber: Starch content was determined according to the procedures of Liu, et al. [16]. Medium sized or sampled tubers were taken from each plot and washed carefully. These tubers were weighed, peeled and rewashed again. The peeled tuber was grated into fine pulp, placed in clean bucket and stirred with clean water for 10 minutes. The pulp was filtered with a clean fine sieve, the water kept in separate bucket and left to stand overnight. On the next day, the water discarded carefully and a layer of starch appeared at the bottom of the bucket. The surface of the starch rinsed with clean water, covered with more clean water and allowed to settle for 1-2 hours. Next, top water siphoned off, the starch scraped out from the bottom of bucket and the covered starch was dried on clean drying tray continuously until it resembles affine white powder. Lastly, it was grinded finely and weighed using sensitive balance. The starch content percent of tuber was calculated as: Starch content (%) $$ \begin{array}{l} \mathrm {o b j e c t e p r o c e s s e l e c t i o n s} \times 1 0 0 0 \\ \mathrm {o b j e c t e p r o c e s s e l e c t i o n s} \\ \end{array} $$ Statistical Analysis: The data were checked for normality and meeting all ANOVA assumptions and subjected to ANOVA and correlation by using SAS software version 9.2 [17].
Results and Discussion
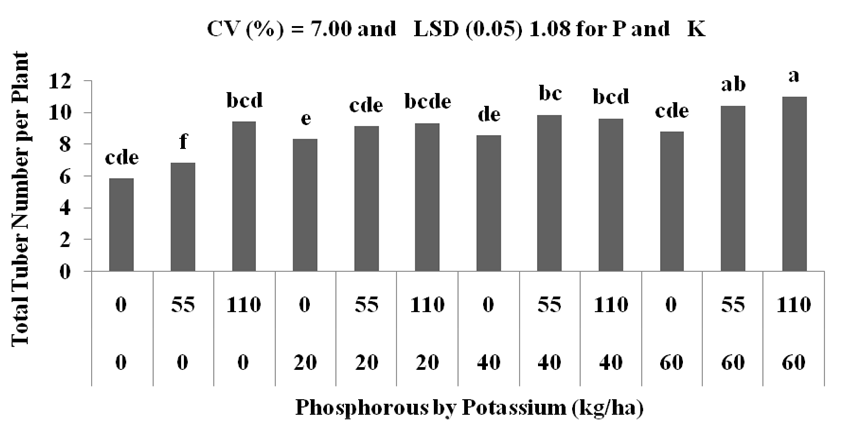
Yield and Yield Components: The major tuber yield and yield components such as tuber diameter, marketable tuber number, and tuber weight per plant and harvest index were significantly influenced by the main effects of applied P and K (Table 1). Total tuber number, marketable tuber yield and total tuber yield were significantly affected by the interaction effect of P and K. The results are discussed hereunder in light of the available literature.
| Parameters | P | K | P*K | ||||||||
|---|---|---|---|---|---|---|---|---|---|---|---|
| HI | 0.0613** | 0.0058** | 0.0001ns | ||||||||
| TD | 35.65** | 10.13** | 0.45 ns | ||||||||
| MTW | 24.58** | 16.23** | 1.36 ns | ||||||||
| TTN | 12.88** | 10.98** | 0.78* | ||||||||
| MTY | 322.67** | 105.47** | 4.91* | ||||||||
| TTY | 378.78** | 123.74** | 5.77* |
Table 1: Mean square values of harvest index (HI), tuber diameter (TD), mean tuber weight (MTW), total tuber number (TTN), market
Table 1: Mean square values of harvest index (HI), tuber diameter (TD), mean tuber weight (MTW), total tuber number (TTN), marketable tuber yield (MTY), and total tuber yield (TTY). *, & Ns indicate significant, highly significant and non- significant respectively. Harvest Index: Increasing the application of P from 0 to 60 kg ha-1 decreased harvest index from 0.89 to 0.69 (Table 2). The reduction in harvest index due to P did not appear to be associated with a decrease in total tuber yield. This is because the total biomass increased more than the harvestable portion in response to the application of phosphorous. Therefore, the yield advantage obtained through the use of P fertilizers might not be attributed to its effect on increment of harvest index; rather a parallel increase in both harvestable and non-harvestable parts was apparent. The presence of high harvest index is associated with the production of high tuber yield relative to the other biomass. In the same manner, increasing K nutrient application from rates of 0 kg K ha-1 to 110 kg K ha-1 decreases the harvest index from 0.83 to 0.78. In general, although harvest index is commonly used as a key plant parameter, it may not necessarily correlate with high tuber yield. This is possible where the applications of mineral nutrients enables a potato crop to exhibit a high rate of assimilate production or high total biomass and maintain active growth later in the season. This may be because of the K requirement of potato plants increases with yield and its functions are linked to photosynthesis. Harvest indices of 0.75-0.85 are more common in temperate zone but in hotter climates, the harvest index tends to be lower and often a wider variation is observed between cultivars or growing conditions [18]. Tuber Diameter: The table 2 revealed that the main effects of both P and K nutrients were significant and increased levels of these nutrients significantly increased the potato tuber diameter. In the case of P, tuber diameter increased from 7.7 cm to 12.3 cm and from 9.15 cm to 11.04 cm in the case of potassium applications. The higher levels of both P (60 kg P ha-1) and K nutrients (110 kg K ha-1) significantly increased tuber diameter compared with other treatments. This effect of P on tuber diameter of potato may be through its influence on the tuber development of potato plants [19]. Mean Tuber Weight Per Plant**: Higher levels of P (60 kg P ha-1) and K (110 kg K ha-1) produced significantly higher tuber weight per plant (1.25 kg plant-1) and (1.10 kg plant-1), respectively (Table 2). Higher levels of both P and K nutrients gave better results because plants got significant nutrients which improved the growth and development of potato plants and ultimately tuber production by influencing physiological processes particularly of photosynthesis of potato plants. The results of the present findings indicated that appropriate levels of P and K are required to improve average tuber weight of the potato plant and hence to increase tuber yield. Similarly, De La Morena, et al. [20] reported that yield increment due to mineral nutrition was attributed to its effect on average tuber weight. The increase in average tuber weight with the supply of fertilizer nutrients could be due to more plentiful growth, more foliage and leaf area and higher supply of photosynthates which helped in producing bigger tubers, hence resulting in higher yields. In other words, the increased size and duration of the plant stemmed from improved supply of nutrients favored the tuber weight. Similarly, the average tuber weight was reported to increase in response to the application of K, which was an evident in the current investigation [21].
| Phosphorous (kg/ha) | Harvest index (%) | Tuber diameter (cm) | Mean tuber weight(kg) | ||||||||
|---|---|---|---|---|---|---|---|---|---|---|---|
| 0 | 0.89d | 7.72d | 0.67d | ||||||||
| 20 | 0.84c | 9.16c | 0.72c | ||||||||
| 40 | 0.78b | 10.73b | 0.97b | ||||||||
| 60 | 0.69a | 12.34a | 1.25a | ||||||||
| LSD 0.05 | 0.01 | 0.57 | 0.12 | ||||||||
| Potassium (kg/ha) | |||||||||||
| 0 | 0.83c | 9.15c | 0.72c | ||||||||
| 55 | 0.80b | 9.77b | 0.89b | ||||||||
| 110 | 0.78a | 11.04a | 1.10a | ||||||||
| LSD 0.05 | 0.01 | 0.49 | 0.13 | ||||||||
| CV% | 1.12 | 5.82 | 17.69 |
Table 2: Harvest index, tuber diameter and mean tuber weight per plant as influenced by main effects of P and K. Means followed b
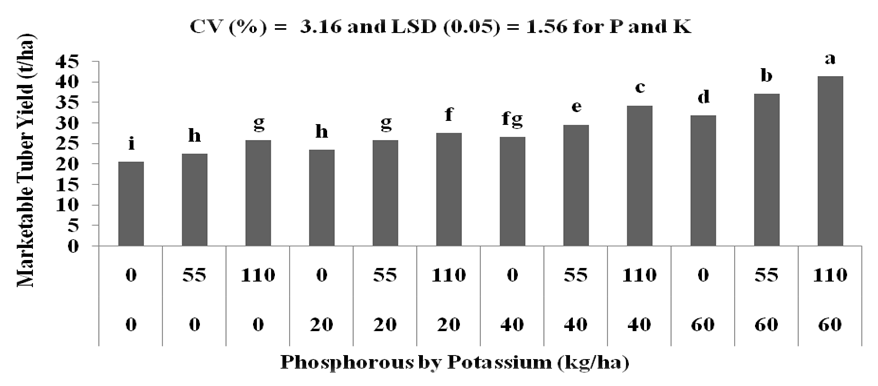
Furthermore, the highly significant positive correlation of marketable tuber yield with plant height (r = 0.68), leaf area index (r = 0.95), total tuber yield (r =
0.99) in the present study revealed that the presence of high marketable tuber yield is associated with the positive influences of P and K on the rate of photosynthesis and dry matter accumulation efficiency. The strong association (r=0.70) between marketable tuber yield and total tuber number signify that the increment in tuber number substantially contributed to tuber yield increment in response to the fertilization treatments. Tekalign T, et al. [25] have observed strong association between tuber fresh mass and number.
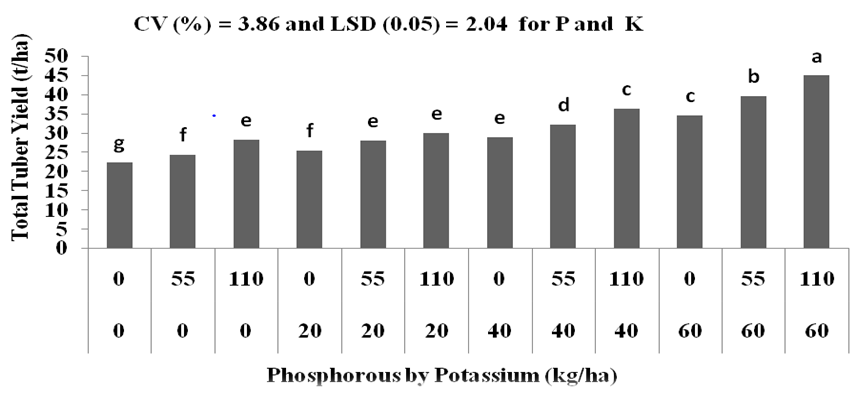
Total tuber yield: The statistical analysis of data recorded on total tuber yield has shown that application of P and K had a highly significant effect on total tuber production. The interaction as well as the main effects between P and K resulted in a highly significant (P<0.001, Table 1) effect in respect of the total tuber yield (Figure 3). The maximum total tuber yield (44.9 t ha-1) was obtained from the combined application of P:K at 60:110 kg ha-1. This value was statistically similar with the total tuber yield (39.6 t ha-1) that was obtained from plots that received combination of P and K at 60:55 kg ha-1. The lowest total tuber yield (22.3 t ha-1) was obtained from the control treatment which was on par with the combine application of P:K at 0:55 and 20:0 kg ha-1. The total tuber yield significantly increased from 25.0 t ha-1(in control This might also be due to the role of phosphorous in root development and cell division, and energy translocation that contributes towards the increment of tuber yield [26]. Moreover, total tuber yield was highly significant and positively correlated with plant height (r = 0.66) and leaf area index (r = 0.94). This association indicates that an increased photosynthetic area in response to P K fertilization had substantially contributed to enhance potato productivity that could be through the production of more assimilates.
treatments) to 39.7 t ha-1 (at 60:110 kg P: K ha-1) (Figure 3). This result could be due to positive interaction and complementary effect between phosphorus and potassium in affecting total tuber yield.
Quality parameters
Dry Matter Content Of Potato Tubers: Main effects of P and K application had shown a highly significant (P<0.001, Table 3) effect on dry matter content of potato tuber. But, the interaction effects of P and K were found statistically non-significant (P >0.05) on dry matter content of potato tuber. An increased phosphorus application levels resulted in a reduced dry matter content of potato tuber from 24.9 to 20.9%. The highest dry matter content was obtained with no P application while the lowest dry matter content was obtained from application of 60 kg P ha-1. In line with the present finding, Assefa [27] observed significant reduction in percent dry matter of potato tubers due to increased phosphorus application. In addition, Daniel [28] also noted a reduction in tuber dry matter content when application of phosphorus fertilizer increases. Sparrow, et al. [22] observed non significant reduction in percent dry matter of tubers due to increased P application. Similarly, application of K had shown a significant (P <0.001) effects on dry matter content. Increased level of K nutrient application from 0 to 110 kg ha-1 increased the dry matter content from 21.1 to 24.4%. The lowest dry matter content was observed at zero level of K application and the highest dry matter content was observed at potassium application of 110 Kg K ha-1 (Table 4). This finding is supported by the results of Tawfik [29] who reported that potato plants fertilized with high K rate had significantly higher dry matter content than potato plants fertilized with low K fertilizer rate. Specific Gravity of Potato Tubers: The results presented in Table 3 revealed that main effects of P and K had shown a highly significant (P<0.001) difference on tuber specific gravity. However, the interaction effects of P and K were statistically non-significant (P >0.05). Increasing the application of P from 0 to 60 kg ha-1 decreased specific gravity of tuber. The highest specific gravity of tuber (1.079) was obtained with no phosphorus application. This value is greater than 1.077 for all phosphorus levels hence it is within the acceptable range for processing [30]. In contrast, the lowest tuber specific gravity (1.00) was obtained with application of 60 kg P ha-1 (Table 4). It is worth to mention that special consideration should be given to the application of mineral nutrients to produce potato for processing as specific gravity is a good indicator of potato tuber quality because it is proved that specific gravity is an excellent indicator of tuber dry matter content. Tuber specific gravity was significantly and positively correlated with dry matter content (r = 0.42**) concurring with the report of Tekalign and Hammes [25];
| Parameters | P | K | P*K | ||||||||
|---|---|---|---|---|---|---|---|---|---|---|---|
| DMC | 99.783** | 47.1081** | 1.238ns | ||||||||
| SG | 0.0107** | 0.0034** | 0.00021ns | ||||||||
| St | 23.322** | 7.883** | 0.268ns |
Table 4: Mean square values for dry matter content (DMC), specific gravity (SG) and starch content (St). *, ** & ns indicate sign
Similarly, application of K had also shown a highly significant (P <0.001) effects on tuber specific gravity. Unlike the case of P, increasing K nutrient application from 0 to 110 kg K ha-1 increased the tuber specific gravity from 1.023 to 1.061 g cm-3. The lowest tuber specific gravity was observed at zero level of K application and the highest tuber specific gravity was observed at 110 Kg ha-1 (Table 4). This finding is supported by the results of Chapman, et al. [31] who reported an increase in specific gravity due to K application. Starch Content of Tubers: The Starch content of potato tuber was significantly affected by P and K application. Increased P application from 0 to 60 kg P ha-1 has increased the starch content of potato tuber from 10.49 to 13.80%. The highest starch content was obtained from the application of 60 kg P ha-1 and the lowest starch content was obtained from the control (Table 4).
Similarly, application of K had also shown a highly significant (P<0.001) effects on starch content. Starch content was relatively higher in tubers treated with K as compared to P treatments. The difference between applied K levels was significant which indicates that the use of higher rates of K in potato would tend to enhance starch contents in potatoes. Higher levels K application in sufficient quantities had a positive effect on enhancing starch contents. Increasing K application from 0 to 110 kg ha-1 resulted in increasing the starch content from 11.1 to 13.1% (Table 4). This finding is supported by the results of who obtained increased starch content in potato tubers with K application. Gray and Hughes [32, 33, 34] reported that starch constitutes 65–80% of the dry matter content of the potato tuber. The positive, strong linkage observed in the current study between dry matter and starch content is in agreement with this concept.
| Phosphorus (kg/ha) | DMC (%) | SG (g/cm3) | St (%) | ||||||||
|---|---|---|---|---|---|---|---|---|---|---|---|
| 0 | 24.90d | 1.00d | 10.49d | ||||||||
| 20 | 23.45c | 1.03c | 11.26c | ||||||||
| 40 | 22.16b | 1.06b | 12.45b |
Table 3: Dry matter content (DMC), specific gravity (SG) and starch content (St) as affected by main effect of P and K. Means fol
Conclusion
Mineral fertilization of potato with P and K fertilizers has been shown to have a sound and promising impact on tuber yield and quality of potato in the present study. Hence, combined application of phosphorus (60 kg ha-1) and potassium (110 kg ha-1) fertilizers appeared to be superior for total tuber number, total and marketable tuber yields and starch content.
Acknowledgments
Authors are very much grateful to College of Agriculture, Jimma University, Ethiopia for funding this experiment and the Jigjiga University, Ethiopia for offering the study leave to the first author.
References
-
Muriithi L, Irungu J (2004) Effects of integrated use of inorganic fertilizer and organic manures on bacterial wilt incidence and tuber yield in potato production systems on hill slopes of central Kenya. Journal of Mountain Science 1(1): 81-88.
-
Taye B, Yeshanew A, Balesh T, Girma K (1996) Soil fertility management in Barley. In: Barely Research in Ethiopia past works and future prospects.
-
Tilahun A, Endrias G, Takele B (2007) Reversing the degradation of arable land in Ethiopian highlands, Managing Africa's soil. No. 23, IIED-London.
-
Stark JS, Westermann DT (2003) Potato Nutrient Management. In: Idaho Potato Production Systems. University of Idaho Current Information Series.
-
Christensen NW, Jackson TL (1981) Potential for phosphorus toxicity in zinc-stressed corn and potato. Am J 45: 904-909.
-
Idaho Potato Commission (1997) Research and Extension Progress Reports. University of Idaho, pp: 39-44.
-
Hopkins BG, Rosen CJ, Shiffler AK, Taysom TW (2008) Enhanced efficiency fertilizers for improved nutrient management: Potato (_Solanum tuberosum_). Online Crop Management.
-
Loneragan JF, Webb MJ (1993) Interactions between zinc and other nutrients affecting the growth of plants. In: Zinc in Soils and Plants, Robson AD, (Ed.), Proceedings of the International Symposium on Zinc in Soils and Plants. Kluwer Academic Publishers, Boston. Christensen, NW, pp: 119-134.
-
Raheja PC (1966) Soil Productivity and Crop Growth. Asia Publishing House, Bombay.
-
Sikka L (1982) Fertilizer and manure requirements of the potato. In: Potato Seed Production for Tropical Africa. Nganga S, Shideler F, (Eds.), CIP Lima, Peru.
-
Horton D (1987) Potatoes: production, marketing and for developing countries. West view press (Boulder), IT Publications, London, pp: 2256.
-
Bogucka B (2014) Effect of different mineral fertilization technologies on the size of starch granules in potato. Starch/Starke 66(7-8): 685- 690.
-
BPEDORS (2000) Physical and socio economical profile of 180 District of Oromia Region. Bureau of Planning and Economic Development of Oromia Regional state, Physical planning Development. Finfinne, Ethiopia, pp: 248-251.
-
EARO (Ethiopia Agriculture Research Organization) (2004) Directory of released crop varieties and their recommended cultural practices: Ethiopian Agricultural Research Organization, Addis Ababa, pp: 12.
-
Kleinkopf GE, Westermann DT, Wille MJ, Kleinscmidt GD (1987) Specific Gravity of Russet Burbank Potatoes. American Potato Journal 64(11): 579-587.
-
Liu Q, Weber E, Currie V, Yada R (2003) Physicochemical properties of starches during potato growth. Carbohydr. Polym 51(2): 213-221.
-
SAS Institute Inc (2008) SAS/STAT® 9.2. User's Guide. Cary, NC: SAS Institute Inc.
-
Beukema HP, van der Zaag DE (1990) Potato improvement. International Agricultural Centre, Wageningen, The Netherlands, pp: 1-208.
-
Greenwood DJ, Stone DA (1998) Prediction and measurement of the decline in the critical-K, the maximum K and total plant cation concentration during the growth of field vegetable crops. Annals of Botany 82(6): 871-881.
-
De la Morena, Guillen IA, Garcia del Morel LF (1994) Yield development in potatoes as influenced by cultivar and the timing and level of nitrogen fertilizer. American Potato Journal 71(3): 165-173.
-
Panique EKA, Kelling EE, Schulte DE, Hero WR, James RV, et al. (1997) Potassium rate and source effects on potato yield, quality, and disease interaction. American Potato Journal 74(6): 379-396.
-
Sparrow L, Chapman K, Parsley D, Hardman P, Cullen B, et al. (1992) Response of potatoes (Solanum tuberosum L.) to band placed and broadcast high cadmium phosphorus fertilizer on heavily cropped Krasnozems in North- Western Tasmania. Australian Journal of Experimental Agriculture 32(1): 113 -119
-
Maier NA, Dahlenburg AP, Williams CMJ (1994) Effects of nitrogen, phosphorus, and potassium on yield and petiolar nutrient concentrations of potato (_Solanum tuberosum_ L.) cv. Kennebec and Atlantic. Australian Journal of Experimental Agriculture 34(6): 825-834.
-
Mulubrhan H (2004) The effects of nitrogen, phosphorus, and potassium fertilization on the yield and yield components of potato (Solanum tuberosum L.); Grown on vertisols of Mekelle area, Ethiopia. An Msc Thesis presented to school of graduate studies, Haramaya University, Ethiopia, pp: 1-62.
-
Tekalign T, Hammes PS (2005) Response of potato grown in a hot tropical lowland to applied paclobutrazol. II: Tuber attributes. New Zealand J Crop Hort Sci 33(1): 43-51.
-
Westermann D, Bosma M (1994) Nutrient concentration relationships between the fourth petiole and upper stem of potato plants, American Potato Journal 71(12): 817-829.
-
Assefa N (2005) Response of two improved potato varieties to nitrogen and phosphorus application. An Msc Thesis presented to School of Graduate studies, Alemaya University, Ethiopia, pp: 75.
-
Daniel M (2006) Effects of integrated nutrient management on agronomic performance of potato (Solanum tuberosum. L.) and fertility of nitisol at Bako. An MSc thesis presented to school of graduate studies, Alemaya University, Ethiopia, pp: 88.
-
Tawfik AA (2001) Potassium and calcium nutrition improves potato production in drip- irrigated sandy soil. African Crop Science Journal 9(1): 147-156
-
Fitzpatrick T, Talley E, Porter W, Murphy H (1964) Chemical composition of potato. III. Relationship between specific gravity and the nitrogenous constituents. American Potato Journal 41(3): 75-81.
-
Chapman KSR, Sparrow LA, Hardman PR, Wright DN, Thorp JRA, et al. (1992) Potassium nutrition of Kennebec and Russet Burbank potatoes in Tasmania: Effect of soil and fertilizer potassium on yield, petiole and tuber potassium concentrations, and tuber quality. Aust J Exp Agric 32(4): 521-527.
-
Gray D, Hughes JC (1978) Tuber quality.. In Harris PM (Ed.), The Potato Crop: The Scientific Basis of Improvement. Chapman and Hall. London, UK, pp: 504-544.
-
Moraghan JT, Mascagni HJ (1991) Environmental and soil factors affecting micronutrient deficiencies and toxicities. Micronutrients in Agriculture, 2nd (Edn.), Soil Science Society of America, Madison, Wisconsin, pp: 371-425.
-
IAR/ICARDA (1993) Proceedings of the First Barely Research Review Worksho. Addis Ababa, Ethiopia, pp: 92-103.
- Enhancement of Vegetative Growth and Fruit Yield in Cucumber (Cucumis sativus L.) via Spiritual Blessing (Biofield) Energy Intervention
- Production of Açaí (Euterpe oleracea Mart.) under Different Agroforestry System Management Intensities in Amazonian Floodplain (Varzea) Forests
- Coffee and the Production Region: What is the Secret to the Expression "Quality"?
- Experiential Agripreneurship Training in Sub-Saharan Africa: Integrating a Business Incubator into Postgraduate Livestock Education at the University of Buea
- Advances in Agricultural High-Quality Development
- Linking Compost Residue to ABAGE in Plants - a Short Note