Molecular Cloning and Abiotic Stress Expression Analysis of Gtpase Era Gene in Mulberry (Morus Alba L.)
Era (E. coli RAS-like protein) forms a unique family of GTPase, its functions in cell cycle control by coupling cell division with growth rate. In the present paper, a cDNA sequence coding GTPase Era mRNA was cloned from mulberry. Sequence analysis showed that its open reading frame (ORF) is 1275 bp in length encoding a protein of 424 amino acids. The GTPase Era gene had era domain and belonged to the FeoB_N superfamily. Phylogenetic analysis based on the amino acid sequences encoded by the GTPase gene from various species showed that the mulberry was closely related to Morus notabilis, Ipomoea nil, Capsicum annuum, Solanum pennellii, Nicotiana sylvestris and Nicotiana tubacum. The expression patterns of GTPase Era treated under drought, low temperature and salt stresses were examined using real-time quantitative PCR (RT-qPCR). The expression level of the mRNA had a significant change under drought, cold and salt stress treatments compared to the normal growth environment with the maximum expression on third day for drought stress, the sixth day for the low temperature stress and the seventh day for the salt stress. These data provide a better understanding of the molecular basis of signal transduction during stress responses in mulberry trees.
Introduction
Many crucial functions for life are provided by a single versatile mechanism that has evolved to fulfill many roles. A prime example is the GTPase superfamily of proteins that occurs in all domains of life, regulating functions such as protein synthesis, cell cycle and differentiation [1]. Despite this extraordinary functional diversity, all GTPases are believed to have evolved from a single common ancestor [2, 3]. Many GTPases have been cloned from plants, but their functional analysis has largely been limited to complementation of mutations in corresponding yeast genes, and antisense experiments which have implicated these proteins in processes such as root nodulation [4, 5, 6, 7]. Era (Escherichia coli RAS-like protein) which forms a unique family of GTPase is widely conserved and essential in bacteria. Era functions in cell cycle control by coupling cell division with growth rate and its homologues also are found in eukaryotes [8]. Recently, homologues of Era also have been identified in human and plant cells [9]. Era is a low-molecular-weight GTPase essential for E. coli viability. The gene encoding Era is found in the rnc operon, and the synthesis of both RNase III and Era increases with growth rate [10]. Several lines of evidence suggest that Era is involved in cell cycle regulation and ribosome assembly and that the GTP-binding and hydrolysis activities of Era are essential for its biological function. Mutations affecting the cellular level or function of Era led to a severe alteration in ribosome assembly, a drastic change in cell morphology, a significant reduction in cell viability and an apparent suppression of temperature-sensitive mutations in a number of the genes that are involved in DNA replication and chromosome partitioning [11, 12, 13]. Partially defective in GTPase Era activity or that are reduced in the synthesis of wild-type Era become arrested in the cell cycle at the pre- divisional two-cell stage [14].
The Era proteins are critical regulators of many aspects of basic cellular processes, including ribosome biogenesis, translation and signal transduction, and it is the least understood of the three genes in the rnc operon. The continued discovery and characterization of similar genes in other organisms, including eukaryotes, promise to yield a more complete understanding of Era’s structure and function [13]. In plants, ERA-related GTPase (ERG) was first found in Antirrhinum majus and is expressed in dividing or metabolically active cells. ERG was predicted to target to the mitochondria by amino-terminal sequences, and a deletion allele of ERG by site-selected transposon mutagenesis resulted in the arrested development of seeds containing embryos and endosperm after fertilization [15]. Genomic data on the ERG genes in Arabidopsis thaliana showed that there are two homologs, AtERG1, localized in chloroplast, and AtERG2, localized in the mitochondria [16]. Cheng, et al. [17] founded that AtERG2 promotes early seed development by affecting the maturation of the mitochondria ribosome small subunit and mitochondrial protein translation in Arabidopsis. Jeon, et al. [18] showed that Nicotiana benthamiana double Era-like GTPase (NbDER) contains two tandemly repeated GTPase domains and a C-terminal KH-like domain involved in RNA binding. However, a genome-wide overview of the GTPase Era genes in plants is not available and this makes GTPase era gene of a particular interest to know its level of expression in mulberry plants. As a perennial tree or shrub, Mulberry (Morus alba L.) is an economically important plant not only used as the sole food plant for the domesticated silkworm, but also for a variety of other purposes, such as the production of edible fruits, medicinal substances, ecological management and ornamental objects [19]. In this study, the sequence of the gene GTPase Era would be cloned, based on the expressed sequence tags (ESTs) from a previously constructed mulberry cDNA library, and compared its molecular characters to that of other identified GTPases. Furthermore, changes in the transcription level of GTPase Era under different abiotic conditions would be detected by real time - qPCR. The results may be helpful to understand more about the role of the gene in the resistance to stresses for plant and also provide the basis for improving the ability to anti-stress by genetic manipulation in the near future.
Materials and Methods
Materials, Growth of Plant and Stress Treatments
To analyze the gene expression under different conditions, mulberry variety ‘Yu711’ was grown under standard conditions at the National Mulberry Gene Bank of the Sericulture Research Institute, Chinese Academy of Agricultural Sciences, Zhenjiang, P. R. China. The mulberry shoots were grafted to mulberry stock. The grafted seedlings were planted in 35 cm diameter pots, each pot containing one seedling, and were grown in an incubator with a 16 h photoperiod at 25°C and 22°C in the day and night respectively. After approximately 2 months, when the shoots had reached approximately 20 cm in length, the seedlings were subjected to drought, salt and cold stress treatments [19].
To simulate drought stress, mulberry seedlings were treated without water for 0 d, 1 d, 3 d, 5 d, 10 d, and 15 d. Salt stress was imposed by irrigating the mulberry with approx. 100 ml of 300 mM NaCl for 0 d, 1 d, 2 d, 4 d, 7 d, and 10 d. To simulate cold stress, mulberry seedlings were grown under 4 ℃ for 0 h, 12 h, 1 d, 3 d, 6 d, and 10 d and then grown under the normal conditions as mentioned above for 2 d and 5 d to renaturation. Leaves were collected at the different time points, immediately frozen in liquid nitrogen and stored at -80°C. They were subsequently used for total RNA extraction.
RNA Isolation and Cloning of the Cdna
Total RNA was extracted from the browses (net weight approximately 100 mg) of the grafted mulberry seedlings using RNAiso Plus reagent, treated with Deoxyribonuclease I, then resuspended in 0.1% (v/v) diethylpyrocarbonate (DEPC)-treated water. The quality of total RNA was determined using an OD260nm/OD280nm ultraviolet spectrophotometer combined with 1.0% (w/v) agarose gel electrophoresis.
Then the first strand cDNA was synthesized from 9-µL of 1 μg/mL total RNA using the RNase H-Reverse Transcriptase M-MLV kit (Takara, China) following the manufacturer’s instructions. According to the EST with the inference function from mulberry cDNA library and the homology sequences in the National Center for Biotechnology Information (NCBI) (http://www.ncbi.nlm.nih.gov/) databases using the BLAST program, the following primers were designed using Oligo 7:Forward primer 1 (F: 5′- ATGGAGCTTCTCGTTCTTCTC -3′) and Reverse primer 1 (R: 5′- ATTCCGTCGATCACTGCTT -3′). The amplification conditions used for the procedure of PCR were as follows: initial denaturation at 94°C for 5 min; followed by 37 cycles of denaturation at 94°C for 30 s, annealing at 57°C for 35 s, and elongation at 72°C for 40 s; with a final extension at 72°C for 7 min. To clone the GTPase Era gene from mulberry, there was a connection of the purified DNA and the T-vector (pMD 20) and then transformation of E. coli BL 21 cells. It was sequenced by Sangon Biotech (Shanghai, China), thus, a cDNA sequence of the GTPase Era was obtained according to fragment assembly, then submitted to the GenBank (GeneBank accession number: MN648491).
Bioinformatics Analysis of the Cdna Sequence of the Gtpase Era Gene
Using the NCBI online Search Tool (BLASTX), the sequence encoding GTPase Era gene was analyzed for identity and similarity. The ORF of the gene sequence was found using the ORF finder program at NCBI (http://www.ncbi.nlm. nih.gov/gorf/orfig.cgi). The protein structure and function- al domains of GTPase Era gene were predicted using the prosite tools of ExPASy (http://prosite.expasy.org/prosite. html/) and SMART (http://smart.embl-heidelberg.de/), the database contains Swiss-Prot, SP-TrEMBL and stable Ensembl proteomes, respectively. SWISS-MODEL (http:// swissmodel.expasy.org/) was used to analyze the molecular modelling of the GTPase Era protein [20]. ProtParam tool of ExPASy (http://web.expasy.org/protparam/) was used to predict the molecular weight and theoretical isoelectric point (pI) of the protein. The homologous sequences were downloaded from the NCBI database, and multiple sequence alignments were performed on the gene’s amino acid se- quences from different species using the ClustalX 2.0 pro- gram and DNASTAR software [21]C. Finally, to determine the relationship between mulberry’s GTPase Era gene and GTPase Era gene from other species, phylogenetic analysis was carried out using the MEGA 6.0 and the JTT substitu- tion model and G+I rates among sites model [22]. 1000 boot- strap replicates were conducted to test the reliability of in- ternal branches. The phylogenetic tree of proteins of GTPase Era gene from different species was constructed according to the maximum likelihood method.
Mulberry Gtpase Era Expression Analysis under Various Abiotic Conditions
The grafted mulberry seedlings which were grown to about 20 cm long were subjected to drought, low temperature and salt stress treatments. Throughout the process of stress-induced, the grafted seedling for all the abiotic stress conditions were not changed. Young leaves taken from the seedlings at the various time interval were quickly frozen in liquid nitrogen and then stored at a temperature of -80°C.
During the process of stress treatments, light intensity and humidity were unchanged. All the stress treatments for their same time interval were carried out three times.
The RT-qPCR method was used to detect the expression level of GTPase Era mRNA under abiotic stress (drought, low temperature and salt). 1 μg of each RNA sample was used as a template for the synthesis of the cDNAs by the same protocol mentioned above. The resultant was then diluted 12-fold and 4 μl cDNA was used as the template to perform the RT-qPCR. The primers designed and synthesized for the RT-qPCR using the same procedure mentioned above is as follows: GTPase Era-1-F (5′- ACACATCCAGGAAACGAACC-3′) and GTPase Era-1-R (5′-TACCCACTCACGCTCACTAA-3′). The internal housekeeping gene β-actin was used as a normalization control for each starting quantity of cDNA templates[19]. The primers of the internal housekeeping gene used are as follows: β-actin-F (5′- AGCAACTGGGATGACATGGAGA-3′) and β-actin-R (5′- CGACCACTGGCGTAAAGGGA-3′). All reactions were assayed in three biological replicates with three technical replicates. The SYBR Green RT-PCR assay was performed in LightCycler® 96 Real-Time PCR System (Roche, USA) by three-step real-time qPCR according to the FastStart Universal SYBR Green Master Mix kit (Roche, USA) protocol. The thermal cycling parameters for RT-qPCR were 95℃ for 10 min followed by 45 cycles of 95℃ for 10 s, 57℃ for 10 s and 70℃ for 10 s. The relative expression differences of mRNAs tissues were calculated using 2-ΔΔCt method[23]. Standard errors and standard deviations were also calculated.
Results
Cloning of Cdna and Sequence Analysis of the Gtpase Era Gene
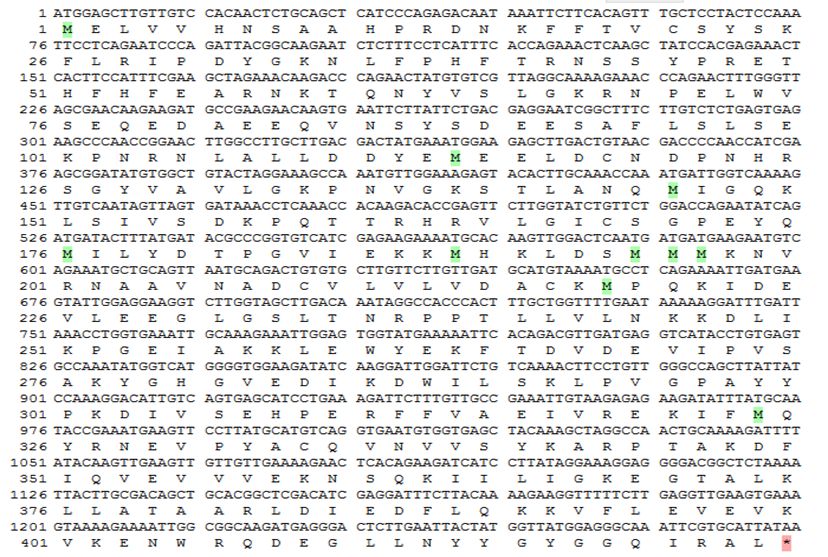
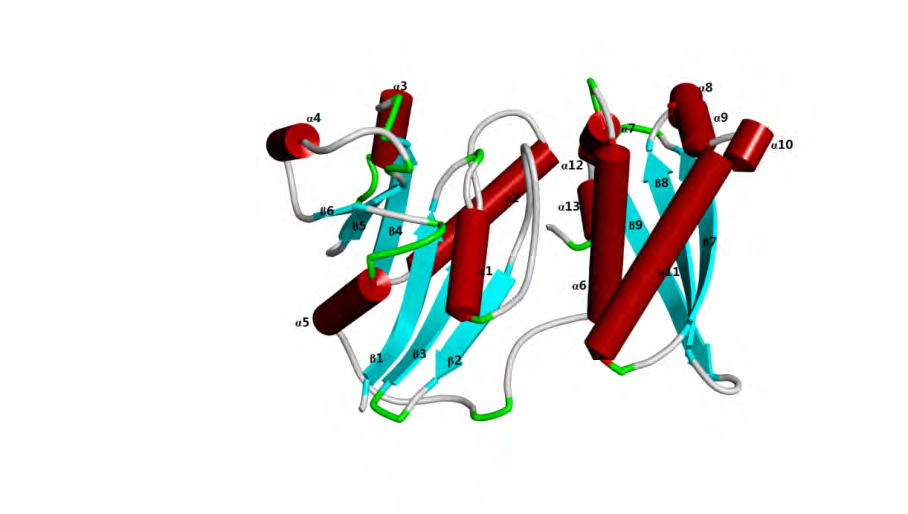
Based on the EST with the inference function from mulberry cDNA library and sequences of the conserved regions of known GTPase Era genes from other plant species, the cDNA of the mulberry GTPase Era gene was cloned by RT-PCR (Supplementary Figure 1) and then sequenced (GenBank accession: MN648491). The obtained cDNA of GTPase Era gene has an open reading frame (ORF) of 1275 bp. The ORF encodes a protein of 424 amino acids of a predicted molecular weight of 48.48 kDa and theoretical isoelectric point (pI) of 6.13 (Figure 1). The GTPase Era had Era domain and belonged to the FeoB_N superfamily. To better understand the molecular modelling of GTPase Era gene, the tertiary protein structure of the gene and its model template alignment were performed online with Swiss- Model software. The intricate spatial architecture showed that, there were 13 α-helix, 9 β-sheet in the three-dimensional structure (Figure 2).
Phylogenetic Tree and Homologous Analysis of Gtpase Era Amino Acids with Other Species
In order to better understand the structure of the deduced amino acid sequence encoded by mulberry GTPase Era gene, a homologous multiple amino sequence alignment was carried out using http://www.uniprot.org/ align internet tool between the amino acid sequences of GTPase Era gene and the amino acids of GTPase genes of other species selected from the NCBI database. The results revealed that the primary structure of the mulberry GTPase era showed high levels of similarity to the GTPase era of the other eight plant species and all the proteins showed a high level of conservation.
To investigate the evolutionary relationships, a phylogenetic tree was constructed with MEGA 7.0 software using the maximum likelihood method. The phylogenetic tree was constructed based on the deduced amino acid sequences encoded by the GTPase Era gene from mulberry and 19 other related species selected from the NCBI database. The results revealed that Morus alba L., Morus notabilis (XM_024177173 ), Ipomoea nil (XM_019327820), Capsicum annuum (XM_016704299), Solanum pennellii (XM_015210823), Nicotiana sylvestris (XM_009804985) and Nicotiana tubacum (XM_016612549) had close relationships, but was slightly distant from that of other species as shown in Figure 3.
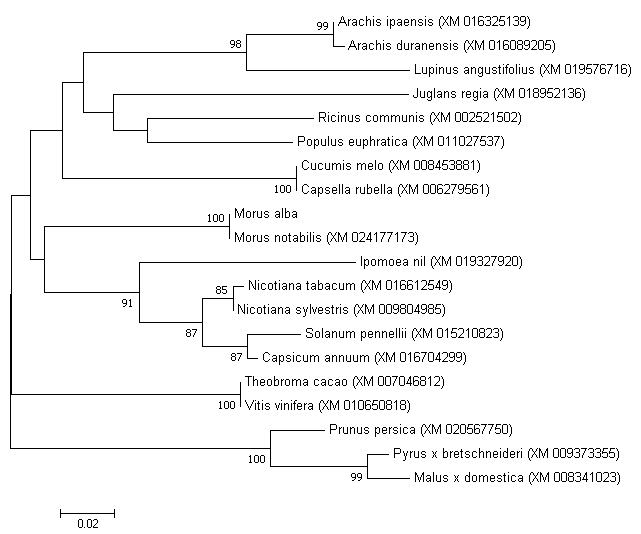
Figure 3: The phylogenetic tree based on amino acid sequence of GTPase era and other homologue sequences from 19 different species. The evolutionary tree was established in the MEGA 6.0 program using the maximum likelihood method and the JTT substitution model and G+I rates among sites model. 1000 bootstrap replicates were conducted to test the reliability of internal branches. The numerals at the branch points indicate bootstrap percentages. Morus alba L., Morus notabilis ((XM_024177173)), Ipomoea nil (XM_019327820), Capsicum annuum (XM_016704299), Solanum pennellii (XM_015210823), Nicotiana sylvestris (XM_009804985) and Nicotiana tubacum (XM_016612549) had close relationships.
Expression of Gtpase Era Gene Under Drought, Low Temperature and Salt Stress Treatments
To further analyzed whether the level of GTPase Era gene expression is induced by various abiotic stresses, the level of the mRNA transcript of the GTPase Era gene under drought, low temperature and salt stress treatments were measured at different time intervals and analyzed by RT-qPCR which showed some fluctuations in the results under the three stress treatments (Figure 4A-4C).
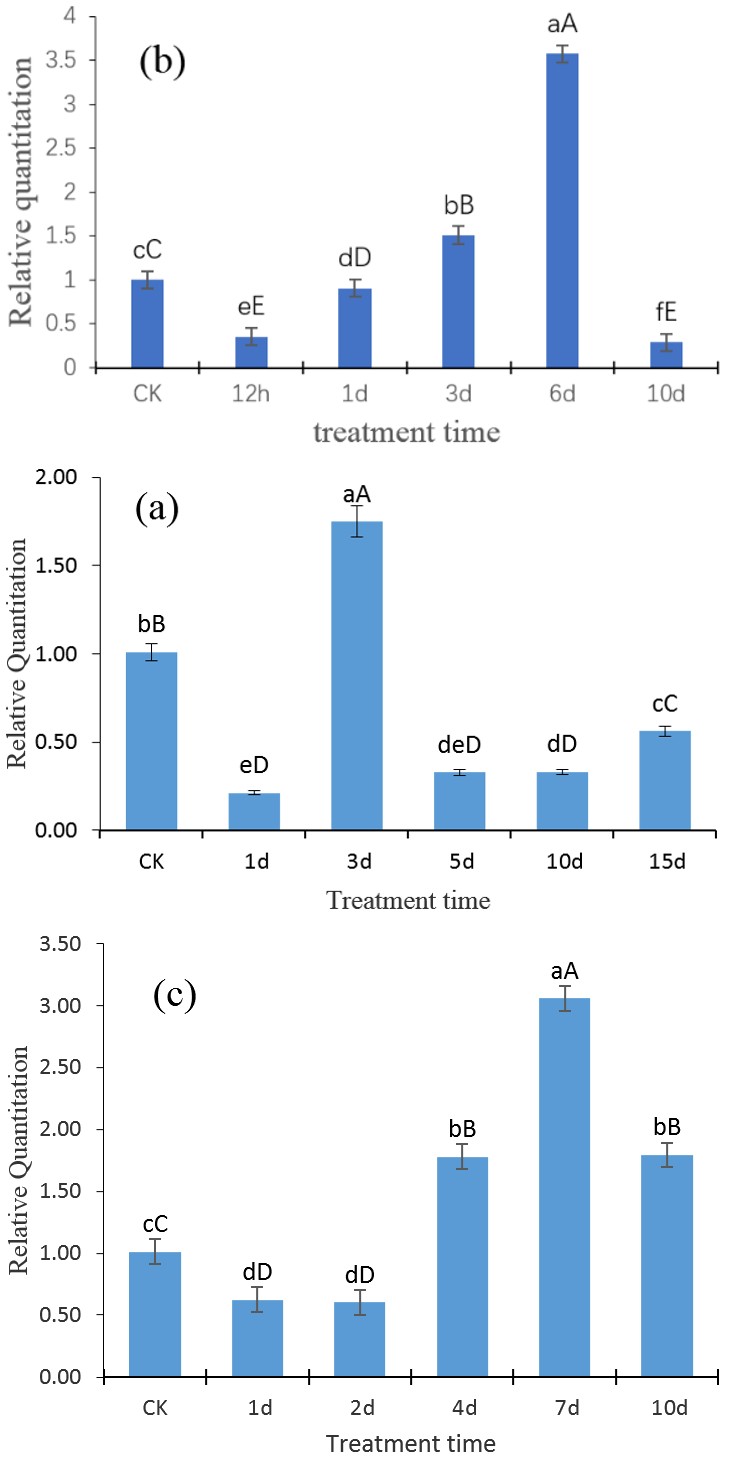
Figure 4: The mRNA expression levels of GTPase Era under abiotic stress treatment on various time points. The expression levels of GTPase was normalized to the level of β-actin. The horizontal axis represents the time of abiotic stresses, and the vertical axis represents the relative expression level of GTPase Era gene. The results are mean ± SD of the triplicates of three biological replicates. Letter superscripts above bar indicate the significant difference of the changes between different stress time with the level of p > 0.05 (shown as the same or no letter superscripts), 0.01 < p ≤ 0.05 (shown as different small letter superscripts) and p ≤ 0.01 (shown as different capital letter superscripts). (a) Expression profile of GTPase Era gene under drought stress. (b) Expression profile of GTPase Era gene under low temperature stress. (c) Expression profile of GTPase Era gene under salt stress.
Figure 4A illustrate the effect of drought stress on mRNA expression of GTPase Era. The GTPase Era gene expression level declined sharply to its minimum level of about 0.21 times of that of the control on the first day of drought stress treatment. The expression level then increased to its maximum level of about 1.75 times the level of the control on the third day and then declined sharply again to about 0.33 times of the control on fifth day. There was then a gradual increase from the day 5 to the day 15.
Figure 4 B illustrate the effect of low temperature stress on mRNA expression of GTPase Era. The GTPase Era gene expression level reduced to about 0.36 times of the level of the control on the first twelve hours. The level of expression increased constantly for the twelfth hour to the third day and then increased sharply to its maximum level of about 3.57 times the level of the control on the sixth day. There was then a sharp decline in the expression level to its lowest on the tenth day.
Figure 4 C illustrate the effect of salt stress on mRNA expression of GTPase Era. The GTPase Era gene expression level decreased to the about 0.62 times of the level of the control on the first day and maintained almost the same level on the second day. There was an increase of the level of expression on the fourth day and then a sharp increment to the maximum expression level of about 3.06 times on seventh day to that of the control. The expression level then declined to 1.79 times on the tenth day.
Discussion
In this study, we describe the identification and cloning of GTPase Era, and discussed its involvement in drought stress, cold and salt stress. The sequence obtained exhibited features of GTPase Era. Homology analysis revealed that GTPase Era sequences are highly conserved with some identical conserved regions and a similar tertiary structure, but with several differences that may have occurred during evolution due to different growth patterns and environmental factors, resulting in different species while retaining its own specificity [19].
GTPases are found in all domains of life and act as molecular switches that are “activated” by GTP and “inactivated” by the hydrolysis of GTP to GDP to regulate numerous cellular processes, such as signal transduction, reorganization of the cellular cytoskeleton, regulation of transcription and translation, protein transport and vesicle trafficking [24]. ERA is essential for cell growth and viability [25], cell division [26], and pleiotropic processes, including carbon metabolism, fatty acid metabolism, and adaptation to thermal stress [27]. ERG plays a vital role in early seed development in Antirrhinum majus and is essential for early embryo development in Arabidopsis [17]. However, the mechanism that regulates abiotic stress remains unclear. Wang, et al. [28] isolated a gene encoding a small GTPase, designated MfARL1, from Medicago falcata. The function of MfARL1 in response to salt stress was studied by expressing MfARL1 in Arabidopsis. They found that MfARL1 encodes a novel stress-responsive small GTPase that is involved in tolerance to salt stress. Fan [29] cloned a ERG homologous gene from Passiflora edulis. Using real-time RT-PCR, its dynamic expression pattern under low temperature stress was analyzed. Here, we found that when mulberry plants were in adverse environments such as salt, cold and drought, the expression level of GTPase era will adjust to response to environmental stresses. The results of RT-qPCR analysis showed that the transcriptional level of GTPase era mRNA significantly changed under the conditions of drought, cold and salt stresses compared to the normal growth environment, indicating that GTPase Era gene encodes a novel stress-responsive small GTPase that is involved in tolerance to abiotic stress in mulberry. In conclusion, useful information was obtained from GTPase era gene and it was observed that GTPase era played an important role in responding to abiotic stresses in mulberry. These make a foundation to the breeding of new mulberry varieties with excellent quality and high-level resistant by the use of genetic engineering techniques.
Acknowledgements
This work was supported by Sericulture Industry Technology in China Agriculture Research System (CARS- 18-ZJ0207), Guangxi innovation driven development project (AA19182012-2), Open Program of Key Laboratory of Silkworm and Mulberry Genetic Improvement, Ministry of Agriculture (KL201906), the Crop Germplasm Resources Protection Project of the Agriculture Ministry (111721301354052026), and National Infrastructure for Crop Germplasm Resources (NICGR-43).
References
-
Bourne HR, Sanders DA, McCormick F (1990) The GT- Pase superfamily: a conserved switch for diverse cell functions. Nature 348(6297): 125-132.
-
Bourne HR (1995) GTPases: a family of molecular switches and clocks. Philos Trans R Soc Lond B Biol Sci 349(1329): 283-289.
-
Reynaud EG, Andrade MA, Bonneau F, Ly TB, Knop M, et al. (2005) Human Lsg1 defines a family of essential GT- Pases that correlates with the evolution of compartmen- talization. BMC biol 3: 21.
-
Britton RA (2009) Role of GTPases in bacterial ribosome assembly. Annu Rev Microbiol 63: 155-176.
-
Manikas RG, Thomson E, Thoms M, Hurt E (2016) The K+-dependent GTPase Nug1 is implicated in the asso- ciation of the helicase Dbp10 to the immature peptidyl transferase centre during ribosome maturation. Nucleic Acids Res 44(4): 1800-1812.
-
Valster AH, Hepler PK, Chernoff J (2000) Plant GTPases: the Rhos in bloom. Trends in cell biol 10(4): 141-146.
-
Kenmotsu Y, Asano K, Yamamura Y, Kurosaki F (2013) Cloning and expression of putative Rac/Rop _GTPase_ genes, Am-rac1 and Am-rac2, involved in methyl jas- monate-induced transcriptional activation of farnesyl diphosphate synthase in cell cultures of _Aquilaria micro-_ _carpa_. Plant Mol Biol Rep 31: 539-546.
-
Chen X, Court DL, Ji X (1999) Crystal structure of ERA: A GTPase-dependent cell cycle regulator containing an RNA binding motif. Proc Natl Acad Sci USA 96(15): 8396- 8401.
-
Ingram GC, Simon R, Carpenter R, Coen ES (1998) The Antirrhinum ERG gene encodes a protein related to bac- terial small GTPases and is required for embryonic via- bility. Current biol 8(19): 1079-1082.
-
Meier TI, Peery RB, McAllister KA, Zhao G (2000) Era GT- Pase of _Escherichia coli_: binding to 16S rRNA and mod- ulation of GTPase activity by RNA and carbohydrates. Microbiology 146(Pt 5): 1071-1083.
-
Lerner CG, Gulati PS, Inouye M (1995) Cold-sensitive conditional mutations in Era, an essential Escherichia coli GTPase, isolated by localized random polymerase chain reaction mutagenesis. FEMS microbiol Letters 126(3): 291-298.
-
Nashimoto H, Miura A, Saito H, Uchida H (1985) Sup- pressors of temperature-sensitive mutations in a ribo- somal protein gene, rpsL (S12), of Escherichia coli K12. Mol Gen Genet 199(3): 381-387.
-
Britton RA, Powell BS, Dasgupta S, Sun Q, Margolin W, et al. (1998) Cell cycle arrest in Era GTPase mutants: a po- tential growth rate-regulated checkpoint in Escherichia coli. Mol Microbiol 27(4): 739-750.
-
Ralston A (2008) Operons and prokaryotic gene regula- tion. Nature Education 1(1): 216.
-
Ingram GC, Simon R, Carpenter R, Coen ES (1998) The Antirrhinum ERG gene encodes a protein related to bac- terial small GTPases and is required for embryonic via- bility. Curr Biol 8(19): 1079-1082.
-
Suwastika IN, Denawa M, Yomogihara S, Im CH, Bang WY, et al. (2014) Evidence for lateral gene transfer (LGT) in the evolution of eubacteria-derived small GTPases in plant organelles. Front Plant Sci 5: 678.
-
Cheng P, Li H, Yuan L, Li H, Xi L, et al. (2018) The ERA-Re- lated GTPase _AtERG2_ Associated with Mitochondria 18S RNA Is Essential for Early Embryo Development in _Ara-_ _bidopsis_. Front Plant Sci 9: 182.
-
Jeon Y, Ahn CS, Jung HJ, Kang H, Park GT, et al. (2014) DER containing two consecutive GTP-binding domains plays an essential role in chloroplast ribosomal RNA Exp. DER containing two consecutive GTP-binding domains plays an essential role in chloroplast ribosomal RNA Exp Bot 65(1): 117-130.
-
Li R, Liu L, Dominic K, Wang T, Fan T, et al. (2018) Mul- berry (Morus alba) MmSK gene enhances tolerance to drought stress in transgenic mulberry. Plant Physiol Bio- chem 132: 603-611.
-
Waterhouse A, Bertoni M, Bienert S, Studer G, Tauriel- lo G, et al. (2018) SWISS-MODEL: homology modelling of protein structures and complexes. Nucleic Acids Res 46(W1): W296-W303.
-
Tamura K, Dudley J, Nei M, Kumar S (2017) MEGA4: mo- lecular evolutionary genetics analysis (MEGA) software version 4.0, Mol Biol Evol 24(8): 1596-1599.
-
Thompson JD, Gibson TJ, Plewniak F, Jeanmougin F, Hig- gins DG (1997) The CLUSTAL_X windows interface: flex- ible strategies for multiple sequence alignment aided by quality analysis tools. Nucleic Acids Res 25(24): 4876- 4882.
-
Schmittgen TD, Livak KJ (2008) Analyzing real-time PCR data by the comparative CT method. Nature protocols 3(6): 1101-1108.
-
Shan SO (2016) ATPase and GTPase tangos drive intra- cellular protein transport. Trends Biochem. Sci 41(12): 1050-1060.
-
Inada T, Kawakami K, Chen SM, Takiff HE, Court DL, et al. (1998) Temperature-sensitive lethal mutant of era, a G protein in _Escherichia coli_. J Bacteriol 171(9): 5017- 5024.
-
Britton RA, Powell BS, Court DL, Lupski JR (1997) Char- acterization of mutations affecting the Escherichia coli essential GTPase era that suppress two temperature-sen- sitive dnaG alleles. J Bacteriol 179(14): 4575-4582.
-
Voshol GP, Meyer V, Van den Hondel CA (2015) GTP-bind- ing protein Era: a novel gene target for biofuel produc- tion. BMC Biotechnol 15: 21.
-
Wang TZ, Xi XZ, Zhao MG, Tian QY, Zhang WH (2013) Expression of a _Medicago falcata_ small GTPase gene, MfARL1 enhanced tolerance to salt stress in _Arabidopsis_ _thaliana_. Plant Physiol Biochem 63: 227-235.
-
Fan H, Ran N, Li A, Zhang H, Xu M (2019) Cloning and expression analysis of EGR gene from Passiflora edulis, Guihaia.
- Enhancement of Vegetative Growth and Fruit Yield in Cucumber (Cucumis sativus L.) via Spiritual Blessing (Biofield) Energy Intervention
- Production of Açaí (Euterpe oleracea Mart.) under Different Agroforestry System Management Intensities in Amazonian Floodplain (Varzea) Forests
- Coffee and the Production Region: What is the Secret to the Expression "Quality"?
- Experiential Agripreneurship Training in Sub-Saharan Africa: Integrating a Business Incubator into Postgraduate Livestock Education at the University of Buea
- Advances in Agricultural High-Quality Development
- Linking Compost Residue to ABAGE in Plants - a Short Note