The Backyard of Tlaxcala: An Approach II
In the State of Tlaxcala, Mexico, approximately 30% of rural production units have an area adjacent to the home, the backyard; in this agroecosystem some of the functions reported in research on the subject are reproduced. Despite its cultural importance and its contribution to the economy of rural families, few studies have been done to describe its characteristics; the basic information questionnaire applied by INEGI to ejidatarios, commoners, small landowners responsible for land or houses with agricultural or forestry activities, from the register of agricultural producers in the state of Tlaxcala, in 2004, was used, with a total of 53,968 Production Units (PU) surveyed, of which 17,131 said they had land for agricultural and forestry activities on the land next to the house. Microsoft Office Excel 16 was used to obtain the frequencies. Class ranks were calculated to show the results; 78.15% of the land is privately owned; 97.88% of the rural housing are privately owned; 45% of the backyards that use irrigation for crop production have an area equal to or less than 1,000 m2; 86.00% of the units that use irrigation use white water. 53.51% of these units use covered canals; finally, 66.73% of the PUs that responded report the tepetate between one and 50 cm deep, a situation adverse to the crop production potential of Tlaxcala's backyards.
Introduction
In the state of Tlaxcala, a total of 225, 214 hectares were sown in 2018, both irrigated and rainfed SIACON, 2020 [1]. The Instituto Nacional de Estadísticas, Geografía e Informática, INEGI (2004) reported 53,968 agricultural production units according to the Padrón de Productores Agropecuarios del estado de Tlaxcala, of which 17,131 said they owned land for agricultural and forestry activities on the land attached to the dwelling; this represents approximately 30% of those rural production units that report having an area adjacent to the dwelling, according to the definition “backyards represent intimate combinations of various trees and crops, sometimes in association with domestic animals, Investigation Paper around the dwelling” from Wiersum, 1982; Brownrigg, 1985; Fernandes and Nair, 1986; Soemarwoto, 1987, cited by Nair PKR, et al. [2]. The importance of this number of backyards in the Tlaxcala territory is better reflected if we consider that Tlaxcala is, by far, the entity that sows proportionally more surface area with respect to the total surface area of the entity, according to Figure 1.
In addition, if we construct a biodiversity index, with the ratio number of crops or agricultural species sown in 2018 by the 32 federative entities with respect to their total area, we obtain that Tlaxcala would be the entity with the second highest agrobiodiversity, as shown in Figure 2, only after Mexico City.
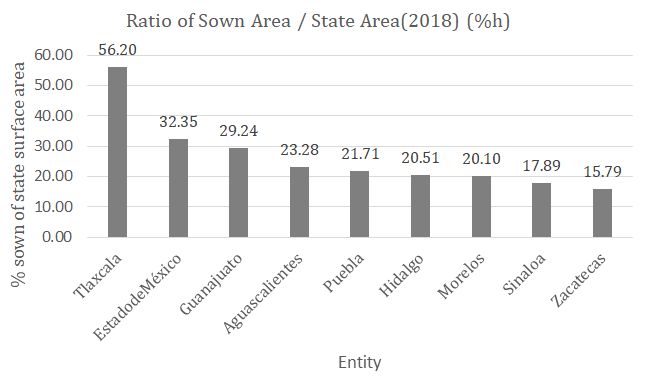
![Figure 2: Ratio of the number of crops sown in 2018 to the state area (hectares). Source: SIACON (2020) [1] and https://mr.travelbymexico.com/966-estados-de-mexico-segun-su-superficie/ What can be observed in both Figures 1 & 2 shows that in Tlaxcala the pressure on land for food production is more intense than in the rest of the states; in addition, there is a report from Secretaría de Medio Ambiente y Recursos Naturales, according to information from Ojeda and Ojeda (1996) that indicates that the state has the least fertile soils in the country, and there is no known initiative, private or public, to improve soil fertility, so it is to be expected today that there will be greater depletion of this edaphic property.](/fulltextimages/7116/fig_2.png)
Figure 2: Ratio of the number of crops sown in 2018 to the state area (hectares). Source: SIACON (2020) [1] and https://mr.travelbymexico.com/966-estados-de-mexico-segun-su-superficie/ What can be observed in both Figures 1 & 2 shows that in Tlaxcala the pressure on land for food production is more intense than in the rest of the states; in addition, there is a report from Secretaría de Medio Ambiente y Recursos Naturales, according to information from Ojeda and Ojeda (1996) that indicates that the state has the least fertile soils in the country, and there is no known initiative, private or public, to improve soil fertility, so it is to be expected today that there will be greater depletion of this edaphic property.
Another factor that contributes to the aforementioned problem is the recurrent selection of Tlaxcala for the operation of pilot technological projects, with the productivist philosophy of the Green Revolution, such as the Agricultural Extension Project (PROCATI) by the World Bank in 1987 [3], in which the pilot district for rainfed agriculture was chosen, The Huamantla Rural Development District in Tlaxcala was chosen as a pilot district for rainfed agriculture, while the Cajeme District in Sinaloa was chosen for irrigation (The World Bank, 1987) [3], and recently the Sustainable Modernization of Traditional Agriculture (MasAgro) project of Centro Internacional de Majoramiento de Maíz y Trigo, CIMMYT, considered as a new version of the Green Revolution, according to López SP, et al. [4].
The above is of the highest importance because it means that peasants have been subject to constant productivist training that has led them to replace their traditional agricultural practices, such as the use of animal traction and manual weeding, with pesticide technology and mechanical traction, especially by those who monopolize, through the payment of rent, the best farmland Lazos CE, et al. [5]; Diario Marca Tlaxcala [6]: Renting, 80% of the Tlaxcalan countryside, María RA, et al. [7]. This results in the loss of traditional ancestral knowledge for a productivist one that has not solved the problem of hunger in poor rural economies, but also, as a consequence, implies that these farmers apply modern technological components in spaces such as the backyard, an aspect that is studied in another research.
Land rights (and dwelling) are often a vital element as rural households seek to balance their capabilities and assets and determine the resulting strategies for coping with their daily food production and security needs. However, such rights are not only a source of economic production but also the basis of social relations and cultural values, as well as a factor of prestige and often power [8].
Materials and Methods
According to the INEGI Census (2007), Tlaxcala has 71,371 agricultural and livestock or forestry production units. Therefore, the 53,968 basic information questionnaires applied by INEGI to ejidatarios, commoners, small landowners responsible for land or homes with agricultural and livestock or forestry activities, from the list of agricultural producers in the state of Tlaxcala, represent 75.67% of the total number of production units.
For this work, the information analyzed corresponds to the section Land of the Responsible Person’s Household, which according to several authors cited by Nair PKR, et al. [2]. For the analysis of the variables in the 53,968 total PU of the Cédula, we proceeded as follows: we took into account the surface of the options one to five of the crops and considered those that reported some surface, discarding those that did not report, in this way the total number of Cédulas analyzed was 17,131. Then, for each variable we quantified its frequency to show the results according to the class values as shown in Table 1; Microsoft Office Excel 16 was used to obtain the frequencies. Class ranges were calculated following the recommendation of Gorgas GJ, et al. [9], “when the number of distinct values taken by the statistical variable is too large or the variable is continuous. A grouping of the data into intervals is performed and a count is made of the number of observations that fall within each of them”. Only a few frequency tables are presented, although all variables were analyzed in this way with the analysis of the respective variables, the form of land tenure next to the dwelling where one to five crops are grown was identified; the form of tenure of the land where the dwelling is located was determined (ejido, community and private, respectively); the form of tenure of the dwelling when growing crops, in terms of whether the dwelling is owned, rented, borrowed or other form.
The questionnaire asks: Is any part of the land of the dwelling used for agriculture? Initially, it was thought that this was answered by determining the area of the option Crop one of the 17,131 that responded affirmatively. When analyzing the variables P0260001, which answers (yes/no) and P0260002, which indicates the area they report, it was found that only 5,563 units responded that they had some area, which was between 0.0001 to 60 hectares, so this and the following variables were analyzed, as well as those that responded without making this comparison.
The variables that answer the question “Is part of this area irrigated?. As well as those to determine the use of black water, treated water and white water (well water, springs, dams, etc.) and the irrigation system used. We also analyzed the variables that answer the questions: did you have any part of the agricultural area in fallow? do you have a forest area? do you have an area with pasture, uncultivated pasture or wooded area?
An analysis was also made of the variables that respond to the following questions: Does the land where this house is located have a sandy or rocky, sandy or eroded surface? Finally, it was determined if the land where this house is located, is it sloped or flat? Finally, what is the depth of the tepetate? These edaphic variables are related to the quality of the soil in the backyards.
Results
Household land tenure form when sowing crops. The results are shown in Table 1.
| Ejido | Communal | Private | Total PU | |
|---|---|---|---|---|
| 1 CROP | 3324 | 415 | 13391 | 17130 |
Table 1: Tenure of the land where the dwelling is located by tenure type (PU).
It is observed that the land where the house is located is predominantly privately owned (78.17%).
Form of ownership of the dwelling when sowing crops, in terms of whether the dwelling is owned, rented, borrowed or other form. The results are shown in Table 2.
| Own | Rented | Borrowed | Other | Total | |
|---|---|---|---|---|---|
| Ejido | 3251 | 18 | 50 | 5 | 3324 |
| Communal | 405 | 3 | 5 | 2 | 415 |
| Private | 13111 | 42 | 206 | 32 | 13391 |
| 16767 | 63 | 261 | 39 | 17130 |
Table 2: Form of possession of the dwelling in the backyard.
It is observed that 97.88% of the backyards have their own home. Tables 1 and 2 show that both the land on which the dwelling is located and the form of tenure of the dwelling are predominantly private property, which gives legal security to the owners of these agroecosystems.
Part of the Land of the Dwelling used for Agriculture
It was found that, instead of the 17, 131 that reported having area for Crop 1, only 5,597 PUs mentioned some area, ranging from 0.0001 to 60 hectares. In relation to variables P001010101 and P0010102 that indicate PUs with Crop 1 with reported area, 11,639 were identified that should have reported some area, but indicated (P0260101) that they did not have any. No way was found to explain the difference.
Backyard Irrigated Area
The irrigated area was 113.08 hectares out of 117 PU, with a range of 0.0001 to 27 hectares; this when the reference was Crop 1, under the assumption that it is the most reported (17,131 PU). It is observed that 45% of the backyards that use irrigation for crop production have an area equal to or less than 1,000 m2; that is, this resource is mainly used by those PUs that have more than 1,000 m2 and up to 27 hectares.
Irrigation Water Quality
Sewage wáter
It is observed that 41 backyards use sewage in areas ranging from 350 m2 to 5.09 hectares; 43.90% have an area of up to 1,000 m2; also, 90.24% have an area of up to 1.0 hectare. The class values per 100 m2 were not used, since their values were very low, thus, if the average surface of the backyard is 215 m2 María RA, et al. [10] only 5 (12.20%) PU would be in those values.
Treated Water
Although there are few PUs with irrigation, only nine use treated water; however, 44.44% have an area between 1 and 83 hectares.
White water
It is observed that out of 301 PUs using white water, 36.54% of them have an area of up to one thousand square meters. From 0.0001 to 0.0215 hectares, there were 36 PU, that is, 11.96% that have up to 215m2 which is the average backyard area. The distribution of the first 110 observations is shown in Table 3.
| No. | L. Limit | U. Limit | Observations | % RPU | % Cumulative |
|---|---|---|---|---|---|
| 1 | 0.0001 | 0.01 | 21 | 6.98 | 6.98 |
| 2 | 0.0101 | 0.02 | 13 | 4.32 | 11.3 |
| 3 | 0.0201 | 0.03 | 16 | 5.32 | 16.61 |
| 4 | 0.0301 | 0.04 | 12 | 3.99 | 20.6 |
| 5 | 0.0401 | 0.05 | 7 | 2.33 | 22.92 |
| 6 | 0.0501 | 0.06 | 10 | 3.32 | 26.25 |
| 7 | 0.0601 | 0.07 | 12 | 3.99 | 30.23 |
| 8 | 0.0701 | 0.08 | 7 | 2.33 | 32.56 |
| 9 | 0.0801 | 0.09 | 6 | 1.99 | 34.55 |
| 10 | 0.0901 | 0.1 | 6 | 1.99 | 36.54 |
| 11 | 0.1001 | 50.1455 | 191 | 63.46 | 100 |
| Total RPU | 301 | 100 |
Table 3: Production Units up to 1,000 m2 that use white water for irrigation (%).
It is confirmed that the white water used for irrigation in backyards is for those with the largest surface area. That is, very few backyards use irrigation (117 according to variable P0260102, irrigated surface), 351 if we count those that use black, treated and white water) and mostly in backyards larger than 215 m2. Although not many UPs use irrigation, 85.75% of those that irrigate use white water, i.e., potable; one strategy would be to use a technology that transforms gray water into treated water, as mentioned by Rivera M, et al. [11].
The Irrigation System used
It is observed that the most frequent was the covered canals, with 53.51% of the cases, followed by earth channels with 24.32% of the cases, while micro-sprinkler and drip irrigation system were the least used, with 3 and 10%, respectively. The difference between the 351 PUs using some type of water and the 370 PUs using irrigation methods may be due to the fact that some users use more than one irrigation system. However, it should be noted that over time, concrete- lined channels can crack, causing water leakage, and earthen channels are subject to erosion and leakage problems; it is therefore necessary to ensure the waterproofing of the system.
Agricultural area left fallow between February and August
It is observed that only 0.71% of the backyards let the agricultural land of their backyard rest; this indicates a dynamic use of the agroecosystem, mainly in the production of food of plant and animal origin.
Backyard Area Destined to Forest
Perhaps due to the small size of the backyards, only 0.48% of them dedicate part of their backyards to forest; most of them are those with more than 1,000 m2 of land.
Area under pasture, uncultivated pasture or woodland
It is observed that only 0.43% of the backyards have pastures, uncultivated pastures or wooded areas, which can be explained by the small average size (215m2), ratifying, in addition, their bioproductive dynamism.
Backyards with sandy or stony areas
Only 0.97% of the backyards report the presence of sandy or rocky areas; this may be due to the fact that they are small spaces that can be "broken up” manually and maintained with vegetation that does not allow sand to be a problem; however, sandy soils are frequent in the state. Soil texture is important because in sandy soils the pores are larger, which allows a high water filtration and therefore a greater loss of nitrates (Castellanos, 2000, quoted by Fertilab, et al. [12]; that is, they retain little moisture and tend to dry out, have low fertility and need contributions of organic and inorganic elements Andrades M, et al. [13].
Backyard with land with ensalitrada surface
If we consider that 351 PU backyard farms use water for irrigation, only 7.41% report soil siltation problems; with respect to the total number of backyard farms (17,130), soils with siltation problems represent 0.15%.
Eroded backyard surface
Only 0.39% of the backyards mentioned having eroded soil; this percentage is very low, considering that Tlaxcala is one of the states with the most eroded soils (SEMARNAT-CP, 2003). This situation may be due to the fact that in areas as small as the backyard, it is difficult to detect erosion.
Sloping land in the backyard
It was observed that 21.20% of the backyard plots are reported as sloping and this is a characteristic associated with soil erosion, so it is expected that there are more backyard plots with soil erosion. This idea is reinforced if we consider that 30.23% of the plots are reported as flat; that is, 48.51% did not report these physical characteristics of the plots. In addition, soil erosion can cause appreciable differences in soil quality and productivity down the slope; soil on the lower slopes is generally more fertile than on the upper slope, and corresponding yield differences were quite large, Poudel DD, et al. [14].
Depth of land at which tepetate is found
Finally, Table 4 shows the soil depth at which the presence of tepetate is reported.
| No. | L. Limit | U. Limit | Observations | % RPU | % Cumulative |
|---|---|---|---|---|---|
| 1 | 0.01 | 0.5 | 3233 | 66.73 | 66.73 |
| 2 | 0.501 | 1 | 1400 | 28.9 | 95.62 |
| 3 | 1.001 | 1.8 | 212 | 4.38 | 100 |
| 4845 | 100 |
Of the backyards that reported this soil characteristic, 66.73% have tepetate at a depth of less than 50 cm, which limits the productive potential of the land. According to Baez PA, et al. [15], A tepetate is “a layer of tuff, pyroclastic flow or deposits of ancient hardened volcanic ashes, at various depths of the profile, particularly in climates with two very marked seasons, one dry and the other rainy”, i.e., very common in the soils of Tlaxcala, where these backyards have a reduced productive potential. In addition, María and Volke HV, et al. [16] report that slope and soil depth are related to the productive potential of corn in Tlaxcala. Finally, it is important to pay attention to what SEDENA (2014) indicates [17, 18, 19, 20], that soil degradation can lead to an irreversible situation, which is desertification, which is the reduction or destruction of the biological potential of the land that can lead to the creation of conditions analogous to those of a natural desert.
Conclusion
Thirty percent of the UPs in Tlaxcala have backyards; of these the land tenure and the form of possession of the house is private, which gives security in these agroecosystems to be able to produce food usually for self-consumption. A small percentage of these agroecosystems use water for irrigation, mostly with white water. Because of the small average size, there is usually no space to leave in the land to rest, with forests or with uncultivated pastures with covered Canals, using very little micro-irrigation [21]. Few problems of sandy or stony soils, silt or soil erosion are reported, although a significant percentage report the presence of tepetate at less than 50cm, which is a limiting condition for the production of plant species.
Conflicts of Interest
I have no conflicts of interest
Acknowledgements
I am indebted to INEGI-Tlaxcala (2004) for allowing me access to the statistical data.
References
-
(2020) Consultation Agrifood Information System (SIACON). Gobierno De Mexico.
-
Nair PKR, Kumar BM (2006) The concept of homegarden. _In_: Kumar BM, et al. (Eds.), Tropical Homegardens. A Time-Tested Example of Sustainable Agroforestry, Springer, The Netherlands, pp: 383.
-
The World Bank (1987) Agricultural Extension Project (PROCATI) Mexico. Pilot Rural Development Districts Irrigated, Arid Northwest Region, Temperate Central Highlands Region. Staff Appraisal Report. Projects Deparment. Latin AMerica and the Caribbean Regional Office. México- United States of America, pp: 63.
-
López SP (2018) MasAgro, Modernizing traditional agriculture in neoliberal times. 1st (Edn.), Brot für die Welt, CS Fund & Warsh Mott Legacy and Misereor, UNAM. Mexico, pp: 28.
-
Lazos CE (2014) Socioeconomic and cultural considerations in the controversial introduction of transgenic corn, the case of Tlaxcala. Sociological 29(83): 201-240.
-
(2011) Rentado, 80% del campo tlaxcalteca. Diario Marca Tlaxcala.
-
María RA, Guevara RL (2014) ALASRU, IX Congress of Latin American rural societies, diversities, contrasts and alternatives. The renting of the land and some other socioeconomic and environmental aspects that put the biodiversity of the native or creole maize of Tlaxcala at risk. Mexico.
-
(2003) Food and Agriculture Organization of the United Nations Fao. Land tenure and rural development. Land tenure studies 3. Rome, Italy.
-
Gorgas GJ, Cardiel LN, Zamorano CJ (2011) Basic Statistics for science students. 1st (Edn.), Complutense University of Madrid. Madrid Spain, pp: 258.
-
María RA (2021) The Backyard of Tlaxcala. An Approach. Journal Terra Latinoamericana. Under editorial revision, México, pp: 17.
-
Rivera M (2019) They create gray water filter for backyard irrigation; cleans 97% of the liquid. Difusión North.
-
Fertilab (2019) The texture and fertility of the soil. Technical notes. Fertility de Suelos S. de R.L, Fertilab, Mexico, pp: 4.
-
Andrades M, Martínez ME (2014) Soil fertility and parameters that define it. Didactic material Agriculture and Food. 3rd (Edn.), Iberus. Publications Service, University of La Rioja, Logroño, Spain.
-
Poudel DD, Midmore DJ, West LT (1999) Erosion and productivity of vegetable systems on sloping volcanic ash derived Philippine soils. Soil Sci Soc Am J 63(5): 1366-1376.
-
Baez PA, Etchevers BJD, Márquez RA, Ascencio ZE (2007) Agronomic management of hardened soils (tepetates) of the Neovolcanic Axis of Mexico. _In_: Gallardo Lancho JF (Eds.), Carbon sequestration in Ibero-American terrestrial ecosystems: Red Pocaiba, Salamanque, Spain, pp: 69-84.
-
María RA, Volke HV (1999) Stratification of the productive potential of corn in the eastern region of the state of Tlaxcala, Terra Latinoamericana 17(2): 131-138.
-
Comprehensive solutions for environmental quality. LinersInstallers.
-
(2004) National Institute of Statistics, Geography and Informatics (INEGI). National Meeting of geography Tlaxcala Producers Register. National Institute of Statistics and Geography, Mexico.
-
(2014) Secretariat of National Defense, Unified technical document (DTU) of the process of change of use of forest land, modality a, of the project called: Training Center of the VI Military Region in the property called “Tierra y Libertad, municipality of Tlaxco, Tlax. Santa Ana Chiautempan, Tlaxcala, Mexico, pp: 215.
-
(2003) Ministry of the Environment and Natural Resources, Soils. The soils of Mexico In Semarnat. Report on the situation of the environment in Mexico, Compendium of environmental statistics. Mexico, pp: 275.
-
(2003) Ministry of Environment and Natural Resources- College of Postgraduates, Evaluation of soil degradation caused by man in the Mexican Republic scale 1: 250,000. National Memory 2001-2002. 5th (Edn.), Colegio de Postgraduados, Publicaciones Diamante, Estado de México, México, pp: 76.
- Enhancement of Vegetative Growth and Fruit Yield in Cucumber (Cucumis sativus L.) via Spiritual Blessing (Biofield) Energy Intervention
- Production of Açaí (Euterpe oleracea Mart.) under Different Agroforestry System Management Intensities in Amazonian Floodplain (Varzea) Forests
- Coffee and the Production Region: What is the Secret to the Expression "Quality"?
- Experiential Agripreneurship Training in Sub-Saharan Africa: Integrating a Business Incubator into Postgraduate Livestock Education at the University of Buea
- Advances in Agricultural High-Quality Development
- Linking Compost Residue to ABAGE in Plants - a Short Note