Determinants of Members’ Output Marketing through their Multipurpose Primary Cooperatives in Hababo Guduru Wereda, Ethiopia
In developing counties Multipurpose primary cooperatives are an ideal means for self-reliance, higher productivity level and promotion of agricultural development. Hence, this study aims to identify the factors affecting members’ marketing decisions through their multipurpose primary cooperatives in Hababo Guduru woreda, Oromia Regional State, Ethiopia. Both primary and secondary data were used for this study. A two stage random sampling procedure was adopted to select four multipurpose cooperatives and a total of 193 sample respondents from the Woreda. Primary data pertaining to the years2017/18 and 2018/2019 was collected from the sampled respondents through semi structured questionnaire. The survey data was analyzed using descriptive statistics and double-hurdle model. About 52.3% and 47.7% of sample cooperative members were users and non-users of cooperatives as marketing agent. Results of the model analysis showed that in the first hurdle, educational status, access to credit, patronage refund, cooperatives price and position in cooperative management committees are played positive and significant role in members’ decision to participate in output marketing through cooperative. In the second hurdle; educational status, farm land size, yield obtained, patronage refund, and farming experience have positive and significant role in the volume of farm product sold through cooperative; while family size, and distance of cooperative from cooperative members residences were found to have negative and significant role. Educational status and patronage refund were found to affect both ‘decisions to participate and intensity of participation in farm product marketing through their primary multipurpose cooperative.
Introduction
Background of the Study
Cooperatives employ at least 100 million people worldwide. It has been estimated that the livelihoods of nearly half the world’s population are secured by cooperative enterprises. The world’s 300 largest cooperative enterprises have collective revenues of USD 1.6 trillion, which are comparable to the GDP of the world’s ninth largest economy [1]. Approximately 7% of the African population reportedly belongs to a cooperative, though some countries like Egypt, Senegal, Ghana, Kenya and Rwanda report a higher penetration rate of over 10%. In some countries, the number and membership of cooperatives have significantly increased since the early 1990s, following the revitalization of the previously underperforming cooperatives and the emergence of new ones.
In Ethiopia the modern cooperatives movement had
started at the beginning of 1960s by putting emphasis on the establishment of multipurpose agricultural cooperatives. Which provide a wide variety of services in Ethiopia, including input supply management, grain marketing; & the supply of consumer goods to members at prices that compete with local traders? Some cooperatives were also involved in grain milling, seed multiplication and distribution, veterinary medicine distribution, and technical skills development. Farmer cooperatives have also found a clear niche in the production of high value export Cereals and the packaging and distribution of fertilizer [2].
Accordingly, the cooperatives collect agricultural outputs from their members and then supply to the buyers. Of course, different marketing strategies are applied by these cooperatives in order to let members market access [3]. Among those strategies consignment marketing is the common one. It is a joint-marketing approach whereby members’ outputs are delivered to agricultural cooperatives and then they sell the produce individually or through their federations at regional and national wholesale markets. Additionally, these cooperatives undergo the supply of inputs to their members too [4].
Despite the different policy reforms and market competition held for some grain markets, poor marketing structures and other intermediaries down play the benefit that cooperative members could achieved. The main bottleneck that encountered the country is the ever increasing transaction costs related to commercialization of agricultural products (Eleni, 2001). Also, poor market information systems when coupled with poor infrastructure and weak private-sector capacity absolutely retarded the commercialization of the nation’s larger and small holder farmers (Eleni et al., 2003). The aforementioned problems pertaining to marketing of agricultural products are not specific to Ethiopia only rather they are critical bottlenecks to other developing nations too. That is, smallholders encounter sever challenges pertaining to marketing of their surplus agricultural products. This is reflected through the wider variations in purchase and selling prices of surplus outputs that let retarded benefits smallholders able to accumulate from their supply to the markets (Fafchamps and Hill, 2005)." Besides, Agricultural marketing is the key driving force for economic development and has a guiding and stimulating impact on production and distribution of agricultural produce. Moreover, Daniel [5] argues, only enhancing production and productivity did not ensure rapid growth and development in the agricultural sector. Thus, it requires more efforts to build efficient marketing system that serve as a spring board for the development of the other Sectors. Despite the existence of differences in agricultural cooperatives model, most typical agricultural cooperatives in Ethiopia undergo the activities of input/ output marketing. Hence, at this moment, they undergo marketing activities for more than 10 percent of farmers produce and supply farm inputs for all farm households irrespective of membership [6].
Therefore, as it revealed by different sources, Multi- purpose primary Cooperatives function cannot be completely comprehended. Thus, scholars have proposed some relevant research on the operating efficiency of multipurpose primary cooperatives and hoped to improve the performance of cooperatives. Therefore, this study was undertaken to figure out location based analysis in identifying factors that affect members’ marketing decision through the primary agricultural cooperatives in the study area. Therefore, the main research question of the study is what are the main factors that affect cooperative members to market their farm product through their cooperatives in the study area?
Materials and Methods
Description of the Study Area
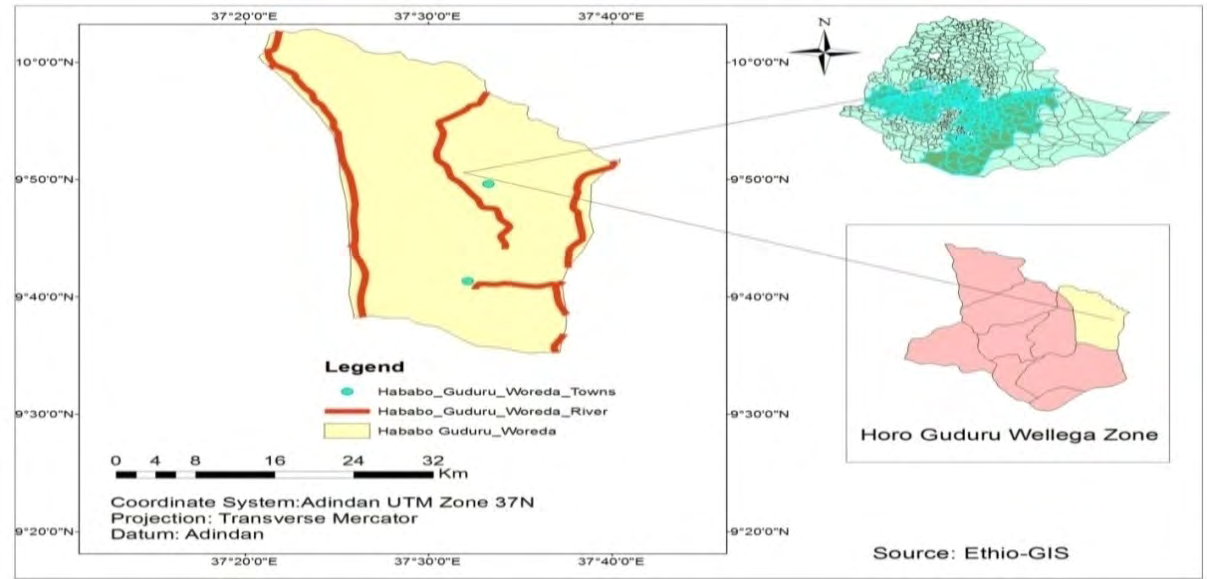
The study will conduct in Hababo Guduru Woreda of Oromia regione, Ethiopia. it is one of the woredas among twelve woreda of Horo Guduru Wollaga zones, which has 14 kebeles (two urban and 12 rural). The woreda is bordered on the south by the Guduru woreda, to the North by Baso Liban woreda of Ahamara region. On the West by Abay comman and on east by Ginde beret woreda of Western Showa Zone. The woreda is geographically situated within 80 22’-8056’N latitudes and 38058’-39022’E longitudes and lies at about 303 km away from the capital city of the country, Addis Ababa. According to a [7], the total population of the woreda was 45,325 and 5.22% of the population was urban dweller. It is the high agricultural producer woreda in the zone with the total area coverage of the district is 97,352.031 hectares of which 56,569 hectares are cultivated land (58.12 %) of the woreda area [8]. The woreda altitudes of approximately 2296m.a.s.l, the monthly mean temperature varies from 14.90C to 22.50C and, the study area receives about 1000- 2400mm of rain annually. The largest portion (65%) of the district has mid-highland agro-climate and the remaining portions (35%) have lowland agro-climate [8].
Data Type, Source and Methods of Data Collection
Both quantitative and qualitative data types were used. Primary data were collected from sample respondents through semi structured questionnaire from 193 Sample respondents. Secondary data were collected from different sources such as; journals, CSA publications, published and unpublished documents etc. Similar data concerning the woreda is also obtained from woreda agriculture and natural resources office and woreda Cooperative Organization and Promotion office Sampling Procedure and Sample Size Determination: The target populations for this study were primary cooperative members and MPPCs in study area. Two stage sampling techniques were used to generate the required primary data. The study area was selected purposively for several reasons. Among these several reasons the district is one of the potential
- districts where agricultural cooperatives were well organized and developed relative to other adjacent woreda. At the first stage, out of 11 multipurpose primary cooperatives in the study woreda, four multipurpose primary cooperatives were selected randomly. In the second stage, from the selected four MPPCs total of 193 cooperative members were selected randomly based on probability proportionate to size (PPS) of the MPPCs number of cooperative members as shown in
Table 1: Using [9] formula for sample size determination:
$$ n = \frac {N}{1 + N (e) ^ {2}} = \frac {3 . 4 7 1}{1 + 3 . 4 7 1 (0 . 0 7) ^ {2}} = 1 9 3 $$ Where, N = cooperative members, /total numbers of woreda sample MPPCs / (3,471), n = Sample size e = precision level 0.07 with Degree of confidence level at 93 %
| Name of sample MPCs | Total members of sample MPCs | Number of Sampled members of MPCs | Proportion of sampled MPCs (%) |
|---|---|---|---|
| Ref-toko tane Qawo | 471 | 28 | 14 |
| Imbabo Tesfa | 1,674 | 93 | 48 |
| Gudane Hawu | 573 | 31 | 16 |
| Nagaro chala | 753 | 41 | 22 |
| Total | 3,471 | 193 | 100 |
Table 2: Distribution of sample multipurpose primary cooperative members of the study area. Source: computed from data of HGWCPO
Methods of Data Analysis
Descriptive statistics and econometric models were used for analyzing the data collected from cooperative members marketing their farm products through cooperatives.
Descriptive statistics such as mean, standard deviations, frequency distributions, ratios, and percentage, graphical and tabular analysis were used to analyze the collected data .T-test and χ2- test were also employed. It was used to compare the socio-economic, the attitudes towards their cooperatives, service render by cooperatives and other institutional characteristics of the cooperative users and non users of the cooperatives as marketing agent for their farm products.
Econometric Model Specification: Different methods can be employed to analyze the primary agricultural cooperative member’s decision problem to market their farm products through primary cooperatives. One approach to analyze the issue is to use the well-known Tobit model. However, Tobit model assumes that both the cooperative member’s decision to market through cooperatives and the level of participation are determined by the same variables and with the same sign [11]. This is the main limitation of the Tobit model in which it restricts variables and coefficients in the two decisions (the cooperative member’s participation decision to market through cooperatives and the level of participation decisions) to the same sign [11]. That is why recent empirical studies have shown the inadequacy of the Tobit model.
In this regard, one alternative approach is to employ the Heckman two stage procedures. This model assumes thatthe member’s decision to marketing through primary cooperatives and the intensity of marketing participation may not necessarily be jointly determined [12]. In this case, factors that determine the member’s marketing participation decision and the decision on extent of participation could be different. In addition, the Heckman procedure assumes there is some potential marketing levels in the sample population, but are not observed due to sample selection problem. In general Heckman’s sample selection model is designed to account for the fact that the observed sample may be non- random. In our case, double hurdle model conceders the possibility of zero realization (out came) in the second hurdle arising from the individuals deliberate choices or random circumstances. In this case, the appropriate approach is to use the double-hurdle model.
In this study, thus, double-hurdle model had be chosen because it allows for the distinction between the determinants of members decision to participation and the level of participation In marketing their farm products through cooperatives are two separate stages. This model estimation procedure involves running a probit regression to identify factors affecting the cooperatives member’s decision to participate in marketing their products through cooperatives using all sample population in the first stage, and a truncated regression model on the participating cooperative member’s to analyze the extent of participation, in the second stage.
• Empirical Model Specification: Based on the above backgrounds, the linear probit model can be specified as the follows:
P (Yi=1) = β0 +βi Xi + е ……………………….. (4)
Where P is the probability of an individual cooperative member’s decision to participate in marketing their farm products through cooperative in the specified year (2018/2019), βi is the vector of parameters to be estimated, xi is the vector of exogenous explanatory variables expected to influence the participation decision and е is the error term.
Probit model specifies the functional relationship between the probability of member’s decision to participate in marketing of their farm products through primary cooperatives and the list of various explanatory variables thought to influence the participation decision. These factors can be either continuous or discrete explanatory variables. Therefore, the reduced functional relationship between the binary dependent variable (marketing through cooperative’s or not) and a list of explanatory variables for the empirical analysis of the current study can be specified as follows using basic probit model specification:
Pr ((MMPDTMPC):=1) = β0 + β1X1i + β2X2i + β3X3i + β4X4i + β5X5i + β6X6i + β7X7i + β8X8i+β9X9i + β10X10i + β11X11i +β12X12i +β13X13i +β14X14i + β15X15i + β16X16i + еi Where Pr - is the probability at which an individual cooperative member’s participate in marketing of their farm products through cooperativesin2018/2019 production year represented by ((MMPDTMPC) =1), βi’s– are the coefficients to be estimated, X1 – Education level (EDUCATION) X2– Family size (FAMILYSIZE) X3– Number of years of membership (MEMBERSHIP) X4– Off/non-farm income (ONFINC) X5– Position in the cooperative (POSITION) X6– Farmland size (FARMSIZE) X7– Yield of farm products (YIELD) X8– Tropical livestock units (TLU) X9– Cooperative price for farm products (COOPP) X10– Patronage refund (PATREF) X11--- Credit (CREDIT) X12--- Availability of other marketing agents (OMKAG) X13--- Availability of other services (AOS) X14--- Distance of the cooperative from the farmer house (DCFH) X15--- Distance of the district market (main market) from the farmer house (DDMKT) Ui–is the error term Using probit regression method we can compute estimates of the coefficients (β’s) and their corresponding standard errors that are asymptotically efficient. As noted in Wooldridge [11], the estimated coefficients from probit regression give the signs of the partial effects of each Xi on the response probability (dependent variable). Thus, to assess the impact of the regressors on the dependent variable, it is necessary to analyze their marginal effects. This involves decomposing the unconditional mean into the effect on the probability member’s decision to market their farm products through cooperatives and the effect on the conditional level of marketing participation and differentiating these components with respect to each explanatory variable. For the continuous explanatory variables, these marginal effects give partial effects of these variables at the sample means. While for the discrete or categorical variables, the marginal effects are used to calculate percentage changes in the dependent variable when the variable shifts from zero to one, ceteris paribus [13].
In the second stage of double-hurdle model the research examine factors affecting the level of member’s decision to participate in marketing their farm products through cooperatives, conditional on participation decision, which is implemented using the truncated regression analysis. Thus, it involves truncated regression that can be specified as: Q = Q* if Q* >0 and Y=1 Q= 0, otherwise From this, we can specify the reduced form of the truncation model as: Q = β0 +βi Zi + ui………………………. (3.6) Where Q is the observed quantity of farm product marketed through cooperatives, Q* is the latent variable which indicates the level of members farm produce marketed is greater than zero, βi is the vector of parameters to be estimated, Zi is the vector of exogenous explanatory variables and u is the error term. The empirical model used in this study assumes that the total quantity of members production marketed in the survey year (2017/2018) is a linear function of continuous and dummy explanatory variables and is specified as follows:
Q (QCMPMTMPC) =β0 + β1X1i + β2X2i + β3X3i + β2X2i + β4X4i + β5X5i + β6X6i + β7X7i + β8X8i+ β9X9i + β10X10i + β11X11i +β12X12i +β13X13i +β14X14i + β15X15i + β16X16i + Ui Where Q– is the quantity of members farm products marketed through cooperative in 2017/2018 year βi’s– are the coefficients to be estimated, X1 – Education level (EDUCATION) X2– Family size (FAMILYSIZE) X3– Number of years of membership (MEMBERSHIP) X4– Off/non-farm income (ONFINC) X5– Position in the cooperative (POSITION) X6– Farmland size (FARMSIZE) X7– Yield of farm products (YIELD) X8– Tropical livestock units (TLU) X9– Cooperative price for farm products (COOPP) X10– Patronage refund (PATREF) X11--- Credit (CREDIT) X12--- Availability of other marketing agents (OMKAG) X13--- Availability of other services (AOS) X14--- Distance of the cooperative from the farmer house (DCFH) X15--- Distance of the woreda market from the farmer house (DDMKT) Ui–is the error term Statistical and Specification Tests Before executing the final model regressions, all the hypothesized explanatory variables will be checked for the existence of statistical problems such as multicollinearity problems. Basically, multicollinearity may arise due to a linear relationship among explanatory variables and the problem is that, it might cause the estimated regression coefficients to have wrong signs, smaller-ratios for many of the variables in the regression and high R2value. Besides, it causes large variance and standard error with a wide confidence interval. Hence, it is quite difficult to estimate accurately the effect of each variable [11, 14]. There are different methods suggested to detect the existence of multicollinearity problem between the model explanatory variables. Among these methods, variance-inflating factor (VIF) technique is commonly used and is also employed in the present study to detect multicollinearity problem among continuous explanatory variables [14]. In Gujarati [14] it was defined that VIF shows how the variance of an estimator is inflated by the presence of multicollinearity [14]. Mathematically, VIF for individual explanatory variable (Xi) can be computed as (ibid): VIF (Xi) =1/ (1-R2) here R2is the coefficient of correlation among explanatory variables. The larger value of VIF indicates the more collinearity among one or more model explanatory variables. As a rule of thumb, if the VIF of a variable exceeds10, which will happen if a multiple R-square, exceeds 0.90, that variable is said be highly collinear [14]. Similarly, contingency coefficient (CC) method was used to detect the degree of association among discrete explanatory variables. The discrete/dummy variables are said to be collinear if the value of contingency coefficient (CC) is greater than 0.75 [15]. Mathematically:
Where CC- is contingency coefficient n- is sample size X2 -is chi-square value
| Dependent Variables | Definition | Measurement | Hypothesis |
|---|---|---|---|
| MMPDTMPC | Members Market participation decision trough Multipurpose primary Cooperative of (farm products) | 1 if the members sold (farm products)in 2010/11, or =0 otherwise. | +/- |
| QCMPMTMPC | The volume of sales of farm produces Marketed Trough Multipurpose Primary Cooperative | The amount of marketed surplus of (farm products) in year 2010/2011 | + |
| Independent Variables | Definition | Measurement | Hypothesis |
| EDUCATION | Education level | education level | Positive |
| FAMILYSIZE | Family Size | No. | Negative |
| MEMBERSHIP | Number of years of membership | years | Positive |
| OFFINC | Off-farm income | in birr | Positive |
| POSITION | Position in the cooperative | 1 if the farmer has a position , 0 If not | Positive |
| FARMSIZE | Farmland size | In hectares | Positive |
| YIELD | Yield of farm products | in tone | Positive |
| TLU | Tropical livestock unit | in number | Positive |
| COOPP | Cooperative price for farm products | 1 if the cooperative price for the farmer’s better ,0 If not | Positive |
| PATREF | Patronage refund | in birr | Positive |
| CREDIT | Credit | 1 if the farmer obtained credit from micro finance, 0 If not | Positive |
| OMKAG | Availability of other marketing agents | 1 if other marketing agents in the area at distance less than,0 if not | Negative |
| AOS | Availability of other services | 1 if the farmer gets other services from the cooperative, 0 if not | Positive |
| DCFH | Distance of the cooperative from the farmer house | in Km. | Negative |
| FAREXP | Number of years of experience the household members have in crop production farming at the time of interview. | In farming year. | Positive |
Table 3: Summery, definition, types, measurement and expected signs of explanatory variables
Results and Discussion
Descriptive Statistics for Respondents
Demographic and Socioeconomic Characteristic of the Cooperative Members: Out of the sample respondents interviewed, 52.33% of the farmers marketed their farm product through their cooperatives while 47.67% of the farmers didn’t market farm product through the cooperatives in the year 2017/18. Group comparisons of the market participants and non-participants through cooperative was computed using t-test for continuous variables and chi2- test for dummy variables, and the results are presented the consecutive (Table 2). • Age: Among 193 sample respondents 101(52.33%) of them were users of cooperatives as their market outlet whereas the rest 92(47.67%) respondents were non users. Age of the total sample households ranges from 29 to 73 years with mean of 47.32 years and standard deviation of 8.75. The average age of the cooperative member’s market participants through cooperative was 44.99 years with standard deviation of 7.66, while that of non-participants was 49.88years with standard deviation of 9.18 (Table 2). This implies that there was a statistically significant mean difference between age of market participants and non-participants through cooperative at 5% level of significance.
• Family Size: the average family size of the sample cooperative members was 4.71 persons and the standard deviation of 8.75, with maximum and minimum family size of 9 persons and 2 persons respectively. Which is nearly similar to the national family size average of
5.32 persons per household [7]. The average family size of the sample cooperative members that used the cooperative as marketing agent was 4.70 persons, with maximum and minimum family size of 9 and 2 persons respectively. The corresponding figure for the non-users was 4.71 persons, with maximum and minimum family size of 9 persons and 2 persons, respectively. The result shows that there is statistical significant difference of family size between cooperative users and non-users at 5% significant level.
farmers average formal schooling is 5.20 and 1.65years respectively. The difference mean t-test was compared between the cooperative members’ participant and non-participant marketing their farm product through their cooperative with respect to educational level of the cooperative members is found to be statistically significant at 1% probability level. This implies that relatively educated cooperative members participate in the farm product marketing activities through cooperatives. This can be due to that cooperative members with higher formal education are in a better position to know the benefits of cooperative and are more likely to market their farm products through the cooperatives.
- •
- Educational Level: The average educational level of the sample household members was 3.51 years of formal schooling with the standard deviation of 3.26. While the respective participant and non-participant sample
- *, and * implies statistically significance at 1%, 5%, and 10% level respectively.
- Source: Own computation from survey result, 2019
- •
- Gender: Among the sample cooperative members,
- 84(83.17%) of them were male headed whereas the rest
- 17(16.83%) were female headed cooperative members.
- The statistical analysis showed there is no significant
- Sex
- Users
- Non Users
- Total Sample x2-value n=101 n=92 n=193
- N
- %
- N
- %
- N
- %
- Male
- 84
- 83.17
- 73
- 79.35
- 157
- 81.35
- 0.46
- Female
- 17
- 16.83
- 19
- 20.65
- 36
- 18.65
Table 4: Distribution of the sample farmers by sex of the household head cooperative members
| Explanatory Variables | Users (n=94) | Non Users (n=99) | T-Value | P-value | Total Sample (n=193) | |||
|---|---|---|---|---|---|---|---|---|
| Mean | St. dev. | Mean | St. dev. | Mean | St. dev. | |||
| AGE | 44.99 | 7.66 | 49.88 | 9.18 | 4.03** | 0.0001 | 47.32 | 8.75 |
| FMILYSIZE | 4.7 | 1.08 | 4.71 | 0.98 | 2.32** | 0.0214 | 4.71 | 1.03 |
| EDUCATION | 5.2 | 3.23 | 1.65 | 2.07 | -8.99*** | 0 | 3.51 | 3.26 |
Table 5: Distribution of the sample farmers by sex of the household head cooperative members ***, ** and * implies statistically
percentage difference in sex of those who participated in farm product marketing through cooperatives and those who did not participated marketing through cooperatives (Table 3).
Farming Characteristic of the Cooperative Members: • Farm Land Holding: The land holding size of the total sample cooperative members ranges from 0.5 to 12 ha with a mean of 2.83 hectare and standard deviation of 1.83. The cooperative member’s farm product market participant’s average farm land holding size was 3.12ha with a standard deviation of 1.93. The non- participants average farm land holding size was 2.51ha with standard deviation of 1.66. The result shows that there is statistically significant difference in farmland holding size between the users and non-users at 5% significance level. This implies that the larger the total area of the farmland the farmer owns, the higher would be the output. Farmers with higher level of output will expected use the cooperative as their market outlet than those with relatively small farm output (Table 4).
• Farming Experience: the average years of farm experience of the sample cooperative members was 21.85 years and standard deviation of8.97 with maximum and minimum years of farming experience of 46 and 4 years, respectively (Table 4). The cooperative users had on average 19.92 years with standard deviation of 8.28 of farming experience whereas the non-users had on average 23.97 years with standard deviation of 9.26 of farming experience. There is statistical significant difference between cooperative users and non-users in years of farming experience at 5% significant level. This implies that, cooperative members with long experience in farming may have better and wide knowledge of farm output marketing advantages through multipurpose primary cooperative.
• Yield: The average yield of farm products obtained by the sample farmers was 40.35 qt. The cooperative users obtained an average yield of farm products 44.03 qt whereas the non-users obtained an average yield of farm products 36.32 qt (Table 4). There is statistically significant mean difference in yield obtained between cooperative users and non-users at 5% significant level. The significant t-test indicates that more of the sample farmers who used the cooperative as their marketing agents were produced more by using the information and technology supplied through cooperatives.
| Explanatory Variables | Users (n=94) | Non Users (n=99) | T-Value | P-value | Total Sample (n=193) | |||
|---|---|---|---|---|---|---|---|---|
| Mean | St. dev. | Mean | St. dev. | Mean | St. dev. | |||
| FARMSIZE | 3.12 | 1.93 | 2.51 | 1.66 | -2.31** | 0.0219 | 2.83 | 1.83 |
| YIELD | 44.03 | 20.14 | 36.32 | 15.05 | -2.99** | 0.0031 | 40.35 | 18.27 |
| TLU | 3.39 | 0.93 | 3.18 | 0.81 | -1.65 | 0.1007 | 3.29 | 0.88 |
| FAREXP | 19.92 | 8.28 | 23.97 | 9.26 | 3.20** | 0.0016 | 21.85 | 8.97 |
| FARLIN | 0.88 | 1.52 | 0.92 | 1.67 | 0.16 | 0.8721 | 0.89 | 1.59 |
| FARLOUT | 0.37 | 0.79 | 0.39 | 0.71 | 0.26 | 0.7957 | 0.38 | 0.75 |
Table 6: Characteristic of continuous independent variables of the sample farmers Source: Computed from the field survey data. **
Institutional Characteristics of Cooperatives
The cooperatives were a source of fertilizer for the sample cooperative members. The average quantity of DAP and UREA taken from the cooperatives were 4.34 and 3.58 bags respectively (table 5). The sample farmer that used the cooperative as marketing agent for their product took an average quantity of 4.55 bags of DAP and 3.43 bags of Urea (Table 5). The corresponding figures for the non-users were 4.11 bags of DAP and 3.43 bags of Urea. There is significant difference between users and non users of cooperative in using DAP but no significant difference between users and & users of cooperative in using UREA Table 5.
• Membership in Cooperatives: It is the membership in rural primary cooperative society; the study result showed that the average years of membership of the sample farmers in the cooperative was 19.50 years, with max. and min. years of membership of 34 years and 3 year, respectively (Table 5). The average years of membership for users of the cooperative was 17.69 years while the corresponding figure for non-users was 21.47 years. The t-test analysis shows the existence of significant difference in between the participant and non-participant cooperative members with respect to membership years since member of cooperative members is found to be statistically significant at 5% probability level.
Availability of Other Marketing Agents: The average numbers of other alternative market of the sample farmers in the cooperative was 4.9 with the standard deviation of 1.28,The average numbers of other alternative market for users of cooperative was 4.89 while the corresponding figure for non-users was 4.91 and the standard deviation were 1.3 and 1.26. The t-test analysis shows the existence of the absence of statistical significant difference in between the participant and non-participant cooperative members with respect to availability of other alternative market.
| Explanatory Variables | Users (n=101) | Non Users (n=92) | T-Value | P-value | Total Sample (n=193) | |||
|---|---|---|---|---|---|---|---|---|
| Mean | St. dev. | Mean | St. dev. | Mean | St. dev. | |||
| MEMBERSHIP | 17.69 | 7.83 | 21.48 | 7.77 | 3.36** | 0.0009 | 19.49 | 8.01 |
| OMKAG | 4.89 | 1.3 | 4.91 | 1.26 | 0.12 | 0.9057 | 4.9 | 1.28 |
| DCFM | 3.99 | 1.57 | 3.7 | 1.43 | -1.34 | 0.183 | 3.85 | 1.5 |
| QDAP | 4.55 | 2.03 | 4.11 | 1.61 | -1.68* | 0.0952 | 4.34 | 1.85 |
| QUREA | 3.43 | 1.44 | 3.43 | 1.45 | -1.16 | 0.2457 | 3.58 | 1.59 |
Table 7: Institutional characteristics of cooperatives. ***, **, * Represent level of significance at less than 1%, 5%, 10% respe
• Off Farm Income: Out of the sample farmers, 116(60.10%) were involved in different off-farm income activities. The corresponding figures for those that used the cooperative as their marketing agent and for those that didn’t use were 67(66.34%) and 49(553.26%) respectively (Table 6). There is significant difference between cooperative users and non-users in different off-farm income activities at 10% significant level. The t-test indicates more of the sample farmers used the cooperative as their marketing agents were beneficiary from the services mentioned above.
• Credit: Out of the total sample farmers, 127(65.80%) received credit. The corresponding figures for those that used the cooperative as their marketing agent and for those that didn’t use were 86(85.15%) and 41(44.57%) respectively (Table 6).There is significant difference between cooperative users and non-users in different access to credit at 1% significant level. This implies that, credit uses as sources for the purpose of prepayment, fattening livestock, contracting land and ox and for other social obligations. But the interest rate with which these institutions extended credit was so much high. For example, Oromia saving and credit S.C. from which the majority of the sample farmers took credit, charge an interest rate of 17% and this was the minimum interest rate charged by the micro finance institution operating in the area. In addition to this, there are restrictive procedures to get credit from these sources.
• Distance from District Market: As it is showed on (Table 6), the average distance of woreda market from the cooperative members’ residence was 10.67 km with a standard deviation of 6.31. The mean distance of woreda market for the farmers who participated in the market was 6.79 km with standard deviation of 3.19 while the mean distance for non-participants was 10.05 km with standard deviation of 5.44. There was a significant difference related to distance to woreda market between those participated and those who did not participate in the marketing members’ farm product through multipurpose primary cooperatives at 1% level of significance. The result show that the distance of cooperative member’s houses from district market for users of their cooperative as marketing agent was shorter than those cooperative members who did not uses their cooperative as their marketing agent.
- Users n=101 non users total sample n=193 x2-value n=92
- Independent
- Variable
- N
- %
- N
- %
- N
- %
- OFFINC
- 67
- 66.34
- 49
- 53.26
- 116
- 60.10
- 3.43*
- CREDIT
- 86
- 85.15
- 41
- 44.57
- 127
- 65.80
- 35.24***
- AOS
- 63
- 62.38
- 6
- 6.52
- 69
- 35.75
- 65.29***
- TROEAC
- 59
- 58.00
- 2
- 2.17
- 61
- 31.61
- 70.45***
- POCURPERC
- 54
- 53.47
- 35
- 38.04
- 89
- 46.11
- 4.61**
- POFUPERC
- 78
- 77.23
- 70
- 76.09
- 148
- 76.68
- 0.04
Table 8: Characteristic of dummy independent variables of the sample farmers.
• Availability of Other Services: Besides supplying farm inputs, and purchasing farm produces, some cooperative provide other services to the farmers. The cooperatives gave milling service and other services. Out of the sample farmers, 35.75% were beneficiary from these services. The corresponding figures for those that used the cooperative as their marketing agent and for those that didn’t use were 62.38% and 6.52% respectively (Table 6). There is statistically significant difference between cooperative users and non-users in getting these services at 1% significant level. The significant t-test indicates that more of the sample farmers who used the cooperative as their marketing agents were beneficiary from the services mentioned above.
Out of the total samples, average cooperative members of 31.61% got training from their cooperative in this study, the corresponding figure for users and non-users were 58.42% and 2.17%respectively (Table 6). There are statistically significant difference b/n cooperative users and non-users in getting training or education from the cooperative at 1% significant level.
Econometric Results
Prior to running the Double Hurdle model the hypothesized independent variables were tested for possible existence of multicollinearity problem that is the situation where the explanatory variables are highly correlated among themselves. In order to check the association between continuous and discrete variables Variance Inflation Factor (VIF) and contingency coefficients tests were used and no problem was observed. Mean replacement was done for some outlier issues in the variables. Whereas in order to check for the possible existence of heteroskedasticity problem a Breusch-Pagan test was applied and showed the absence of the problem. Therefore, all the model outputs were estimated using robust standard errors to correct for heteroskedasticity Results of the econometric analyses were presented and discussed in the following sections.
Determinants of Cooperative Member’s Farm Product Market Participation through MPPCs: Results of the first hurdle showed that, the cooperative member’s decision to participate in the farm products market significantly determined by five out of the fifteen variables included in the model. These are educational status of the cooperative member’s household head, access to Credit, patronage refund, cooperative price and position in the committees of cooperatives (Table 7).
- Educational Status: The econometric result showed positive and significant relationship between the educational status of the cooperative member’s and the decision to participate marketing through cooperatives at 5% significance level. as the cooperative member’s level of formal education increased by one grade, the probability of market participation through cooperatives will increase by 3.93%. This may be due to the higher the education level, the better would be the knowledge, acquire news and education about the benefits of the primary cooperative easily. It is also evident that educated cooperative members tendency to accept different agricultural technologies is high, so that they can produce more surplus for market. The result is in conformity with the findings of Aman, et al., Muthyalu, Enete and Igbokwe, Randela, et al. [16, 17, 18, 19] who argued that education will endow the household with better production and managerial skills could lead to increased participation in the market.
- Access to Credit (CREDIT): Access to credit positively & significantly influenced the members ‘marketing participation through cooperatives at 5% significance level. Cooperative members’ access to credit increased the probability of market participation through cooperatives by 11.30%. It implies that access to credit gives the farm households the economic power to cultivate on large scale by rent in more land for farm production and enables farmers to buy farm inputs. This finding of the study is consistent with the findings obtained by Igbokwe, Randela, et al. [19] also found that access to credit had a positive and significant influence on producers‟ likelihood to participate in cotton market in South Africa, because availability of credit reduces transaction costs of both input and output markets. Similarly, a study done by Alema; Leza and Kuma; Ayenew [20, 21, 22] found positive & significant relationship between access to credit &market participation decision.
- Patronage Refund (PATREF): Patronage refund influenced positively and significantly the marketing of members through cooperatives at 5% significant level. A patronage refund of one birr for a quintal of farm product increases the probability of marketing participation of cooperative member’s by 0.26%. The implication is that cooperative members are encouraged to market their farm products through the cooperative if they get patronage refund. Similar result was also found by Muthyalu; similarly Daniel [5, 17] cooperatives should be able to pay patronage dividend to their member patrons, when they get profit after auditing their business operations if they don’t have profit should have to inform the status of the dividend payment issue after the auditing.
- Cooperative Price (COOPP): cooperative price affect the decision to participate in agricultural output marketing through cooperative significantly at 1% significance level. As charging of competitive price for a quintal of member’s farm product increase by one ETB, the probability of market participation through cooperatives increases by 13.92%. The implication is that if there are other marketing agents in the study area cooperatives have to charge a competitive price in order to maintain the smooth relationship with cooperative members. This was in line with the results of alema, 2008; Ayenew, 2018 [20, 22] member’s observation on cooperative price may influence participation in marketing of output through cooperatives positively.
- Position in the Cooperative (POSITION): having position in MPPCs committee influences the probability of marketing farm output through their MPPCs positively at 5% significant level. If a cooperative member has a position in the cooperative, then the probability of his/ her market participation through cooperatives increases by 22.46%. This implies that having position in the cooperative increases the attachment of the farmer to the cooperative than the ordinary members and helps them to realize the benefits of the cooperative. So their participation in the marketing of farm products through the cooperative is better than the ordinary members. This was in line with the results of Daniel [5]. Farmers that have position in the cooperative used the cooperative better than the ordinary members as their marketing agent for their teff.
| Coef. | Robust Std. Err. | z | P>z | Marginal effect | |
|---|---|---|---|---|---|
| EDUCATION | .2016095** | 0.0660639 | 3.05 | 0.002 | 0.039335 |
| FAMILYSIZE | 0.1537954 | 0.1614279 | 0.95 | 0.341 | 0.0371952 |
| MEMBERSHIP | 0.0322006 | 0.0370642 | 0.87 | 0.385 | 0.0078089 |
| OFFINC | -0.502569 | 0.3738209 | -1.34 | 0.179 | -0.0432708 |
| CREDIT | 1.158032** | 0.4641162 | 2.5 | 0.013 | 0.1129667 |
| FARMSIZE | 0.0810444 | 0.1278352 | 0.63 | 0.526 | 0.0221749 |
| YIELD | -0.0147836 | 0.0151301 | -0.98 | 0.329 | -0.001647 |
| TLU | -0.0056092 | 0.1787924 | -0.03 | 0.975 | 0.0256706 |
| OMKAG | 0.0820551 | 0.146887 | 0.56 | 0.576 | 0.0148903 |
| AOS | 0.5272329 | 0.3588729 | 1.47 | 0.142 | 0.1127166 |
| DCFH | -0.0211371 | 0.0799387 | -0.26 | 0.791 | 0.0198711 |
| PATREF | .0177654** | 0.0066152 | 2.69 | 0.007 | 0.0025514 |
| COOPP | 1.390487*** | 0.3260991 | 4.26 | 0 | 0.1391835 |
| POSITION | .871961** | 0.3384775 | 2.58 | 0.01 | 0.224639 |
| FAREXP | 0.0210931 | 0.0224936 | 0.94 | 0.348 | -0.001139 |
| _cons | -4.375004 | 1.231501 | -3.55 | 0 |
Table 9: Factors affecting marketing of farm products through cooperatives. ***, ** and * implies statistically significance at 1
Table 8: Factors affecting marketing of farm products through cooperatives. *, and * implies statistically significance at 1, 5, and 10% level respectively. Source: Model output Determinants of Quantity of Cooperative Member’s Farm Products Sales: Similarly the intensity of participation of the cooperative members in farm products marketing through MPPCs was significantly determined by seven variables out of fifteen variables included in the analysis. These are educational level of the cooperative members head, family size, farmland size, yield obtained, distance of cooperatives from member’s house, patronage refund and the farm experience determines the intensity of farm products marketing through multipurpose primary cooperatives.
- Family Size (FAMILYSIZE): the result showed that family size affects level of market participation of cooperative members’ farm product through cooperatives negatively at 5% significance level. It was revealed that as the sample members family size increase by one adult equivalent (AE) the household retain an additional 1.78 quintals of farm products for consumption which otherwise would be marketed. It is assumed that household with larger family size consume more of what is produced in the house and little will remain to be marketed. The result is consistent with the hypothesized expectation and confirms the result of Benjamin, et al.) and Siziba, et al., Leza and Kumar [21, 23, 24] Households with large family sizes need to feed their family first and take the remaining small portion surplus to the market especially if the crop is consumable at home.
- Farmland Size (FARMSIZE): the result showed that farmland size significantly determines intensity of farm product marketing through cooperatives. the result depicts that there was positive and significant relationship between cooperative member’s farmland size and intensity of farm product marketing through cooperatives at 1% significance level. As the farmland size increases by a hectare the cooperative members will sell through cooperatives additional 1.1 quintals of farm product. This indicates that the farmers with relatively higher land holding have more space to produce both food crops and cash crops. Therefore, households can produce more farm products for the market. The result is in conformity with the findings of Boughton, et al., Benjamin, et al., Muthyalu, Leza and Kuma [17, 21, 23, 25].
- Yield of Earm Products (YIELD): This study showed that the quantity of farm products marketed through the cooperative is positively related with the yield obtained at 10% significant level. An increase in the yield obtained of farm products of the farmer by one qts, increases the quantity of farm products marketed through the cooperatives by 0.07 qts. This implies that higher the output the farmer obtained, the higher would be the amount marketed through the cooperative. This result is with the conformity of the studies of Daniel [5].
- Distance of the Cooperatives from the Farmer’s House (DCFH): The result showed that distance of the Cooperative from the farmer’s house determines intensity of farm product marketing through cooperatives negatively at 10% significance level. An increase in the distance of the farmer’s house from the cooperative by a kilometer reduces the quantity of farm products marketed through the cooperatives by 0.51qts. This is due to the proximity of the cooperative for the member residence reduces the cost of time and labor that the farmer spent in searching for a buyer for his products. The other advantage is that as the member is close (near) to the cooperative, he/she will have more knowledge about the cooperative and its benefits; this finding is in line with the conformity studies of Daniel; Leza and Kumar; Ayenew [5, 21, 22].
- Farming Experience (FAREXP): the result showed that Farming experience significantly determines intensity of farm product marketing through cooperatives at 5% significance level. The result shows that, when the household experience increased by one year the intensity of market participation through the cooperatives increased by 0.23 quintals. Similarly a study done by Masoku, et al. [26] found a positive and significant relationship between smallholder farmer’s level of maize market participation and farming experience in marketing channels. Similarly studies by [17] cooperative members with long experience in farming may have better and wide knowledge of farm output marketing advantages through multipurpose primary cooperative.
| QCMPMTMPC | Coef. | Robust Std. Err. | Z | P>|z| |
|---|---|---|---|---|
| EDUCATION | 1.101005*** | 0.2535298 | 4.34 | 0 |
| FAMILYSIZE | -1.782114** | 0.5293565 | -3.37 | 0.001 |
| MEMBERSHIP | -0.0549344 | 0.0943856 | -0.58 | 0.561 |
| OFFINC | -0.3123893 | 1.004346 | -0.31 | 0.756 |
| CREDIT | -1.598799 | 2.290906 | -0.7 | 0.485 |
| FARMSIZE | 2.809744*** | 0.505279 | 5.56 | 0 |
| YIELD | .0689225* | 0.0365824 | 1.88 | 0.06 |
| TLU | 0.6005103 | 0.4913033 | 1.22 | 0.222 |
| OMKAG | 0.0048342 | 0.3802806 | 0.01 | 0.99 |
| AOS | -1.498517 | 1.501267 | -1 | 0.318 |
| DCFH | -.5070206* | 0.2961807 | -1.71 | 0.087 |
| PATREF | .0471875*** | 0.0056605 | 8.34 | 0 |
| COOPP | 0.781871 | 1.736444 | 0.45 | 0.653 |
| POSITION | -0.5814538 | 1.237015 | -0.47 | 0.638 |
| FAREXP | .2272471** | 0.0846832 | 2.68 | 0.007 |
| _cons | 7.071456 | 5.072827 | 1.39 | 0.163 |
| Sigma _cons | 3.788878 | 0.3060311 | 12.4 | 0 |
Table 10: Factors affecting level of market participation through cooperatives (In Qt). ***, ** and * implies statistically signif
Table 9: Factors affecting level of market participation through cooperatives (In Qt). *, and * implies statistically significance at 1, 5, and 10% level respectively. Source: Model output
- Educational Status (EDUCATION): the result showed that educational status of the household significantly determines both participation decision and intensity of farm output market participation decision through their MPPCs. This makes educational status of the cooperative members a cross cutting variable in both hurdles. The econometric result showed positive and significant relationship between the educational status of the cooperative members and intensity of farm product participation decision through cooperatives at 1% significance level. It was revealed that as the educational status of the cooperative member’s increases by one grade, the intensity of cooperative member’s farm output marketing through cooperative will increase by 1.1 quintals. This may be due to the higher the education level, the better would be the knowledge, acquire news and education about the benefits of the primary cooperative easily. It is also evident that educated farmers tendency to accept different agricultural technologies is high, so that they can produce more surplus for market. The result is in conformity with the findings of Aman, et al. [16]. It is also in conformity with Muthyalu [17]. Education level of farmers was increase the ability to obtain process and use of agriculture related formation and the level of participation in agricultural input and output marketing in a better way
- Patronage Refund (PATREF): the result showed that Patronage refund significantly determines both the participation decision and intensity of farm product marketing through MPPCs. This makes Patronage refund of the cooperative members a cross cutting variable in both hurdles. As it was hypothesized the econometric result showed positive and significant relationship between the patronage refund of the cooperative members and intensity of farm product participation decision through cooperatives at 1% significance level. A patronage refund of one birr for a quintal of farm product increases the intensity of marketing of farmer cooperative members output through cooperative by 0.05 quintals. The implication is that farmers are encouraged to market their farm products through the cooperative if they get patronage refund. The result is in conformity the findings by that farmers are expectant to market their teff through the cooperative if they get patronage refund; similarly cooperatives able to pay patronage dividend to their member patrons, when they get profit after auditing their business operations if they don’t have profit inform the status of the dividend payment issue after the auditing [5, 27, 28, 29, 30, 31, 32, 33].
Conclusions and Recommendations
Conclusion
The study was undertaken with the objectives of identifying factors that influence members’ marketing decision through their MPPCs were analyzed in Hababo Guduru woreda. Based on the findings of the study, the double hurdle model of the first hurdle analysis (probit part) was employed to identify the determinants of cooperative members’ participation in marketing farm product through their cooperatives in the study area. Fifteen variables were hypothesized to explain probability participation decision and used to estimate the probit model. The estimated coefficients of five variables included in this model were found to have a significant influence on the participation decision of members marketing farm product through their cooperatives. These variables include: educational status of the cooperative member’s, access to credit, patronage refund, cooperative price, and having position in the committee of cooperatives affect farm product marketing through cooperatives positively and significantly at 1% probability level and four variables were significant at 5% probability level. Out of these significant variables, the coefficients of five variables were indicating positive effects of these variables on the cooperative members marketing their farm product through multipurpose primary cooperatives in the study area Similarly, factors affecting the level of members’ marketing participation of their farm products through multipurpose primary cooperatives were analyzed in the second part (truncated regression) of double hurdle model estimation. Fifteen variables were entered to the estimation and five of the included potential variables affect the level of members’ marketing participation of their farm products through multipurpose primary cooperatives positively and significantly. These significant variables include: Educational status, farmland size, Yield of farm products, patronage refund and the farm experience. Three variables were significant at 1 % significance level while the one variable was significant at 5% significance level and the remaining one variable was significant at 10 % significance level. The two variables, family size and distance of cooperatives from farmer’s house are influences the level of members’ marketing participation of their farm products through multipurpose primary cooperatives negatively and significantly at 5% and 1% significance level respectively. Two variables are significantly affected both in members’ marketing participation and their level of participation of marketing their farm product through their cooperatives in the study area. These variables includes: Educational status and patronage refund. This implies that, these members’ Educational status and patronage refund are the major factors in determining cooperative members’ participation decisions in marketing their farm product through their multipurpose primary cooperatives.
Recommendation
From the findings of this study, It is suggested that for consideration in improving the performance of the agricultural cooperatives in the study area. These may be broadly viewed as identifying the factors that influence cooperative members marketing of farm produces through the cooperatives.
Based on the findings that access to credit, is an influencing factor on participation decision of cooperative members’ farm product marketing through cooperatives, the MPPCs’ financial performance result indicates that their financial performance is poor since the major source of fund, for operation is from external sources. Efforts aimed at promoting productivity through the use of improved inputs such as fertilizers should also take into account for the existence of reliable financial sources. It requires the government arranging suitable strategies of credit services for farmers so that farmers could be saved from risks of price falls especially during harvest times i.e. if farmers get credit for their urgent cash requirements, they could wait for prices to raise up for agricultural produces that to sell later. Furthermore, family size, farmland holding size, produce surplus, longer distances of cooperative member’s house from primary cooperatives, Education level, Patronage refund should be designed to increase awareness about services obtained from primary agricultural cooperatives regarding to marketing their farm output through their MPPCs.
References
-
ICA (2016) International co-operative Annual Alliance Report. Brussels - Belgium, 5.
-
BoARD (2016) Regional annual report. Mekelle, Tigray.
-
Befekadu Alemayehu (2014) Role of Cooperatives and Participation of their Members in Agricultural Output Marketing: The Case of Baso Liben Woreda, East Gojjam Zone, M.Sc. Thesis in Agricultural Economics, Haramay University, Ethiopia.
-
Mohamed E, Hajime K, Ichizen M, Arif A (2012) Japanese agricultural cooperatives at crossroads: A Review. American Eurasian J Agric & Environ Sci 12(7): 943-953.
-
Daniel (2006) Performance of Primary Agricultural Cooperatives and Determinants of Members’ Decision to use as Marketing Agent in AdaaLiben and Lume Districts. MSc Paper, Alemaya University, Ethiopia.
-
Gashaw Abate, Francesconi GN, Kindie Getenet (2013) Impact of agricultural cooperatives on smallholders‟ technical efficiency: Evidence from Ethiopia. Euricse Working Paper.
-
CSA (2007) The 2007 population and housing census of Ethiopia: Central Statistics Authority, Addis Ababa, Ethiopia.
-
HGWANRDO (2018) Hababo Guduru District Agriculture and Natural resource development Office.
-
Yamane T (1967) Statistics: An Introductory Analysis, 2nd (Edn.), New York: Harper and Row.
-
HGWCOPO (2018) Hababo Guduru woreda cooperatives organization and promotion office.
-
Wooldridge JM (2002) Econometric analysis of cross section and panel data. MIT Press.
-
Humpheys RB (2010) Dealing With Zeros in Economic Data. Economics.
-
Newman C, Henchion M, Matthews A (2003) A double- hurdle model of Irish house hold expenditure on prepared meals. Applied Economics 35(9): 1053-1061.
-
Gujarati DN (2004) Basic Econometrics. 4th (Edn.), The McGraw-Hill Companies.
-
Healy FJ (1984) Statistics: A Tool for Social Research. Wadsworth.
-
Aman Tufa, Adam Bekele, Lemma Zemedu (2014) Determinants of Smallholder Commercialization of Horticultural Crops in Gemechis District, West Hararghe Zone, Ethiopia. African Journal of Agricultural Research 9(3): 310-319.
-
Muthyalu M (2013) The factors that influence the participation of co-operative members in the agricultural input and output marketing: a case study of Adwa district, Ethiopia. Journal of Business Management and Social Sciences Research 2(4): 121-130.
-
Enete A, Igbokwe E (2009) Cassava Market Participation Decisions of Producing Households in Africa. Tropicultura 27(3): 129-136.
-
Randela R, Alemu Z, Groenewald J (2008) Factors Enhancing Market Participation by Small-Scale Cotton Farmers. Agrekon 47(4): 451-469.
-
Alema W (2008) Analysis of the Role of Cooperatives in Agricultural Input and Output Marketing in Southern Zone of Tigray. CGSpace.
-
Leza T, Kuma B (2016) Analysis of Cooperative Member Participation in Agricultural Input and Output Marketing: The Case of Damote Gale District of Wolaita Zone in Ethiopia. Asian Journal of Agricultural Extension, Economics & Sociology 9(1): 1-13.
-
Ayenew (2018) Determinants of Output Marketing through Cooperatives in Southwest Oromia, Ethiopia. Horn of African Journal of Business and Economics.
-
Benjamin A, Yaw Bonsu O, Seini W (2014) Market Participation of Smallholder Maize Farmers in the Upper West Region of Ghana. African Journal of Agricultural Research 9(31): 2427-2435.
-
Siziba S, Diagne A (2011) Determinants of cereal market participation by sub-Saharan Africa smallholder farmer 2(1): 180-193.
-
Boughton D, Mather D, Barrett C, Benfica B, Abdula R, et al. (2007) Market Participation by Rural Households in a Low Income Country: An Asset-Based Approach Applied to Mozambique. Faith and Economics 50(1): 64-101.
-
Masoku MB, Makhura MT, Rwelarmira JK (2010) Factors Affecting Marketing Decisions in the maize Supply Chain among Smallholders in Swaziland. Agrekon. Agricultural Economics Research, Policy and Practice in South Africa 40(4): 698-707.
-
(2013) Population Projection at Wereda Level From 2014 - 2017. SCRIBD.
-
Eleni G (2001) Market institutions, transaction costs, and social capital in the Ethiopian grain market. International Food Policy Research Institute.
-
Eleni G, Barrett CB, Dorosh P (2003) Technological change and price effects in agriculture: conceptual and comparative perspectives. International Food Policy Research Institute.
-
Fafchamps M, Hill RV (2005) Selling at the farm gate or travelling to market. American Journal of Agricultural Economics 87(3): 717-734.
-
Goitom Abera (2009) Commercialization of Smallholder Farming: Determinants and Welfare Outcomes a Cross- sectional Study in Enderta District, Tigrai, Ethiopia. University of Agder.
-
Storck H (1991) Farming system and farm management practices of smallholders in the Hararghe Highland: A Baseline Survey. Farming Systems and resource economics in the tropics.
-
Woldemariam AA (2008) Analysis of the Role of Cooperatives in Agricultural Input and Output Marketing in Southern Zone of Tigray, Ethiopia. Mekelle University.
- Enhancement of Vegetative Growth and Fruit Yield in Cucumber (Cucumis sativus L.) via Spiritual Blessing (Biofield) Energy Intervention
- Production of Açaí (Euterpe oleracea Mart.) under Different Agroforestry System Management Intensities in Amazonian Floodplain (Varzea) Forests
- Coffee and the Production Region: What is the Secret to the Expression "Quality"?
- Experiential Agripreneurship Training in Sub-Saharan Africa: Integrating a Business Incubator into Postgraduate Livestock Education at the University of Buea
- Advances in Agricultural High-Quality Development
- Linking Compost Residue to ABAGE in Plants - a Short Note