Expression Pattern of in Vitro Organogenesis-Associated Genes as Transcriptional Marker in Indian Sandalwood (Santalum Album L.)
Indian sandalwood (Santalum album L.) is an expensive wood that requires reproducible method for mass propagation to ensure sustainable use. Organogenesis employs different combinations of the medium;. its suitability is decided based on the explant’s morphological changes. Early prediction of organogenesis in the explant helps reduce the combinations thereby saving time and resources. We initially developed an efficient protocol for the direct and indirect organogenesis (up to shooting development phase) of sandalwood in the present investigation. Woody Plant Media (WPM) supplemented with various concentrations of 6-Bezylaminopurine (BAP) and 1-Naphthaleneacetic acid (NAA) were tested for direct organogenesis, while different treatments consisting of various levels of 2,4-dichlorophenoxyacetic acid (2,4-D), NAA, BAP, Adenine sulphate (ADS), glycine and potassium nitrate were tested for indirect organogenesis.Three stages of leaf development were selected viz., the leaf just after inoculation in WPM media, initial stage of callus formation from leaf and shoot formation for expression pattern analysis. The targeted genes were Alternative oxidase (ao), Late embryogenesis abundant (lea), Cytochrome P450 (cyt-p450), ABC transporter (abct), and Serine-threonine phosphatase (stp) which are associated with in vitro organogenesis. The expression patterns were evaluated to identify a transcription marker. During the initial stages of organogenesis, ao, cyt-p450 and abct showed no/little change in expression in thedirect pathway but up-regulation of ao and abct and downregulation of cyt-p450 were observed in the indirect pathway. Expression of lea was increased up to 70-fold during direct and dropped to half during indirect organogenesis.
Introduction
Sandalwood (Santalum album L.) is one of the tree species renowned as ‘The Royal Tree’ of the plant kingdom [1]. Santalum album L., belongs to the family Santalaceae, is an approximately 12-15 meters tall, evergreen, Hemiroot parasitic tree which is highly valued for its fragrant heartwood. In India, sandalwood is more confined to the southern region, especially in Karnataka, Tamil Nadu, and Kerala [2]. There are certain traits that hold S. album distinctive and inimitable due to its ability to grow under diverse conditions, viz. adaptability to very low rainfall and a wide variety of soil types, innate survival capacity, short juvenile phase, and profuse coppicing ability [3]. However, the major constraints include predominant out crossing, very long seed dormancy period (ranges from 2 months to 12 months and normally take 4-8 weeks for the germination), flowering by the end of 3–4 years, and flowering and fruiting in 60% plants only. Due to continuous depletion in sandalwood trees coupled with a slow regeneration rate, there is an immediate need for its conservation. The conventional breeding methods integrate new genetic information that can be an expensive and difficult task because of its long generation time, sexual incompatibility, and heterozygous nature [4]. Alternatively, in vitro propagation and regeneration techniques are the major approaches for rapid sandalwood propagation that fulfills the scarcity of sandalwood in the market [5]. In vitro organogenesis consists of many aspects such as phytohormone perception, dedifferentiation of differentiated cells to acquire organogenic competence, re-entry of quiescent cells into the cell cycle, and organization of cell division to form specific organ primordia and meristems. In vitro organogenesis depends on the application of exogenous phytohormones, in particular, auxin and cytokinin, and also on the ability of the tissue to respond to these phytohormone changes during culture. Thus, the tissue culture technique can be best exploited for the physiological dissection of organogenesis in vitro [6]. During indirect organogenesis, callus formation occurs naturally in response to wounding.
It is imperative that one should focus on understanding the physiological and molecular basis of regeneration potential in plant cell cultures. A better knowledge of the regulation of gene activity and plant metabolism pathways successfully expands the genetic pool thereby enhancing the clonally propagated plantation stocks [7]. Changes in the gene expression pattern are regulated at several levels. The developmental switching to direct or indirect organogenesis involves differential gene expression, conferring the ability to manifest the organogenesis potential to the differentiated cells. It has been postulated that the different hormonal treatments induce different responses in genes, and it is reflected in transcript number. Reverse transcription (RT) followed by quantitative polymerase chain reaction (qPCR) represents a powerful tool for the detection and quantification of mRNA. It is the most sensitive method for the detection and quantification of gene expression levels in particular for low abundant transcripts in tissues with low RNA concentrations [8, 9, 10]. Thus, with the consideration of the importance of organogenesis in sandalwood tissue culture and the genetic expression of genes involved in direct and indirect organogenesis, the present investigation for standardization of tissue culture protocol and genetic expression was carried out.
Materials and Methods
Experimental Material
Tender nodes were collected from approximately 20 years old sandalwood trees cultivated at Anand Agricultural University Campus, Anand, Gujarat, India. The explants were made 2-3 cm long using sharp scissor and surface sterilized using 1 mlL-1 Tween-20 (5 minutes), 1000 mgL-1 Carbendazim-50% (7 minutes), 200 mgL-1 Cefotaxime (5 minutes), 200 mgL-1 Kanamycin (5 minutes) and 1000 mgL-
1 mercuric chloride (3 minutes). Surface sterilized explants were then inoculated on MS medium for the shoot induction response. Leaves that emerged from the nodes were used as the experimental material in the present investigation.
Direct and Indirect Organogenesis
For both the organogenesis pathways, direct and indirect, in vitro leaves were placed on the shoot induction media. The shoot induction media for direct organogenesis was comprised of Woody Plant Medium (WPM) [11] supplemented with various combinations of 6-Benzylaminopurine (BAP) and 1-Naphthaleneacetic acid (NAA) and 3% w/v sucrose (Table 1) while the shoot induction media for indirect organogenesis was comprised of WPM supplemented with various combinations of Glycine, Adenine Sulphate (ADS), Potassium nitrate KNO3), NAA, BAP, 2,4-Dichlorophenoxyacetic acid (2,4-D) and 3% w/v sucrose (Table 2). The KH2PO4 concentrations for direct and indirect pathways were 170 mgL-1 and 85 mgL-1, respectively while the K2SO4 concentrations for direct and indirect pathways were 990 mgL-1 and 495 mgL-1, respectively. The media was jellified using 0.9% Agar and the pH of the medium was adjusted to 5.7 ± 0.01. All the cultures were incubated in a growth room maintained at 25 ± 1°C, 40–60% relative humidity, and a 16/8-hour light/dark regime were provided by a cool-white, fluorescent lights having 36 μmolm−2s−1 intensity. Observation on bud frequency %, the area covered by bud sprouting (%), number of shoots, length of shoots (cm), days to callus induction, callus induction (%), callus frequency (%), callus type, callus color, and health range were recorded at the end of 40, 80 and 120 days.
| Basal | BAP(mgl-1) | NAA(mgl-1) | |
|---|---|---|---|
| $SD_{1}$ | WPM | 0 | 0 |
| SD_{2}$ | WPM | 1 | 0 |
| SD_{3}$ | WPM | 1.5 | 0 |
| SD_{4}$ | WPM | 2 | 0 |
| SD_{5}$ | WPM | 2.5 | 0 |
| SD_{6}$ | WPM | 0 | 0.2 |
| SD_{7}$ | WPM | 1 | 0.2 |
| SD_{8}$ | WPM | 1.5 | 0.2 |
| SD_{9}$ | WPM | 2 | 0.2 |
| SD_{10}$ | WPM | 2.5 | 0.2 |
| SD_{11}$ | WPM | 0 | 0.4 |
| SD_{12}$ | WPM | 1 | 0.4 |
| SD_{13}$ | WPM | 1.5 | 0.4 |
| SD_{14}$ | WPM | 2 | 0.4 |
| SD_{15}$ | WPM | 2.5 | 0.4 |
Table 1: Treatments for direct organogenesis. All treatments have been provided 3% sucrose with 0.9% agar BAP = 6-Benzylaminopuri
| Media code | Media composition | -1 BAP (mgL ) | 2,4- -1 D(mgL ) | Glycin -1 (mgL ) | -1 ADS (mgL ) | KNO3 -1 (mgL ) | - NAA (mgL 1 ) |
|---|---|---|---|---|---|---|---|
| SI 1 | WPM | - | - | - | - | - | - |
| SI 2 | Modified WPM | 0 | 1 | - | - | - | - |
| SI 3 | Modified WPM | 0.5 | 1 | - | - | - | - |
| SI 4 | Modified WPM | 1 | 1 | - | - | - | - |
| SI 5 | Modified WPM | 0 | 2 | - | - | - | - |
| SI 6 | Modified WPM | 0.5 | 2 | - | - | - | - |
| SI 7 | Modified WPM | 1 | 2 | - | - | - | - |
| SI 8 | Modified WPM | 0.5 | 2.5 | - | - | - | - |
| SI 9 | Modified WPM | 0 | 2.5 | - | - | - | - |
| SI 10 | Modified WPM | 1 | 2.5 | - | - | - | - |
| SI 11 | Modified WPM | 0 | 5 | - | - | - | - |
| SI 12 | Modified WPM | 0.5 | 5 | - | - | - | - |
| SI 13 | Modified WPM | 1 | 5 | - | - | - | - |
| SI 14 | WPM | - | - | 1 | - | - | - |
| SI 15 | WPM | - | - | 1 | 25 | - | - |
| SI 16 | WPM | - | - | 1 | 25 | - | - |
| SI 17 | WPM | - | 2 | 1 | - | - | - |
| SI 18 | WPM | - | 3 | 1 | 25 | - | - |
| SI 19 | WPM | - | 2 | - | - | 630 | - |
| SI 20 | WPM | - | 3 | - | - | - | - |
| SI 21 | WPM | - | 0.5 | - | - | - | - |
| SI 22 | WPM | - | 1 | - | - | - | - |
| SI 23 | WPM | - | 1.5 | - | - | - | - |
| SI 24 | WPM | - | 2.5 | - | - | - | - |
| SI 25 | WPM | - | 2 | - | - | - | - |
| SI 26 | WPM | - | 3.5 | - | - | - | - |
| SI 27 | WPM | - | 4 | - | - | - | - |
| SI 28 | WPM | - | 4.5 | - | - | - | - |
| SI 29 | WPM | - | 5.0 | - | - | - | - |
| SI 30 | WPM | - | 3 | - | - | - | - |
| SI 31 | WPM | 0 | 0.5 | - | - | - | - |
| SI 32 | WPM | 1 | 0 | - | - | - | - |
| SI 33 | WPM | 1 | 0.5 | - | - | - | - |
| SI 34 | WPM | 2 | 0 | - | - | - | - |
| SI 35 | WPM | 2 | 0.5 | - | - | - | - |
| SI 36 | WPM | 4 | 0 | - | - | - | 0.4 |
Table 2: Treatments for indirect organogenesis. All treatments have been provided 3% sucrose with 0.9% agar Modified WPM = Half o
Gene Expression Profiling
In silico selection of genes and primer designing: To the best of our survey, there has been no report found on the gene expression in sandalwood during organogenesis. A total of thirty-one various gene sequences for the callus and shoot development stage were selected from the findings of Che, et al. [12] on Arabidopsis and subjected to BLAST analysis (Table 3). Sequences for the primer design were selected from the conserved region of selected genes using the primer BLAST tool available at the NCBI website. Two pairs of primers were selected for each of the in silico identified genes. The primers were checked for dimer or hairpin formation using the Oligo IDT analyzer tool. Along with the gene-specific primers, a DNA-specific primer has also been designed from the intron region of the gene to check the cDNA sample for DNA contamination. Five sets of primers, representing five different genes viz. Alternative oxidase (ao), Late embryogenesis abundant proteins (lea), Cytochrome P-450 (cytp450), ATP binding cassette transporter proteins (abct), and Serine threonine phosphatase (stp) were designed using the Primer-BLAST tool available at NCBI website (Table 4).
| Sr.No. | Gene | Primer Name | Sequence | In silico product length (bp) |
|---|---|---|---|---|
| 1 | Alternative oxidase (AO) | SW1 F | TGCCTGCACCGGCTATTG | 90 |
| SW1 R | CTTCATCAGCACGGACCACC | |||
| 2 | LEA family protein (LEA) | SW2 F | GAGAAGGGAAGCGAAGTGGG | 145 |
| SW2 R | ACTCCGAAGCAAACTGAGCA | |||
| 3 | Cytochrome P-450 (CYTP450) | SW3 F | AAGAGTCGGCTTACGAGCTG | 110 |
| SW3 R | CTTGGGGCTGAAGAGATGGG | |||
| 4 | ATP Binding Cassette Transporter proteins (ABCT) | SW4 F | GGATGAGCCAACTTCAGGCT | 82 |
| SW4 R | TGCTAGGCTGGTGTATGGTG | |||
| 5 | Glyceraldehyde-3-phosphate dehydrogenase (GAPDH) | SW5 F | ATGCGGACATTAAGGCTGCT | 113 |
| SW5 R | TGACCTGTTGTCGCCAATGA | |||
| 6 | Serine Threonine Phosphatase (STP) | SW6 F | CACACCGTGGTTGATGGCT | 150 |
| SW6 R | TGAACGTGACCGGCAAAAAC |
Table 3: List of genes in callus development and shoot development in Arabidopsis.
| Sr. No. | Gene | Primer name | Sequence (5ˈ - 3ˈ) | In silico product length (bp) | Stage | Absolute quantity (copy no./µg of total RNA) | Relative quantity |
|---|---|---|---|---|---|---|---|
| 1 | Alternative oxidase (ao) | SW1 F | TGCCTGCACCGGCTATTG | 90 | D1 | 15276.1 | 1 |
| D2 | 14721.9 | 0.9 | |||||
| D3 | 41355.4 | 2.7 | |||||
| SW1 R | CTTCATCAGCACGGACCACC | ID1 | 10470.2 | 1 | |||
| ID2 | 16953.3 | 1.6 | |||||
| ID3 | 16082.7 | 1.5 | |||||
| 2 | LEA family protein (lea) | SW2 F | GAGAAGGGAAGCGAAGTGG G | 145 | D1 | 1067.8 | 1 |
| D2 | 5635.8 | 5.2 | |||||
| D3 | 79284.9 | 74.2 | |||||
| SW2 R | ACTCCGAAGCAAACTGAGC A | ID1 | 1994.9 | 1 | |||
| ID2 | 3952.5 | 1.9 | |||||
| ID3 | 951.8 | 0.4 | |||||
| 3 | Cytochrome P-450 (cytp450) | SW3 F | AAGAGTCGGCTTACGAGCTG | 110 | D1 | 39.6 | 1 |
| D2 | 41.8 | 1 | |||||
| D3 | 81.1 | 2 | |||||
| SW3 R | CTTGGGGCTGAAGAGATGG G | ID1 | 73.9 | 1 | |||
| ID2 | 26.9 | 0.3 | |||||
| ID3 | 34.5 | 0.4 | |||||
| 4 | ATP Binding Cassette Transporter proteins (abct) | SW4 F | GGATGAGCCAACTTCAGGCT | 82 | D1 | 407.7 | 1 |
| D2 | 327.2 | 0.8 | |||||
| D3 | 2348.2 | 5.7 | |||||
| SW4 R | TGCTAGGCTGGTGTATGGTG | ID1 | 304.1 | 1 | |||
| ID2 | 674.1 | 2.2 | |||||
| ID3 | 337 | 1.1 | |||||
| 5 | Serine Threonine Phosphatas e (stp) | SW6 F | CACACCGTGGTTGATGGCT | 150 | D1 | 15749091 | 1 |
| D2 | 14435999 | 0.9 | |||||
| D3 | 5599633 | 0.3 | |||||
| SW6 R | TGAACGTGACCGGCAAAAA C | ID1 | 13914516 | 1 | |||
| ID2 | 15238483 | 1 | |||||
| ID3 | ND | ND |
Table 4: List of genes in callus development and shoot development (from Arabidopsis database) used for the gene expression profi
Table 4: List of genes in callus development and shoot development (from Arabidopsis database) used for the gene expression profiling in micropropagation of S. album. ND – not detected DNA/RNA extraction, cDNA synthesis: Total DNA was extracted from the sandalwood leaf tissue using the method described by Doyle and Doyle (1990). The quantity and purity (A260/A280 ratio) of DNA were measured in Nanodrop N.D.1000 (Thermo Scientific, U.S.A.). The DNA samples were diluted to 20ng/µl with TE buffer and stored at 4°C. For direct organogenesis, the leaf samples were collected from inoculated leaf, proliferated leaf, and shoot formation stage and were labeled as D1, D2, and D3, respectively while for indirect pathway the samples were collected from inoculated leaf, proliferated leaf, and callus formation stage and were labeled as ID1, ID2, ID3, respectively. The various direct and indirect stages are shown in figure 1. RNA extraction was carried out from the samples collected from the different stages of organogenesis using the method described by Ghawana, et al. [13] with minor modification. The quantity and quality (A260/A280 ratio) of RNA were determined in Nanodrop N.D.1000 (Thermo Scientific, U.S.A.). DNase treatment was given to all the samples using DNase I (Thermo Scientific) to avoid any DNA contamination. Preparation of cDNA from total RNA was carried out using a first-strand cDNA synthesis kit (Takara, Japan) as per the manufacturer’s instructions.
![Figure 1: RNA extraction was carried out from the samples collected from the different stages of organogenesis using the method described by Ghawana, et al. [13] with minor modification. The quantity and quality (A260/A280 ratio) of RNA were determined in Nanodrop N.D.1000 (Thermo Scientific, U.S.A.). DNase treatment was given to all the samples using DNase I (Thermo Scientific) to avoid any DNA contamination. Preparation of cDNA from total RNA was carried out using a first-strand cDNA synthesis kit (Takara, Japan) as per the manufacturer’s instructions.](/fulltextimages/8609/fig_1.png)
Primer screening through end-point PCR and validation: Primer screening was carried out with the DNA extracted from sandalwood tissues of different stages. RAPD amplification was performed in a 25 µl reaction system containing 100 ng DNA, 1x DreamTaq Green PCR buffer with 2 mM MgCl2 (Thermo Fisher Scientific, U.S.A.), 0.2 mM each of dNTPs (Thermo Fisher Scientific, U.S.A.), 0.5 U Taq DNA polymerase (Kapa Biosystems, U.S.A.), 4 pmol of forward and reverse primers (SW1, SW2, SW3, SW4, SW5 and SW6) and sterile distilled water. Amplification was automated using a PCR machine (Applied Biosystems, USA). The PCR cycles involved an initial denaturation step at 94 °C for 5 minutes followed by 35 cycles of denaturation at 94 °C for 1 minute, annealing at 60 °C for 30 seconds, extension at 72 °C for 1 minute and final extension at 72 °C for 5 minute. Agarose gel (1.5 %) was prepared in 1x TBE buffer to separate the amplified products. Gel documentation system (Alpha Innotech, USA) was used for visualization of amplified DNA fragments. Genes that did not amplify were eliminated and not considered for further downstream application. The screened primers were then validated with the cDNA of all samples to determine the genes expressed during organogenesis qualitatively. Each primer pair was amplified with all the samples along with an NTC (No template Control) to decipher the intensity of primer dimmers or DNA contamination. The primer pairs were selected on the basis of presence of specific and expected sized band in gel analysis. These primers were used for absolute quantification in Real Time PCR. Absolute quantification: The preparation of standard curve of each gene was carried out by purifying and quantitating the PCR product for each gene. Standards for all the genes were ranged from 109 to 101 copies per µl with each step differing by 10-fold. Using these standards and cDNA samples, absolute quantification was done in 7500 Fast Real Time PCR (Applied Biosystems, USA). SYBR Green chemistry was used for real time PCR reaction. Cycling conditions involved an initial denaturation at 94˚C for 5 minutes and 40 cycles of amplification at 94˚C for 10 seconds followed by 60˚C
for 30 seconds. Standard curve was prepared for each gene using Cq values and initial copy number of the transcript. Concentrations of unknown samples were determined using the data generated from the plot. Sample transcript copy number was calculated using the equation obtained from the graph. Moreover, considering the inoculated stage leaf (both D1 and ID1) as control, their transcript copy numbers were designated as 1.0 and corresponding relative numbers were given to other treatments.
Results and Discussion
The present study used in vitro leaf tissue for direct as well as indirect organogenesis. The detailed consequences of the direct and indirect organogenesis and in vitro expression profiling of the various genes have been described here and elucidated through tables and figures.
Organogenesis
In attempts towards direct organogenesis, the relationship between gradient levels of BAP and NAA and the morphogenic potential of plantlets were found out which could give best establishment and multiplication rates. The percentage establishment and growth of cultures was highest in the establishment phase. After 40 days of incubation, treatment SD14 (2 mgl-1 BAP and 0.4 mgl-1 NAA) generated a sprouting frequency of 40%. Treatment, SD14 and SD15 signified as the best health representative among all treatments with score (++++). Following SD14, SD15 showed second highest sprouting frequency (30%). Remaining treatments demonstrated poor health with little necrotizing growth. In the proliferating phase, after 80 days, SD14 (2.0 mgl-1 BAP and 0.4 mgl-1 NAA) recurred as the best media in terms of the various observations recorded e.g. bud sprouting frequency, number of shoots and length of shoots were 60%, 3 and 2 cm, respectively, highest among the other treatments. Subsequently, SD7 was listed as the next good media with 52.50% bud sprouting frequency and had an excellent shoot health (++++). Even after 120 days, SD14 continued to give highest proliferation. The sprouting frequency has increased to 70% which was 40% earlier and number of shoots have increased to five. Treatments SD14 and SD7 came up with potential numbers of shoots formation per explant (five) after 120 days but considering the overall efficient health SD14 dominated over SD7. These observational analyses were in correlation with the report by Singh, et al. [3] where they used WPM supplemented with 2.5 mgl-1 BAP and 0.2 mgl-
1 NAA and obtained a bud frequency of 79.16%, whereas incongruent with results of Mujib [5] who reported the BAP concentration as low as 0.5 mgl-1 without incorporating NAA. Greenish shoot bud formation in all the treatments in the present study might have been observed due to low auxin:cytokinin ratio as explained by the work of Behbahani, et al. [14] and Singh, et al. [3]. The detailed results are presented in Supplementary Table 1. Among all treatments tested, SI24 (2.5 mgl-1 2,4-D) followed by the treatment SI18 (3 mgl-1 2,4-D and 1 mgl-1 glycine and 25 mgl-1 ADS) and SI33 (1 mgl-1 BAP and 0.5 mgl-1 2,4-D) reflected as the best treatments for achieving early callus induction response after 40 days. This finding is in accordance with the results of Adesoye and Orkpeh [15] and Behbahani, et al. [14] who also favored WPM over MS. Rashmi and Trivedi [16] postulated that 2,4-D may have encouraged the synthesis of endogenous purines and cytokinins ultimately resulting in higher rates of cell division. The days to callus induction ranged from 35 to 37 days while the callus induction % ranged from 10% to 50%. After 80 days, the callusing reached maximum in treatment, SI24 (2.5 mgl-1 2,4-D) which generated callus induction and frequency percent of 70% and 50%, respectively. The callus looked very healthy with green in colour and friable in nature. Tissue morphologies ranged from white, translucent and watery in appearance to green, opaque and compact. A few emerging propagules were observed as indicative of shoot regeneration in treatment SI33 (1 mgl-1 BAP and 0.5 mgl-
1 2,4-D) after 120 days. It generated callus induction percent of 87.50% and callus regeneration frequency percent of 75%. Any change in the concentrations of growth regulators resulted in change in morphology and growth of the callus developmental pattern. Apart from control, treatments SI2, SI3, SI4, SI23, SI26, SI27, SI28, SI29, SI30, SI31, SI32, SI34 and SI36 also failed to show any proliferation even after 120 days. The detailed results are presented in Supplementary Table 2.
Gene Expression Studies
Upon screening of gene specific primers with cDNA, synthesized from RNA extracted from various stages of sandalwood organogenesis, produced single product not exceeding 150 bp on 1.5% agarose gel. The primers of genes which amplified the cDNA samples were Alternative oxidases, Cytochrome P-450, Late Embryogenesis Abundant, ABC transporter, and serine-threonine phosphatase and their product lengths recorded were 90 bp, 82 bp, 149 bp, 150 bp, and 113 bp, respectively. The absolute quantification was performed for all mentioned primers in the real time PCR. Absolute quantification of each gene was carried out using standard curve as prepared from the graph of Cq values versus copy number through which absolute copy number was calculated and converted into relative quantity value taking leaf inoculated sample (for both direct and indirect organogenesis) as control (Table 1, Figures 2,3).
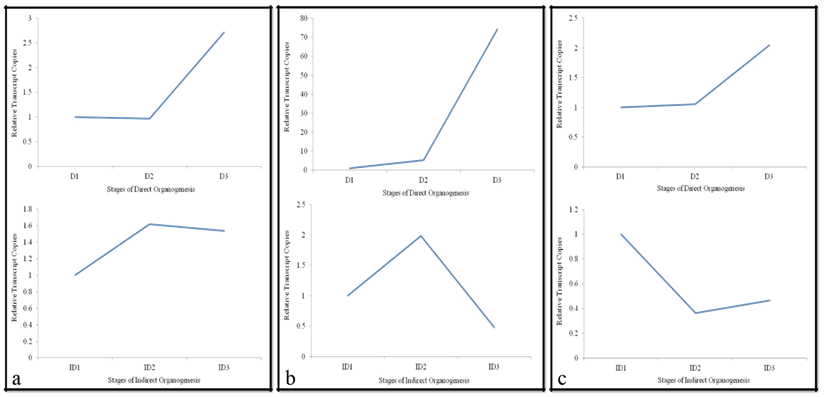
Alternative Oxidase (AO)
Alternative oxidase (AO) are ubiquitous in all plants which play role in stress response, in addition, major contribution in regulating cellular thermodynamic responses by alteration of radicals [17]. Relative gene expression pattern of ao observed during direct and indirect organogenesis in the present study is depicted in Figure 2a. During direct organogenesis, gene expression remained nearly consistent in terms of copy number from inoculated leaf to proliferated leaf, this can be amenable with the report by Millenaar and Lambers [18] where the excess production of reactive oxygen species free radicals were controlled by ao by continuing the citric acid cycle and regulating mitochondrial ubiquitin pool.
Indirect organogenesis expression was regarded as stress response induced by different doses of 2,4-D growth regulator forming the unorganized mass called callus or in response to various stimuli [19, 20]. During indirect organogenesis, rise in expression was visualized from inoculated leaf to leaf proliferation stage which stated that alternative oxidase capacity for the storage of carbohydrates may have increased as mentioned by Steingrover [21], or when a higher concentration of vacuolar solutes was demanded for osmotic balance [22]. Linus, et al. [23] stated functions of ao were flexible as a reserve electron transport capacity in callus in which cytochrome pathway activity was impaired. Further, expression remained consistent on flip to callus induction phase. Noteworthy point was that the next stages of shoot formation through indirect organogenesis showed reduction in transcript level as ao and decreased activity as soon as the excess of sugar could be used in metabolism as illustrated by Lambers [24]. The strong interpretation for this disproportionate curves represented ao can be argument as per Fiorani [25] who stated that ao set the defense equilibrium or threshold in plants cells, in the absence of which plants showed irregularity in growth pattern and responded abruptly to stress as noticed in indirect organogenesis under stress condition induced by 2, 4-D.
Late Embryogenesis Abundant (LEA)
Late embryogenesis abundant (lea) are low molecular weight (10–30 kDa) proteins which mainly involved in protecting higher plants from damage caused by environmental stresses, especially drought (dehydration). The expression of lea gene had increased from 1.0 (inoculated leaf stage) to 5.2-fold (proliferated one) and sudden up-regulation (74.2-fold) was observed at shoot formation stage during direct organogenesis. However, in case of indirect organogenesis its expression reached its peak from 1.0 (leaf inoculation) to 1.9 (leaf proliferation stage) followed by sharp decline (0.4) at callus formation stage (Figure 2b). Looking at the fold change value of lea during direct and indirect organogenesis, the level of expression increased to 2-3 fold, from inoculated leaf to proliferated leaf stage but at the time of shoot formation/Callusing, the value increased to 70 fold higher and to approximately half during direct and indirect organogenesis, respectively. Such expression pattern of lea observed during indirect organogenesis hinted its dedication towards differentiated tissue rather than undifferentiated one. For survival, higher plants acclimatize themselves to changing environment through various mechanisms involved at different levels. The present report also deduced the same coherent results which stated that due to stress in shooting stage of direct organogenesis, the expression of LEA had been significantly higher due to high signal transduction but during callusing in indirect pathway the stress response was negligible and therefore the low transcript profiling was detected. Gao and Lan (2016) reported late embryogenesis abundant (LEA) proteins as a large and highly diverse gene family in pines that played a vital role not only in various stress tolerance responses but also crucial during embryonic development which was evident during direct organogenesis where the transcript copy number was very high from inoculated leaf to leaf proliferation stage subsequently passing on to shoot formation in response to stresses throughout the plant kingdom that supported the direct organogenesis event at each level whereas referring to the analysis during indirect organogenesis the expression declined at callus levels as compared to normal developmental levels.
Cytochrome p-450 (cyt-p450)
To flourish the scope of analysis and deeper insight about organogenesis events, expression pattern of Cytochrome P-450 was included. Like ao, cyt-p450 showed very minute change in expression during first two stages of direct organogenesis and then doubled at shoot formation stage while in case of indirect organogenesis continuous down- regulation was observed for the subsequent developmental stages (Figure 2c). The double number of transcripts at shoots formation stage in direct organogenesis pathway might have been obtained due to regulation of auxin biosynthesis by cytochrome p450 family proteins which ultimately affected the growth and development of the plant as explained by Bak and Feyereisen [26] and Vadassery, et al. [27] in Arabidopsis plant. Further, the cytochrome p-450 and alternative oxidases pathways were interlinked and differed reciprocally highlighting the simultaneous decrease in cytochrome p-450 with ascending alternative oxidases expression during indirect organogenesis which was in account of studies by Bahr and Bonner [28] and Theologis and Laties [29].
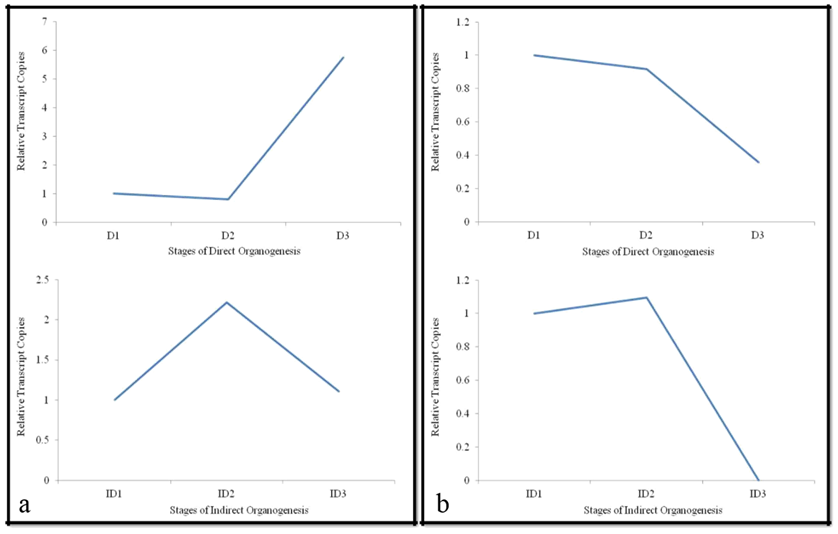
ATP Binding Cassette Transporter Proteins (ABCT)
To make the biological regulation factual, abct were analyzed which revealed the down regulation during direct organogenesis from inoculated leaf to leaf proliferation. However, almost six fold up regulation was observed at shoot formation stage. This finding clearly indicated that as the plant attained maturity, the transcript level had risen. Gaedeke, et al. [30] also postulated that abct is involved in stomata formation and expressed mainly in vascular bundles, epidermis especially in guard cells. It also works as auxin conjugate transporters that regulate auxin as well as ion channels. However, in case of callus mediated organogenesis two fold increase was observed during leaf proliferation stage and the level reached to its ground state, near to control, afterwards (Figure 3a). Kang, et al. (2011), while working on Arabidopsis, also obtained similar expression patterns and admitted that they are involved in detoxification processes, later shown to be necessary for organ growth, plant nutrition, plant development.
In agreement with the supporting literatures [31, 32, 33], our analysis revealed a sharp up regulation at shoot formation stage during direct organogenesis contributed to the fact that plant at this stage require more ion transport, has high detoxification rate, and performs frequent stomata activity resulting in intense increase in abct transcript level. Furthermore, the decline in abct level at callus induction stages in indirect pathway revealed that the rate of stomata activity might have declined and as a result cell growth rate was affected as compared to normal. In conclusion, our curiosity led to prediction of abct proteins regulation successfully which clearly differentiated the direct and indirect organogenesis event, visually contradict expression pattern at different pathway.
Serine Threonine Phosphatase (STP)
Serine/threonine protein phosphatases plays critical role in the regulation of cell cycle. In the present study constant down regulation of stp was observed during both direct and indirect pathways (Figure 3b). The continuous decline in expression during direct organogenesis might be due to the ability of okadaic acid to activate other transcription factors which caused alteration in protein serine/threonine resulting in dephosphorylation as explained by Mumby and G. Walter [34]. Whilst, during indirect organogenesis, the transcript copy number did not change initially but sharply delineated to zero at callusing stage which marked the central role of protein serine/threonine phosphatase in the re-entry of quiescent cells into the cell cycle. This re-entry suggested the dedifferentiated phase of callus that may trigger the cell for redifferentiation resulting in increase in the mRNA level initially which further did not show any expression pattern as described by Villafranca [35]. The available information on the specific functions of different forms of protein serine/ threonine phosphatases is still severely limited as mentioned by Mumby and Walter [34].
From the above results and discussions, we anticipate the gene expression in combinations of gene markers as the pivotal character that untangle the intricate network to fall on exact stage identification of sandalwood. Indeed, the combinations of gene expression seem more informative, comprehensive and accurate for stage identification. To widen our understanding about molecular aspects indeed require the knowledge about quantitative character controlled by many genes and impact by a large number of environmental, anatomical, physiological, biophysical, biochemical and developmental factors.
Conclusion
To conclude in brief, out of five genes used to obtain gene expression patterns, ao, cyt-p450 and stp showed little/ no change in transcript copy number during initial two stages while two of these genes ao and cyt-p450 showed up-regulation and stp showed down-regulation in direct pathway. Expression patterns of lea and abct showed strong molecular signature to predict the route of the organogenesis in sandalwood micropropagation as they were constantly up regulated during direct organogenesis and down regulated during indirect organogenesis. Thus the objective of the present investigation had come to the fulfillment with the help of dynamic expression patterns of lea and abct during initial stages of organogenesis and it is now clear that one can predict the fate of explant.
References
-
Subasinghe SMCUP (2013) Sandalwood research: a global perspective. Journal of Tropical Forestry and Environment 3(1): 1-8.
-
Kumar AA, Joshi G, Ram HM (2012) Sandalwood: history, uses, present status and the future. Curr Sci 25: 1408- 1416.
-
Singh CK, Raj SR, Patil VR, Jaiswal PS, Subhash N (2013) Plant regeneration from leaf explants of mature sandalwood (Santalum album L.) trees under in vitro conditions. In Vitro Cell Develop Biol Plant 49(2): 216- 222.
-
Rugkhla A, Jones MGK (1998) Somatic embryogenesis and plantlet formation in Santalum album and S. spicatum. J Exp Bot 49(320): 563-571.
-
Mujib A (2005) In vitro regeneration of sandal (Santalum album L.) from leaves. Turk J Bot 29(1): 63-67.
-
Thorpe TA (1990) Organogenesis: Structural, Physiological and Biochemical Aspects. In: Rodríguez R, Tamés RS, Durzan DJ (Eds.), Plant Aging. NATO ASI Series (Series A: Life Sciences), Springer, Boston, MA 186: 191- 197.
-
Jain SM, Minocha SC (2000) Molecular biology of woody plants. 1st (Vol.). Springer, Netherlands
-
Freeman TC, Lee K, Richardson PJ (1999) Analysis of gene expression in single cells. Curr Opin Biotech 10(6): 579-582.
-
Steuerwald N, Cohen JJ, Herrera R, Brenner C (1999) Analysis of gene expression in single oocytes and embryos by real-time rapid cycle fluorescence monitored RT–PCR. Mol Hum Reprod 5(11): 1034-1039.
-
Mackay IM, Arden KE, Nitsche A (2002) Real-time PCR in virology. Nucleic Acids Res 30(6): 1292-1305.
-
Lloyd G, McCown B (1980) Commercially-feasible micropropagation of mountain laurel, Kalmia latifolia, by use of shoot-tip culture. Commercially-feasible micropropagation of mountain laurel, Kalmia latifolia, by use of shoot-tip culture 30: 421-427.
-
Che P, Lall S, Nettleton D, Howell SH (2006) Gene expression programs during shoot, root, and callus development in Arabidopsis tissue culture. Pl Physiol 141(2): 620-637.
-
Ghawana S, Paul A, Kumar H, Kumar A, Singh H, et al. (2011) An RNA isolation system for plant tissues rich in secondary metabolites. BMC Res Notes 4(1): 1-5.
-
Behbahani M, Shanehsazzadeh M, Hessami MJ (2011) Optimization of callus and cell suspension cultures of Barringtonia racemosa (Lecythidaceae family) for lycopene production. Scientia Agricola 68(1): 69-76.
-
Adesoye A, Orkpeh U (2009) Effect of plant growth regulator, light and media formulation on initiation and growth of Parkia biglobosa (Jacq.) R. Br. Ex Don callus cultures from cotyledons and mature zygotic embryos. Nigerian Journal of Horticultural Science 14(1): 67-75.
-
Rashmi R, Trivedi MP (2014) Effect of various growth hormone concentration and combination on callus induction, nature of callus and callogenic response of Nerium odorum. Appl Biochem Biotechnol 172(5): 2562- 2570.
-
Van Aken O, Giraud E, Clifton R, Whelan J (2009) Alternative oxidase: a target and regulator of stress responses. Physiol Plant 137(4): 354-361.
-
Millenaar FF, Lambers H (2003) The alternative oxidase: in vivo regulation and function. Plant Biol 5(1): 2-15.
-
Ikeuchi M, Sugimoto K Iwase A (2013) Plant callus: mechanisms of induction and repression. The Plant Cell 25(9): 3159-3173.
-
Tahir SM, Victor K, Abdulkadir S (2011) The effect of 2, 4-Dichlorophenoxy acetic acid (2, 4-D) concentration on callus induction in sugarcane (Saccharum officinarum). Nigerian Journal of Basic and Applied Sciences 19(2): 213-217.
-
Steingrover E (1981) The relationship between cyanide- resistant root respiration and the storage of sugars in the taproot in Daucus carota L. J Exp Bot 32(5): 3911-919.
-
Lambers H, Blacquière T, Stuiver B (1981) Interactions between osmoregulation and the alternative respiratory pathway in Plantago coronopus as affected by salinity. Physiol Plant 51(1): 63-68.
-
Linus HW, Wagner MJ (1983) Regulation of the activity of the alternative oxidase in callus forming discs from potato tubers. Physiol Plant 58(3): 311-317.
-
Lambers H (1980) The physiological significance of cyanide‐resistant respiration in higher plants. Plant Cell Environ 3(5): 293-302.
-
Fiorani F, Umbach AL, Siedow JN (2005) The alternative oxidase of plant mitochondria is involved in the acclimation of shoot growth at low temperature. A study of Arabidopsis AOX1a transgenic plants. Pl Physiol 139(4): 1795-1805.
-
Bak S, Feyereisen R (2001) The involvement of two P450 enzymes, CYP83B1 and CYP83A1, in auxin homeostasis and glucosinolate biosynthesis. Pl Physiol 127(1): 108- 118.
-
Vadassery J, Ritter C, Venus Y, Camehl I, Varma A, et al. (2008) The role of auxins and cytokinins in the mutualistic interaction between Arabidopsis and Piriformospora indica. Mol Plant Microb Interact 21(10): 1371-1383.
-
Bahr JT, Bonner WD (1973) Cyanide-insensitive respiration II. Control of the alternate pathway. J Biol Chem 248(10): 3446-3450.
-
Theologis A, Laties GG (1978) Cyanide-resistant respiration in fresh and aged sweet potato slices. Pl Physiol 62(2): 243-248.
-
Gaedeke N, Klein M, Kolukisaoglu U, Forestier C, Müller A, et al. (2001) The Arabidopsis thaliana ABC transporter AtMRP5 controls root development and stomata movement. EMBO J 20(8): 1875-1887.
-
Rea PA (2007) Plant ATP-binding cassette transporters. Annu Rev Plant Biol 58: 347-375.
-
Schulz B, Kolukisaoglu HU (2006) Genomics of plant ABC transporters: the alphabet of photosynthetic life forms or just holes in membranes?. FEBS Letters 580(4): 1010- 1016.
-
Theodoulou FL (2000) Plant ABC transporters. Biochimica et Biophysica Acta (BBA)-Biomembranes 1465(1-2): 79- 103.
-
Mumby MC, Walter G (1993) Protein serine/threonine phosphatases: structure, regulation, and functions in cell growth. Physiol Rev 73(4): 673-699.
-
Lambers H, Atkin OK, Millenaar FF (1996) Respiratory patterns in roots in relation to their functioning. 3rd (Edn.), In: Waisel Y, Eshel A, Kafkaki U (Eds.), Plant roots. The hidden half. Marcel Dekker Inc., New York, pp: 521- 552.
- Enhancement of Vegetative Growth and Fruit Yield in Cucumber (Cucumis sativus L.) via Spiritual Blessing (Biofield) Energy Intervention
- Production of Açaí (Euterpe oleracea Mart.) under Different Agroforestry System Management Intensities in Amazonian Floodplain (Varzea) Forests
- Coffee and the Production Region: What is the Secret to the Expression "Quality"?
- Experiential Agripreneurship Training in Sub-Saharan Africa: Integrating a Business Incubator into Postgraduate Livestock Education at the University of Buea
- Advances in Agricultural High-Quality Development
- Linking Compost Residue to ABAGE in Plants - a Short Note