Optimization of 4-Bac Extra Probiotics Dosage for Enhanced Productivity in Broiler Chickens Using a Quadratic Polynomial Response Model
This study aimed to determine the optimal dosage of 4-Bac Extra probiotics supplementation for broiler chickens using performance traits and a quadratic polynomial response model. A total of 180 Arbor Acre broiler chickens were randomly assigned to three treatment groups, replicated three times, representing 0% (T1), 0.25% (T2), and 0.50% (T3) probiotics supplementation. The birds were raised in a deep litter system and provided with ad libitum access to feed and water. During the starter phase, the 0.25% probiotics treatment group exhibited significantly higher feed intake and improved feed conversion ratio compared to the 0% and 0.50% groups. Additionally, the broilers in the 0.25% group showed significantly higher final body weight. However, the cost per kilogram of weight gain and cost of production were significantly higher in the 0.50% group compared to the 0% and 0.25% groups. Quadratic regression analysis revealed significant relationships between feed intake and probiotics dosage, as well as the week of production. The optimal feed intake, probiotics dosage, and week of production were determined to be 260g/week, 0.024g/day, and 7 weeks, respectively. In conclusion, the optimum dosage of 4-Bac Extra probiotics supplementation for broiler chickens is 0.024g per day for optimal performance characteristics. This study provides valuable insights into improving broiler chicken productivity and cost efficiency through optimized probiotics supplementation.
Introduction
Poultry meat and eggs are essential sources of affordable protein for people worldwide. The poultry industry has experienced significant technological advancements to meet the demands of urbanization and population growth. However, feed costs account for a substantial portion of the production expenses of monogastric animals, ranging from
60-80% in developing countries and 50-65% in developed countries [1].
Challenges such as low cereal and oilseed production, limited processing capacity, drought, and competition from direct human consumption have contributed to the high cost of feed. Consequently, many poultry farms, especially small to medium-scale operations, have been forced to shut down, resulting in a decline in livestock production [2]. Finding efficient ways to optimize the utilization of both conventional and unconventional feed resources has become crucial for poultry farmers and researchers alike [3].
The use of probiotic supplementation in the poultry industry has gained prominence as a means to enhance productivity and reduce disease burden [4]. However, the cost-effectiveness of probiotic usage is a critical consideration. Therefore, there is a need to develop methods that link nutrition to production cost and optimize feeding strategies and nutrient utilization [5].
Several models and statistical methods, such as multiple- range tests and broken-line (linear ascending) models, have been commonly used to estimate nutritional requirements based on feeding trials involving various amounts of critical nutrients [6, 7]. While it has been established that multiple nonlinear models can effectively estimate nutritional response data, there is a lack of a model that accounts for the optimum cost implication of using critical nutrients, such as probiotic additives, in the poultry industry [6].
Therefore, the objective of this study is to determine the optimum dosage of 4-Bac Extra probiotic supplementation for Arbor Acre broiler chickens using a quadratic polynomial response model. This model considers both growth performance and cost implications to identify the most effective dosage for enhancing the growth performance of broiler chickens.
Materials and Methods
Experimental Site
The experiment was conducted at the research and training farm of the Faculty of Agriculture, Nasarawa State University, Keffi Shabu-Lafia campus, situated in the Guinea savannah zone of south-central Nigeria. The geographic coordinates of the site are latitude 08°35’1’’ N and longitude 08°33’0’’ E. The mean monthly maximum and minimum temperatures were recorded at 35.0°C, and the mean monthly relative humidity was 74%. The average monthly rainfall was approximately 168.9mm [8].
Source of Feed Ingredients
Maize grain was procured from the Doma market, while groundnut cake, premix, methionine, lysine, limestone, and bone meal were obtained from suppliers in Jos Plateau State. Additionally, 4-Bac Extra (probiotics) was purchased from Mid-Century Agro-Allied Venture Limited, Lagos, and Lagos State.
Experimental Design and Bird Management
A total of one hundred and eighty (180) Arbor Acre day-old chicks were acquired from a commercial hatchery. The chicks were divided into three treatment groups, each comprising sixty chicks, and were randomly assigned to three different diets using a completely randomized design (CRD). Each group was further subdivided into three replicates, with twenty chicks per replicate. The chicks were individually weighed and placed into the designated experimental pens. The birds were housed in deep litter pens, and all routine management operations and vaccinations were administered. Feed and water were provided ad libitum, and data were collected from the first day to the fifty-sixth day of the experiment.
Data Collection
Chemical Analysis: The feed samples were analyzed for their proximate composition following the A.O.A.C (2000) method.
Growth Performance Evaluation: Daily feed intake was determined by weighing the feed given and subtracting the remaining quantity the following day (i.e., after 24 hours). Weekly weight gain was calculated by taking the difference between the final weight and the initial weight of the birds per week. The feed conversion ratio was computed as the ratio of average weekly feed intake to average weekly weight gain. Survival percentage was calculated as the number of animals that survived divided by the total number of animals at the beginning of the study, multiplied by 100. The performance index was calculated as the product of survival multiplied by weight gain, multiplied by 100, and divided by the feed conversion ratio. The cost of production per bird (₦) was determined as the total cost of feed, cost of the bird, and other expenses incurred per bird.
Statistical Analysis
Analysis of Variance (ANOVA) was performed on the growth performance data to compare each treatment with the others. In cases of significant differences, Duncan’s multiple range test (DMRT) was applied to separate the means. Additionally, linear and quadratic regression analyses were used to establish the relationship between probiotic supplementation and growth performance parameters.
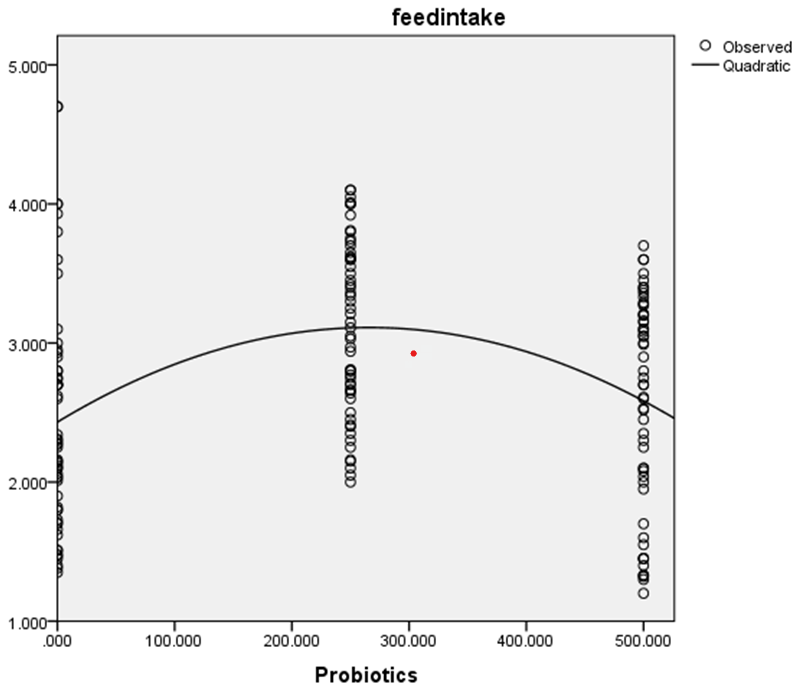
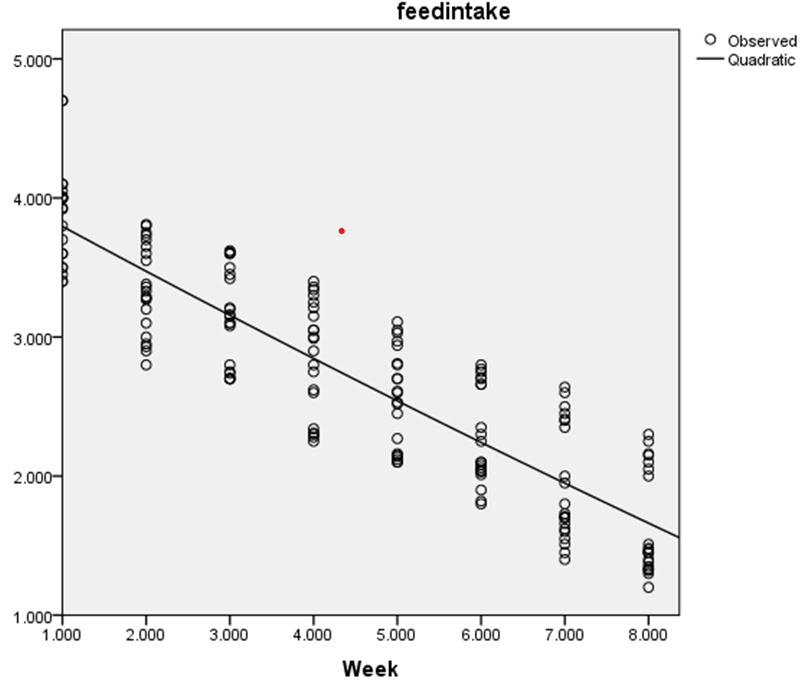
Anova Model: Anova Model: yij = μ + Ai + eij where yij represents an individual observation for each growth performance characteristic, μ is the general mean, Ai is the effect of the ith probiotic supplementation (0, 0.25, and 0.50%), and eij is the random error associated with each observation. The quadratic function model was: Quadratic model: Y = b0 + b1X + b2X2 + e Where Y represents growth performance characteristics, b0 is the intercept, X is the probiotic supplementation, b1 and b2 are regression coefficients, and e is the error term. The slope of the quadratic regression plots (y’ = dy/dx = 0) was used to determine the optimum age (week) for growth performance characteristics and probiotic supplementation (g), as described by Dağdemir, et al. (Tables 1 & 2) and (Figures 1 & 2).
| Ingredients | T1 | T2 | T3 | |
|---|---|---|---|---|
| Maize | 32 | 32 | 32 | |
| Maize bran | 10 | 10 | 10 | |
| Rice bran | 3.5 | 3.5 | 3.5 | |
| Sorghum | 10 | 10 | 10 | |
| Cassava | 2.5 | 2.5 | 2.5 | |
| Fish meal | 5 | 5 | 5 | |
| GNC | 22 | 22 | 22 | |
| Soy bean meal | 10.29 | 10.29 | 10.29 | |
| Soy bean oil | 2.5 | 2.5 | 2.5 | |
| Aflatoxin binder | 0.01 | 0.01 | 0.01 | |
| Methionine | 0.1 | 0.1 | 0.1 | |
| Lysine | 0.1 | 0.1 | 0.1 | |
| Limestone | 1.5 | 1.5 | 1.5 | |
| Salt | 0.25 | 0.25 | 0.25 | |
| Premix | 0.25 | 0.25 | 0.25 | |
| Total | 100 | 100 | 100 | |
| Supplements | ||||
| Probiotic | - | 0.25 | 0.5 | |
| CP | 21.49 | 21.52 | 21.55 | 21.91 |
| ME | 2969.56 | 2969.56 | 2969.56 | 3018.28 |
| Lys | 1.03 | 1.03 | 1.03 | 1.03 |
| Meth | 0.45 | 0.45 | 0.45 | 0.45 |
| EE | 7.2 | 7.2 | 7.21 | 7.26 |
| Cf | 5.18 | 5.19 | 5.19 | 5.25 |
| Ca | 0.94 | 0.94 | 0.94 | 0.94 |
| P | 0.54 | 0.56 | 0.56 | 0.56 |
Table 1: ** Composition of Experimental Diet of Broiler Starter Containing Varied Level of Probiotics/kg.
Probiotics: Tocopherol, Lactobacillus acidophilus 45,000, million ctu live cultures of saccharomyces cerevisiae SC-47 125, 000 million cfu; GNC= Groundnut Cake. Premix per kg diet: vitamin A, 5484 IU; vitamin D3, 2643 ICU; vitamin E, 11 IU; menadione sodium bisulfie, 4.38 mg; riboflavin, 5.49 mg; d-pantothenic acid, 11 mg; niacin, 44.1 mg; choline chloride, 771 mg; vitamin B12, 13.2 ug; biotin, 55.2 ug; thiamine mononitrate, 2.2 mg; folic acid, 990 ug; pyridoxine hydrochloride, 3.3 mg; I, 1.11 mg; Mn, 66.06 mg; Cu, 4.44 mg; Fe, 44.1 mg; Zn, 44.1 mg; Se, 300 ug; T1= 0% probiotic; T2 = 0.25% probiotic T3= 0.50% probiotic. Table 1: Composition of Experimental Diet of Broiler Starter Containing Varied Level of Probiotics/kg.
| Ingredients | Trt 1 | Trt 2 | Trt 3 | |
|---|---|---|---|---|
| Maize | 35.79 | 35.79 | 35.79 | |
| Maize bran | 10 | 10 | 10 | |
| Rice bran | 3.5 | 3.5 | 3.5 | |
| Sorghum | 10 | 10 | 10 | |
| Cassava | 2.5 | 2.5 | 2.5 | |
| Fish meal | 5 | 5 | 5 | |
| GNC | 20 | 20 | 20 | |
| Soybean meal | 8 | 8 | 8 | |
| Soybean oil | 3 | 3 | 3 | |
| Aflatoxin binder | 0.01 | 0.01 | 0.01 | |
| Methionine | 0.1 | 0.1 | 0.1 | |
| Lysine | 0.1 | 0.1 | 0.1 | |
| Limestone | 1.5 | 1.5 | 1.5 | |
| Salt | 0.25 | 0.25 | 0.25 | |
| Premix | 0.25 | 0.25 | 0.25 | |
| Total | 100 | 100 | 100 | |
| Supplements | ||||
| Probiotic | - | 0.25 | 0.5 | |
| CP | 20.46 | 20.07 | 20.1 | 20.46 |
| ME | 3089.85 | 3041.13 | 3041.13 | 3089.85 |
| Lys | 0.95 | 0.95 | 0.95 | 0.95 |
| Meth | 0.44 | 0.44 | 0.44 | 0.44 |
| EE | 7.63 | 7.64 | 7.65 | 7.69 |
| Cf | 4.92 | 4.93 | 4.93 | 4.99 |
| Ca | 0.93 | 0.93 | 0.93 | 0.93 |
| P | 0.54 | 0.54 | 0.54 | 0.54 |
Table 2: ** Composition of Experimental Diet of Broiler Finisher Containing Varied Level of Probiotics/kg.
Probiotics: Tocopherol, Lactobacillus acidophilus 45,000, million ctu live cultures of saccharomyces cerevisiae SC-47 125, 000 million ctu, GNC= Groundnut Cake. Premix per kg diet: vitamin A, 5484 IU; vitamin D3, 2643 ICU; vitamin E, 11 IU; menadione sodium bisulfie, 4.38 mg; riboflavin, 5.49 mg; d-pantothenic acid, 11 mg; niacin, 44.1 mg; choline chloride, 771 mg; vitamin B12, 13.2 ug; biotin, 55.2 ug; thiamine mononitrate, 2.2 mg; folic acid, 990 ug; pyridoxine hydrochloride, 3.3 mg; I, 1.11 mg; Mn, 66.06 mg; Cu, 4.44 mg; Fe, 44.1 mg; Zn, 44.1 mg; Se, 300 ug. Table 2: Composition of Experimental Diet of Broiler Finisher Containing Varied Level of Probiotics/kg.
Results and Discussions
The effects of probiotic supplementation on the growth performance of Arbor Acre broiler starter and finisher chickens are presented in Tables 3 & 4, respectively. The results indicated significant (P < 0.05) effects of probiotic supplementation on final weight, weight gain, and feed conversion ratio. Specifically, supplementing with 0.25% probiotics led to a significant increase in final weight and weight gain, and a reduction in feed conversion ratio compared to the control groups. These findings are consistent with previous studies that have reported improved growth performance with probiotic supplementation [9]. However, the results did not align with the findings of Anukam NA, et al. [9] who observed increased feed intake in rats fed diets containing Lactobacillus strains. The discrepancy may be attributed to species-specific responses to probiotics and differences in diet composition (Tables 5-7; Figures 3 & 4).
| Final weight (g) | Initial weight(g) | Feed intake(g) | Weight gain(g) | FCR | |
|---|---|---|---|---|---|
| 0 | 1149.067b | 31.587 | 1992.8 | 1117.480b | 1.78a |
| 5% | 1275.900a | 31.914 | 1991.7 | 1243.986a | 1.60b |
| 10% | 1123.367b | 31.816 | 1996.8 | 1091.551b | 1.82a |
| SEM | 38.266 | 0.513 | 0.178 | 38.392 | 0.005 |
Table 3: Effect of Probiotics on Growth Performance of Broiler Starter Chickens.
ab = same superscript in the same column has no significant difference (p>0.05), *= Significant (P<0.05)at 1%, = Significant (P<0.05)at 5%. NS = No Significant Difference, SEM: Standard Error of means. Table 3: Effect of Probiotics on Growth Performance of Broiler Starter Chickens.
| Initial weight (g) | Final weight (g) | Weight gain (g) | Feed intake (g) | FCR | Survival (%) | Unit cost (#) | Performance index | |
|---|---|---|---|---|---|---|---|---|
| 0 | 1149.067b | 1436.334b | 77.3 | 148.65 | 1.983 | 71.778 | 190.047 | 92.88 |
| 5% | 127.900a | 1594.876a | 80.489 | 150.244 | 1.916 | 60.778 | 197.88 | 92.134 |
| 10% | 1123.367b | 1404.211b | 69.033 | 144.517 | 2.097 | 65.778 | 205.047 | 80.501 |
| SEM | 38.266 | 47.832 | 4.891 | 2.446 | 72 | 6.06 | 0 | 9.783 |
| LOS | ** | ** | NS | NS | NS | NS | NS | NS |
Table 4: Effect of Probiotics on Growth Performance of Broiler Finisher Chickens.
ab = same superscript in the same column has no significant difference (p>0.05), **= Significant (P<0.05)at 5%, NS = no significant difference, SEM: Standard Error of means. Table 4: Effect of Probiotics on Growth Performance of Broiler Finisher Chickens.
| Equation | Optimality | R2 | Adjusted R2 | Significance |
|---|---|---|---|---|
| Y = 2.432 + 0.005X-0.000009624X2 | 260g | 0.14 | 0.126 | ** |
| Y = 4.124-0.331W + 0.003W2 | 7wk | 0.79 | 0.785 | ** |
Table 5: Regression Functions of Feed Intake, Probiotics and Week of Production of Arbor Acre Chicken.
Y = feed intake; X = probiotics inclusion level; Wk = week of production, g = gram,** Significant at P<0.01 Table 5: Regression Functions of Feed Intake, Probiotics and Week of Production of Arbor Acre Chicken.
| Equation | Optimality | R2 | Adjusted R2 | Significance |
|---|---|---|---|---|
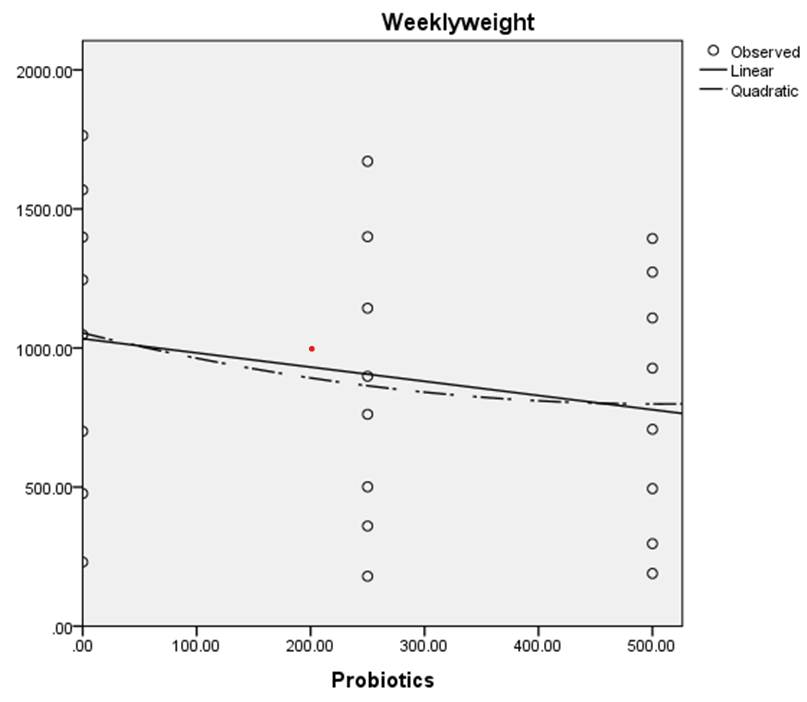
| Y = 1431.667-0.184X+0.001X2 | 92g | 0.046 | 0.003 | NS |
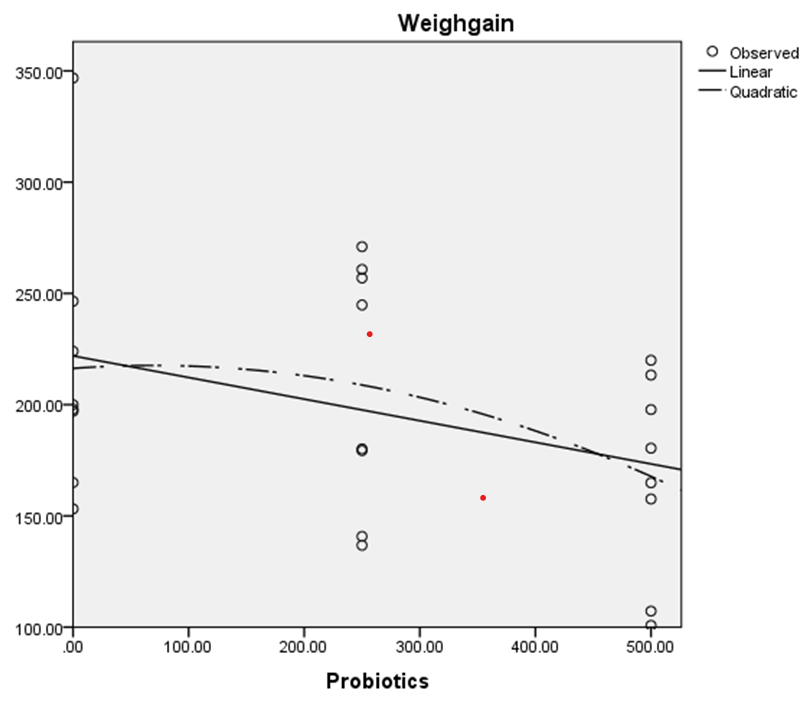
| Y = 269.375+0.024X + 0.00X2 i | 0.024g | 0.151 | 0.07 | NS |
| Y = 210.863+ 82.470W-11.125W2 i | 4wk | 0.06 | -0.03 | NS |
Table 6: Regression Functions of Weekly Body Weight, Body Weight Gain and Week of Production of Arbor Acre Chicken.
Y = weekly body weight; Yi= body weight gain; X = probiotics inclusion level; W = week of production, ns Not Significant. Table 6: Regression Functions of Weekly Body Weight, Body Weight Gain and Week of Production of Arbor Acre Chicken.
| Parameters | 1 | 2 | 3 | SEM | LOS |
|---|---|---|---|---|---|
| Total FI(Kg)/bird | 2.15 | 2.18 | 2.16 | 0.03 | NS |
| WG(Kg)/bird | 1.39a | 1.38a | 1.05b | 0.06 | ** |
| Cost of feed/Kg | 188.38c | 196.88b | 203.38a | 2.17 | ** |
| Cost per feed consumed(#) | 405.14b | 429.97a | 439.39a | 5.29 | ** |
| Cost of feed per unit weight gain | 292.46b | 313.46b | 420.19a | 20.69 | ** |
| Other cost | 100 | 100 | 100 | 0 | NS |
| Cost of production | 505.14c | 529.97a | 539.39a | 5.29 | ** |
| Revenue(N) | 950.48a | 925.36b | 902.36c | 7 | ** |
| Profit( N) | 445.34a | 395.39b | 362.97c | 12.08 | ** |
| Gross margin(%) | 46.85a | 42.73b | 40.22c | 0.98 | ** |
Table 7: ** Effect of 4-bac extra probiotics on Economics of Production of Arbor Acre Broiler Chickens. In contrast, the effects
ab= means on the same row bearing different superscript are significantly different (p<0.05); SEM= standard error of mean I USD to 750 N. Table 7: Effect of 4-bac extra probiotics on Economics of Production of Arbor Acre Broiler Chickens. In contrast, the effects of probiotic supplementation on the growth performance of Arbor Acre broiler finisher chickens showed a significant (P < 0.05) increase in final weight with 0.25% probiotic supplementation, while no significant effects were observed on weight gain, feed intake, feed conversion ratio, survival percentage, and performance index. These results are in line with the findings of Alonge, et al. [10], which indicated that probiotic supplementation had no significant effect on body weight gain and overall performance of broiler birds. However, the non-significant effects of probiotics on body weight gain may contrast with the findings of Kabir, et al. [11] suggesting that the variation in results could be attributed to environmental factors and overall diet composition.
Furthermore, the quadratic regression analysis revealed a significant relationship between probiotic inclusion and feed intake, as well as the week of production and feed intake. The optimal feed intake was determined to be 260g per week over a period of seven weeks. However, no significant relationship was observed between weekly body weight gain, probiotic inclusion, and the week of production. These results are consistent with the findings of Sekhon BS, et al. [12] and differ from previous studies that reported significant effects of probiotic supplementation and the week of production on weekly body weight gain [13, 14, 15].
The economic analysis of probiotic supplementation on the production of Arbor Acre broiler chickens indicated significant effects on weight gain, cost of feed, revenue, profit, and gross margin. Notably, the cost of production per unit of weight gain cost of feed consumed, and cost of production increased with higher levels of probiotic supplementation. This aligns with the costly nature of probiotics as an experimental test ingredient. These findings are consistent with previous studies that reported no effects of probiotics on the economics of the production of broiler chickens [16, 17]. However, the results of this study suggest that the economics of production tend to increase with higher levels of probiotic inclusion due to the expensive nature of probiotics as an experimental test ingredient, in agreement with the findings of Pillah [18].
References
-
Adegbola TA (1989) A study of Commercial Poultry Production in Anambra State. Journal of Animal Production Research 9(2): 61-67.
-
Ikani EI, Adesehinwa AOK (2000) Promoting non- conventional feedstuffs in livestock feeding. The need for an extension strategy. In: Ukachukwu SN (Ed.), Animal production in the new millennium: Challenges and options. Book of proceedings of 25th Annual Conference of Nigeria in Society for Animal Production, Umudike, Abia State, Nigeria, pp: 366.
-
Ari MM, Barde RE, Ogah DM, Agede YI, Yusuf ND, et al. (2017) Utilization of garlic (Allium sativum) as supplementary phytogenic feed additive for broiler feed. Egyptian Poultry Science 32(1): 13-21.
-
Ari MM, Alu SE, Ogah DM (2016) The main processing methods and their influence on nutrients and antinutrient composition of flamboyant seeds Delonix regla Fulafia. Journal of Science and Technology 1: 43-48.
-
Baldwin RL, France J, Gill M (1987) Metabolism of the lactating cow: I. Animal elements of a mechanistic model. Journal of Dairy Research 54(1): 77-105.
-
Vendonov NS, Pesti GM (2008) Basic concepts describing animal growth and feed intake. Mechanistic Modelling in Pig and Poultry Production, 2006 Wallingford, UKCAB International pp: 22-53.
-
Pesti GM, Sterling KG, Bakalli RI (2009) Performance of different broiler genotypes fed diets with varying levels of dietary crude protein and lysine. Poultry Science 85(6): 1045-1054.
-
NIMET (2008) Nigerian Meteorological Agency, Lafia, Nasarawa State, Nigeria.
-
Anukam NA, Jairath S, Akır IC (2005) Determination of some probiotic properties on Lactobacilli and Bifidobacteria. PhD Thesis, Ankara University, Ankara, Turkey.
-
Alonge EO, Eruvbetine D, Idowu O, Obadina AO, Olukomaiya OO, et al. (2017) Effects of antibiotic, probiotic and prebiotic supplementation in broiler diets on performance characteristics and apparent nutrient digestibility. Journal of Applied Sciences and Environmental Management 21(7): 1297-1300.
-
Kabir SML, Rahman MM, Rahman MB, Ahmed SU (2004) The dynamics of probiotics on growth performance and immune response in broilers. International Journal of Poultry Science 3(5): 361-364.
-
Sekhon BS, Jairath S (2010) Prebiotics, Probiotics and Synbiotics: An Overview. Journal of Pharmaceutical Education and Research 1: 13-36.
-
Jin YW, Ho N, Abdullah N, Jalaludin S (2000) Probiotics in poultry: Growth enhancement and performance. World Poultry Science Journal 53: 351-368.
-
Apata D (2008) Growth performance, nutrient digestibility and immune response of broiler chicks fed diets supplemented with a culture of Lactobacillus bulgaricus. Journal of the Science of Food and Agriculture 88(7): 1253-1258.
-
Yu L, Lee E, Chen H, Jeong J, Choi Y, et al. (2011) Comparison of physicochemical characteristics of hot- boned chicken breast and leg muscles during storage at 20oC. Korean Journal for Food Science of Animal Resources 31(5): 676-683.
-
Tarun MP (2005) Effects of different strains of probiotic on the growth and organoleptic performance of Kabir Chicken. Dissertation pp: 56-89.
-
Owosibo AO, Odetola OM, Odunsi OO, Adejinmi OO, Lawrence AOO (2013) Growth, haematology and serum biochemistry of broilers fed probiotics based diets. African Journal of Agricultural Research 8(41): 5076- 5081.
-
Pillah MD (2002) Effect of graded level of rice offal in broiler diets. Nutrition Reports International 32(3): 659-666.
- Enhancement of Vegetative Growth and Fruit Yield in Cucumber (Cucumis sativus L.) via Spiritual Blessing (Biofield) Energy Intervention
- Production of Açaí (Euterpe oleracea Mart.) under Different Agroforestry System Management Intensities in Amazonian Floodplain (Varzea) Forests
- Coffee and the Production Region: What is the Secret to the Expression "Quality"?
- Experiential Agripreneurship Training in Sub-Saharan Africa: Integrating a Business Incubator into Postgraduate Livestock Education at the University of Buea
- Advances in Agricultural High-Quality Development
- Linking Compost Residue to ABAGE in Plants - a Short Note